Java Memory Architecture Cheat Sheet
Understand the Java Memory Model for the heap, as well as garbage collection algorithms, and memory leak best practices all with diagrams and bite-sized descriptions.
Join the DZone community and get the full member experience.
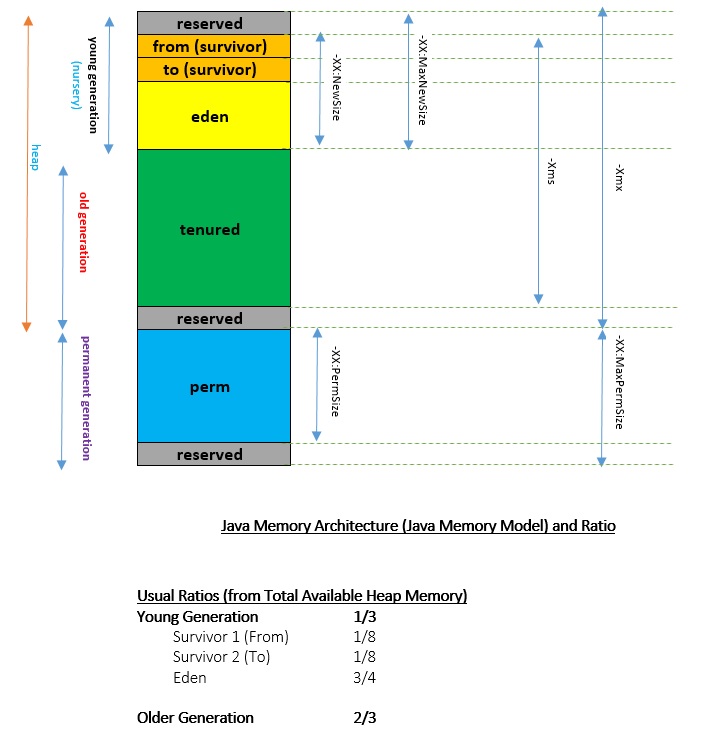
Join For FreeThe diagram below is the Java Memory Model for the Heap as well as the PermGen for any Java Application running in the Java Virtual Machine (JVM). The ratios are also provided to get a fair understanding of how the distribution of allowed memory is done across each of the generation types. All of the info is completely applicable up to Java 1.7 (inclusive). This diagram is also known as the 'Managed Area' of the memory model.
Java Memory Architecture (Java Memory Model)
In addition to the above, there is a Stack Area, which can be configured using the -Xss option. This area holds the references on the heap, native references, pc registers, code cache, and local variables for all threads. This is also known as the 'Native Area' of the memory model.
Managed Area of the Java Memory Model (Java Memory Architecture)
[Young Generation/Nursery] Eden Space
All new objects are first created in the Eden Space. As soon as it reaches an arbitrary threshold decided by the JVM, a minor garbage collection (Minor GC) kicks in. It first removes all the non-referenced objects and moves referenced objects from the 'eden' and 'from' into the 'to' survivor space. Once the GC is over, the 'from' and 'to' roles (names) are swapped.
[Young Generation/Nursery] Survivor 1 (From)
This is a part of the survivor space (You may think of this a role in the survivor space). This was the 'to' role during the previous garbage collection (GC).
[Young Generation/Nursery] Suvrivor 2 (To)
This is also a part of the survivor space (You may think of this as a role in the survivor space too). It is here, during the GC, that all the referenced objects are moved to, from 'from' and 'eden'.
[Old Generation] Tenured
Depending on the threshold limits, which can be checked by using -XX:+PrintTenuringDistribution, which shows the objects (space in bytes) by age, objects are moved from the 'to' Survivor space to the Tenured space. 'Age' is the number of times that it has moved within the survivor space.
There are other important flags like, -XX:InitialTenuringThreshold, -XX:MaxTenuringThreshold and -XX:TargetSurvivorRatio which lead to an optimum utilization of the tenured as well as the survivor spaces.
By setting -XX:InitialTenuringThreshold and -XX:MaxTenuringThreshold we allow an initial value and a maximum value for 'Age' while maintaining the percentage utilization in the 'Survivor (To)' as specified by the -XX:+NeverTenure and -XX:+AlwaysTenure, which encouraged never to be used to tenure an object (risky to use). The opposite usage is to always tenure, which means to always use the 'old generation'.
The garbage collection that happens here is the major garbage collection (Major GC). This is usually triggered when the heap is full or the old generation is full. This is usually a 'Stop-the-World' event or thread that takes over to perform the garbage collection. There is another type of GC named full garbage collection (Full GC) which involves other memory areas such as the permgen space.
Other important and interesting flags related to the overall heap are -XX:SurvivorRatio and -XX:NewRatio, which specify the eden space to the survivor space ratio and old generation to the new generation ratio.
[Permanent Generation] Permgen space
The 'Permgen' is used to store the following information: Constant Pool (Memory Pool), Field & Method Data and Code. Each of them related to the same specifics as their name suggests.
Garbage Collection Algorithms
Serial GC (-XX:UseSerialGC): GC on Young Generation and Old Generation
Use the simple mark-sweep-compact cycle for young and tenured generations. This is good for client systems and systems with low memory footprint and smaller CPU.
Parallel GC (-XX:UseParallelGC): GC on Young Generation and Old Generation
This uses N threads, which can be configured using -XX:ParallelGCThreads=N, here N is also the number of CPU cores for garbage collection. It uses these N threads for GC in the Young Generation but uses only one-thread in the Old Generation.
Parallel Old GC (-XX:UseParallelOldGC): GC on Young Generation and Old Generation
This is same as the Parallel GC, except that it uses N threads for GC in both Old and Young Generation.
Concurrent Mark and Sweep GC (-XX:ConcMarkSweepGC): GC on Old Generaton
As the name suggests, the CMS GC minimzes the pauses that are required for GC. It is most useful when used to create highly responsive applications and it does GC only in the Old Generation. It creates multiple threads for GC that work concurrently with applications threads, which can be specified using the -XX:ParallelCMSThreads=n.
G1 GC (-XX:UseG1GC): GC on Young and Old Generation (By Dividing Heap into Equal Size Regions)
This is a parallel, concurrent, and incrementally compacting low-pause garbage collector. G1 was introduced in Java 7 with the ultimate vision to replace CMS GC. It divides the heap into multiple, equal sized regions and then performs GC, usually starting with the region that has less live data, hence "Garbage First".
Most Common Out of Memory Issues
The most common out of memory issues, which all Java developers should know, are as follows:
- Exception in thread "main": java.lang.OutOfMemoryError: Java heap space. This does not necessarily imply a memory leak — as it could be due to lesser space configured for the heap. Otherwise, in a long-lived application it could be due to an unintentional reference being mentioned to heap objects (memory leak). Even the APIs that are called by the application could be holding references to objects that are unwarranted. Also, in applications that make excessive use of finalizers, sometimes the objects are queued into a finalization queue. When such an application creates higher priority threads and that leads to more and more objects in the finalizaton queue, it can cause an Out-of-Memory.
- Exception in thread "main": java.lang.OutOfMemoryError:PermGen space. If there are many classes and methods loaded or if there are many string literals created, especially through the use of intern() (From JDK 7 on, interned strings are no longer part of the PermGen), then this type of error occurs. When this kind of error occurs, the text ClassLoader.defineClass might appear near the top of the stack trace that is printed.
- Exception in thread "main": java.lang.OutOfMemoryError: Requested array size exceeds VM limit. This again happens when the requested array size is greater than the available heap size. It may usually occur due to programmatic errors during runtime if an incredibly large value is requested for an array size.
- Exception in thread "main": java.lang.OutOfMemoryError: request <s> bytes for <r>. Out of swap space? It is often the root cause of a memory leak. It happens when either the Operating System does not have sufficient swap space or when Another Process hogs all the available memory resources on the system. In simple terms, it was unable to provide the request space from heap due to exhaustion of space. The message indicates the size 's' (in bytes) of the request that failed and the reason 'r' for the memory request. In most cases the <r> part of the message is the name of a source module reporting the allocation failure, although in some cases it indicates a reason.
- Exception in thread "main": java.lang.OutOfMemoryError:<reason> <stack trace> (Native method). This indicates that a Native method has met with an allocation failure. The root cause was that the error occurred in JNI rather than in the code executing inside the JVM. When the native code does not check for memory allocation errors, then the application crashes instead of going out of memory.
Definition of Memory Leak
Think of memory leakage as a disease and the OutOfMemoryError as a symptom. But not all OutOfMemoryErrors imply memory leaks, and not all memory leaks manifest themselves as OutOfMemoryErrors.
From Wikipedia: In Computer Science, a memory leak is a type of resource leak that occurs when a computer program incorrectly manages memory allocations in such a way that memory, which is no longer needed, is not released. In Object-Oriented Programming, a memory leak may happen when an object is stored in memory but cannot be accessed by the running code.
Common Definitions of Memory Leak in Java
A memory leak occurs when object references that are no longer needed are unnecessarily maintained.
Memory leak in Java is a situation where some objects are not used by application any more, but GC fails to recognize them as unused.
A Memory Leak appears when an object is no longer used in the program but is still referenced somewhere at a location that is not reachable. Thus, the garbage collector cannot delete it. The memory space used for this object will not be released and the total memory used for the program will grow. This will degrade performances over time and the JVM may run out of memory.
In a way, Memory Leak would occur when No Memory can be Allocated on the Tenured Space.
Some of the most common causes of Memory Leaks are:
ThreadLocal Variables
Circular and Complex Bi-Directional References
JNI Memory Leaks
Static Fields that are Mutable (Most Common)
I recommend the usage of Visual VM bundled with the JDK to start debugging your memory leak issues.
Common Debugging of Memory Leaks
NetBeans Profiler
Using the jhat Utility
Creating a Heap Dump
Obtaining a Heap Histogram on a Running Process
Obtaining a Heap Histogram at OutOfMemoryError
Monitoring the Number of Objects Pending Finalization
Third Party Memory Debuggers
The common strategies or steps for going about debugging memory leak issues include:
Identify Symptoms
Enable Verbose Garbage Collection
Enable Profiling
Analyze the Trace
Published at DZone with permission of Sumith Puri. See the original article here.
Opinions expressed by DZone contributors are their own.
Comments