Kafka Monitoring via Prometheus-Grafana
In this article, take a look at Kafka monitoring via Prometheus-Grfana.
Join the DZone community and get the full member experience.
Join For FreeHi guys,
Today I will explain how to configure Apache Kafka Metrics in Prometheus - Grafana and give information about some of the metrics.
First of all, we need to download (https://github.com/prometheus/jmx_exporter) and have to define a proper yml file in order to expose Kafka related metrics. In here there is an example file we can use https://github.com/prometheus/jmx_exporter/blob/master/example_configs/kafka-2_0_0.yml
We need to configure jmx exporter in Kafka Broker & Zookeeper startup scripts.We just have to add KAFKA_OPTS definition in the startup scripts of all zookeepers and brokers as follows
export KAFKA_OPTS="-javaagent:/kafka/prometheus/prometheus_agent/jmx_prometheus_javaagent-0.12.0.jar=7073:/kafka/prometheus/prometheus_agent/kafka-2_0_0.yml"
You can download and install the proper Prometheus version from here https://prometheus.io/download/
We have to add our scrape configurations into prometheus.yml file.
x
- job_name: 'kafka-server'
static_configs:
- targets: ['127.0.0.1:7071','127.0.0.2:7072','127.0.0.1:7075']
- job_name: 'kafka-zookeper'
static_configs:
- targets: ['127.0.0.1:7073','127.0.0.1:7074','127.0.0.2:7076']
You can add scrape_interval parameter in your configuration by default it is every 1 minute scrape_interval: 5s
Prometheus has its own query language called promql. You can learn more about this language from this here https://prometheus.io/docs/prometheus/latest/querying/basics/
There are lot of metrics you can define for Kafka. I will mention a few of them in this article
Memory Usage
jvm_memory_bytes_used{job="kafka-server",instance="127.0.0.1:7075"}
when you execute this query in Prometheus you will get two lines with heap and nonheap values.
| Element | Value |
|---|---|
| jvm_memory_bytes_used{area="heap",instance="127.0.0.1:7075",job="kafka-server"} | 1197992536 |
| jvm_memory_bytes_used{area="nonheap",instance="127.0.0.1:7075",job="kafka-server"} | 63432792 |
In order to sum them without looking to area you have to run the query like this
sum without(area)(jvm_memory_bytes_used{job="kafka-server",instance="127.0.0.1:7075"})
| Element | Value |
|---|---|
| {instance="127.0.0.1:7075",job="kafka-server"} | 1084511712 |
Cpu Usage
In order get cpu values you can run process_cpu_seconds_total query in prometheus
process_cpu_seconds_total{job="kafka-server",instance="127.0.0.2:7072"}
| Element | Value |
|---|---|
| process_cpu_seconds_total{instance="127.0.0.2:7072",job="kafka-server"} | 315.12 |
To make this query more relevant we have to use rate function .With this function we can measure rate of the cpu counter changes for a period of time
For example in order to measure changes in 5 minutes of range we can define like this
rate(process_cpu_seconds_total{job="kafka-server",instance="127.0.0.1:7071"} [5m])
| Element | Value |
|---|---|
| {instance="127.0.0.1:7071",job="kafka-server"} | 0.068561403508772 |
Total messages processed per topic in brokers
In order to show total messages processed per topic in brokers you can use this query
kafka_server_brokertopicmetrics_messagesin_total{job="kafka-server",topic="TEST-TOPIC"}
| Element | Value |
|---|---|
| kafka_server_brokertopicmetrics_messagesin_total{instance="127.0.0.1:7071",job="kafka-server",topic="TEST-TOPIC"} | 1 |
| kafka_server_brokertopicmetrics_messagesin_total{instance="127.0.0.2:7075",job="kafka-server",topic="TEST-TOPIC"} | 2 |
One of the most important metric that has to be monitored is the Consumer Lag which is simply the delta between the Latest Offset and Consumer Offset.
You can examine it from the command prompt via ./kafka-consumer-groups script
x
TOPIC PARTITION CURRENT-OFFSET LOG-END-OFFSET LAG CONSUMER-ID HOST CLIENT-ID
TEST-TOPIC 0 2 2 0 consumer-1-896694c8-8ee4-4447-9a20-fc8d080d56a8 /127.0.0.1 consumer-1
TEST-TOPIC 1 1 1 0 consumer-1-896694c8-8ee4-4447-9a20-fc8d080d56a8 /127.0.0.1 consumer-1
TEST-TOPIC 2 2 2 0 consumer-1-896694c8-8ee4-4447-9a20-fc8d080d56a8 /127.0.0.1 consumer-1
You cant show consumer lag efficiently with jmx exporter. However there are some other open source projects which solves this issue such as Kafka Exporter. We can download it from here https://github.com/danielqsj/kafka_exporter#consumer-groups
After we configured the kafa_exporter We have to add our scraping job definition to prometheus.yml file
- job_name: 'kafka-exporter'
static_configs:
- targets: ['127.0.0.1:9308']
After that you can run your kafka_consumergroup_lag query in prometheus .
kafka_consumergroup_lag{topic="TEST-TOPIC"}
| Element | Value |
|---|---|
| kafka_consumergroup_lag{consumergroup="CONSUMER-TEST-GROUP",instance="127.0.0.1:9308",job="kafka-exporter",partition="0",topic="TEST-TOPIC"} | 0 |
| kafka_consumergroup_lag{consumergroup="CONSUMER-TEST-GROUP",instance="127.0.0.1:9308",job="kafka-exporter",partition="1",topic="TEST-TOPIC"} | 0 |
| kafka_consumergroup_lag{consumergroup="CONSUMER-TEST-GROUP",instance="127.0.0.1:9308",job="kafka-exporter",partition="2",topic="TEST-TOPIC"} | 0 |
Since I couldn't created a lag via kafka_producer script I couldn't show the value but with real time data if any latency occurs we would see the value is increasing.
Here you can find some other metrics with a short explanation:
kafka_controller_kafkacontroller_offlinepartitionscount
It's the total count of partition which don't have an active leader.
kafka_topic_partition_in_sync_replica
Total number of ISR value per partition
kafka_cluster_partition_underminisr
Number of partitions whose in-sync replicas count is less than minIsr.
kafka_server_replicamanager_underreplicatedpartitions
the number of non-reassigning replicas
kafka_controller_controllerstats_leaderelectionrateandtimems
If the leader partition goes down Kafka elects new leader partition from the in synch replica partitions.This metric shows the election rate.
You can find all the metric in Apache Kafka documentation
https://kafka.apache.org/documentation/
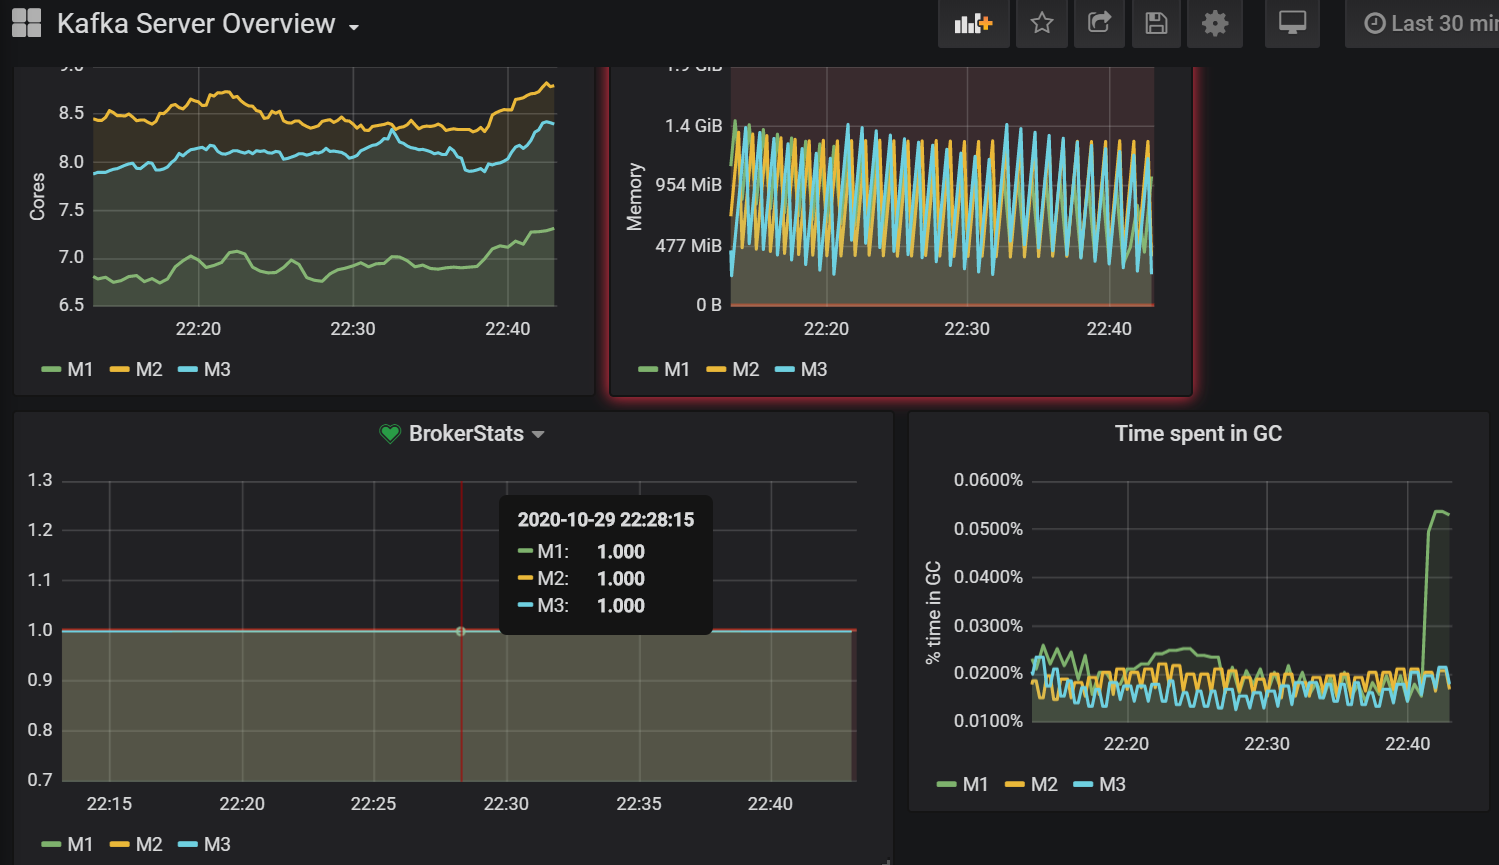
In order to use a graphical interface we can use Grafana.
You can download the proper Grafana version from here https://grafana.com/grafana/download
After installing we need to add Prometheus as a datasource to Grafana

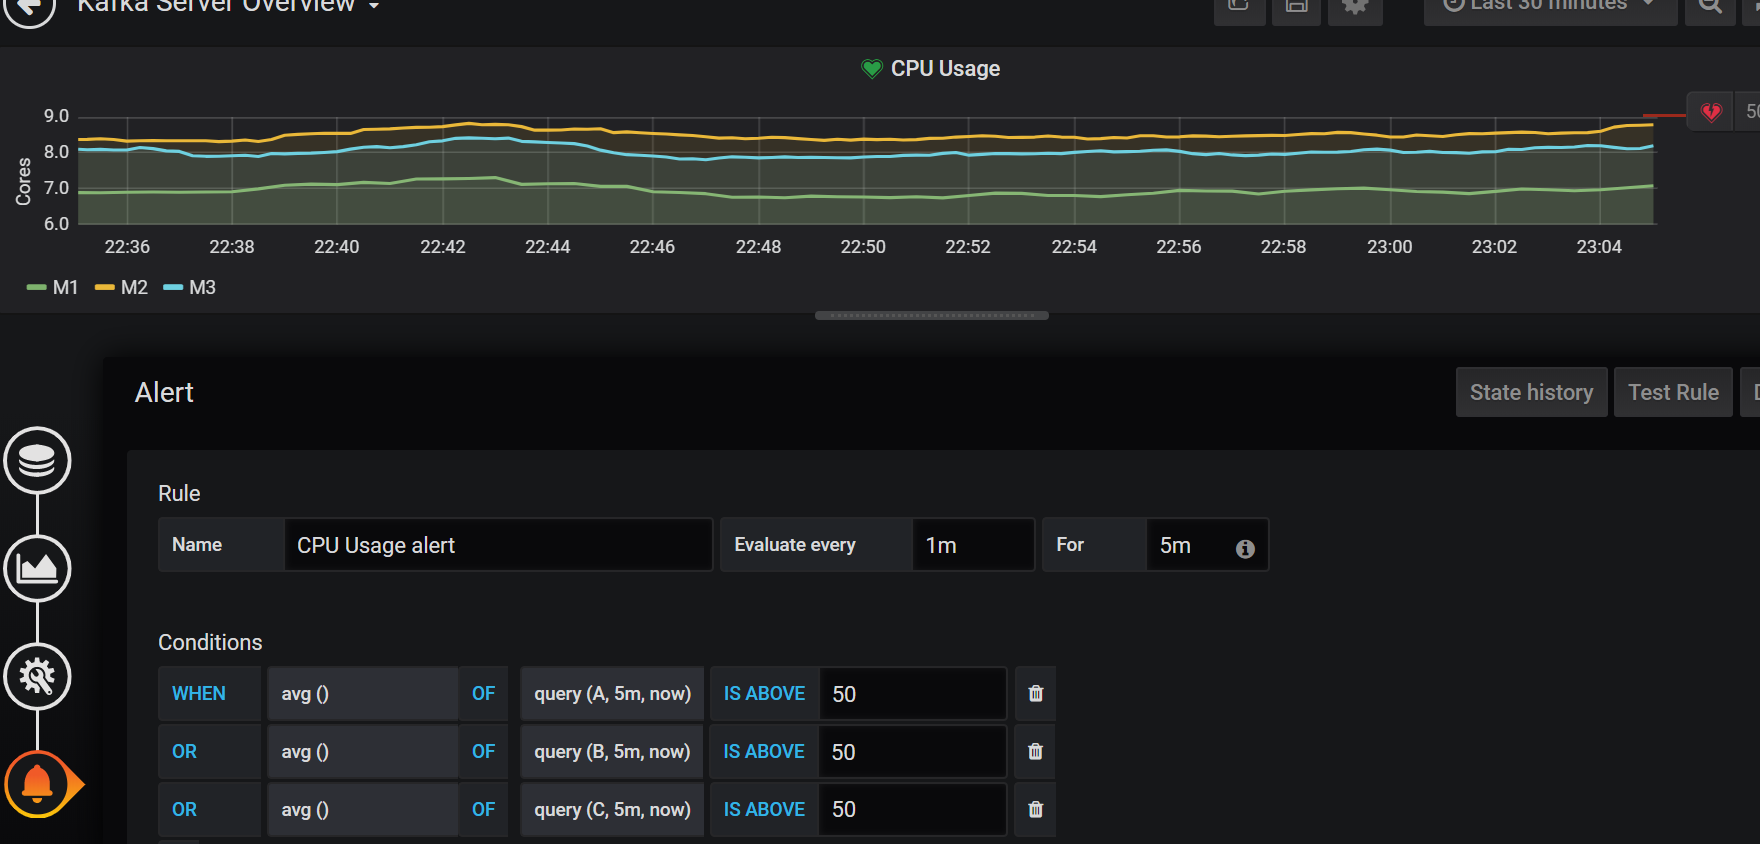
You can define Alarms with using conditions and aggregate functions
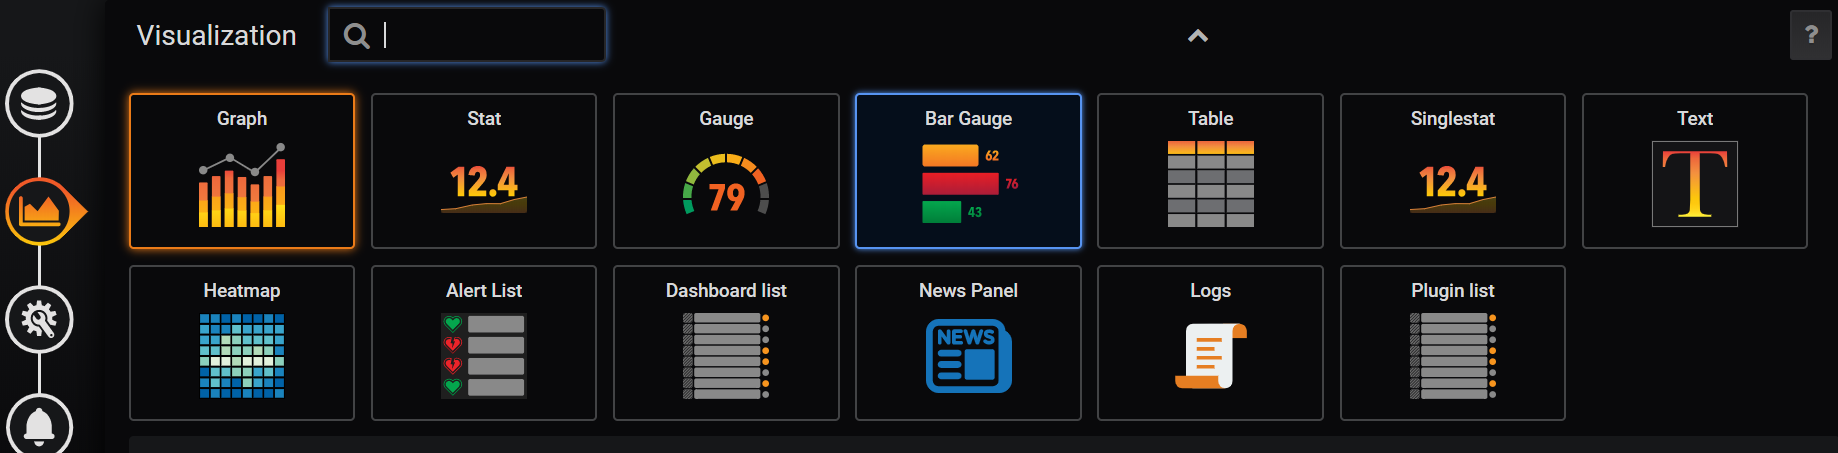
You can show your metrics in different type of visualisations
Opinions expressed by DZone contributors are their own.
Comments