Organizing Logging Between the Three IBM App Connect Form Factors
Learn how to coordinate your logging strategy across ACE, ACEcc, and ACEaaS, and how to access the more common form of logging across all the form factors.
Join the DZone community and get the full member experience.
Join For FreeThe App Connect product enables you to integrate anything to anything. Its core routing and transformation engine enables you to inspect and transform messages from a wide variety of industry-standard and custom message models. But with great power can come complexity! Being generic and having the ability to run your integration flows on different form factors can give you a lot of options. This article aims to help you coordinate your logging strategy across these different form factors and to clarify where and how you can get access to the more common form of logging across all the form factors.
Form Factors
The App Connect runtime runs on 3 distinct form factors, all capable of running BAR files containing Integration Flows. These BARs can be moved between each form factor. You can create a BAR file using the ACE Toolkit or the App Connect Designer UI.
1. App Connect Enterprise (ACE)
This is a single runtime that can be administered by connecting to the WebUI port (default: 7600). Generally, it runs on Virtual Machines and servers so the complete environment is visible to an administrator, but visibility and actions can be restricted for individual users.
2. App Connect Enterprise Certified Container (ACEcc)
These are multiple ACE runtimes running in k8s pods so they cannot connect directly to all at once for administration. They are configured using an IntegrationRuntime Custom Resource, which is used by the App Connect Operator in a k8s environment to create runtime objects. All pods are visible by the k8s administrator and standard RBAC rules can be applied. Extra configuration can be provided to supply extra server.conf.yaml settings, for example.
3. App Connect iPaaS (ACEaaS)
As with ACEcc, ACEaaS is orchestrated in a k8s environment, but this environment is more restricted with no direct visibility of the k8s pods. All logs need to be output to the IntegrationRuntime's console log and then they can be scraped into a Prometheus log storage which is queried and viewed in the ACEaaS Log viewer. This can be configured in the same way as the ACEcc runtime using configurations.
Logging
Logging has a level of verboseness, ranging from very verbose Service Trace to User Trace and then to a more succinct user-focused Activity Log. All this logging can be turned on and off, as there can be a performance impact to it, as there is within any integration runtime.
Logging Nodes
These are nodes that are used exclusively to output user-defined log messages. They can be customized to output to various locations and can contain information from the flow runs. For example:
|
ACE |
ACEcc |
ACEaaS |
|
ACELog Node (Created in the ACE Toolkit) (Created in the ACE Toolkit) |
ResourceManagers: ActivityLogManager: minSeverityLevel: 'DEBUG' |
ResourceManagers:
  ActivityLogManager:
    minSeverityLevel: 'DEBUG'
ActivityLog:
  MyLoggingConfiguration:
    filter: TYPE=LOG
    consoleLog: true
    consoleLogFormat: 'text'
    minSeverityLevel: 'DEBUG'
|
ActivityLog:
  MyLoggingConfiguration:
    filter: TYPE=LOG
    consoleLog: true
    consoleLogFormat: 'ibmjson'
ResourceManagers:
  ActivityLogManager:
    minSeverityLevel: 'DEBUG'
|
|
Designer Log Node
(Created in Designer Authoring) |
N/A |
spec:
  template:
    spec:
      containers:
        - name: designerflows
          env:
            - name: 'SINGLE_TENANT_USER_TRACE'
              value: 'debug'
or from 12.0.12.5 you can set the following:
ResourceManagers: ActivityLogManager: minSeverityLevel: 'DEBUG' |
ResourceManagers:
  ActivityLogManager:
    minSeverityLevel: 'DEBUG'
|
|
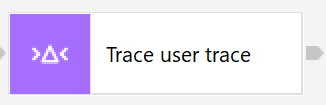
Trace Node
(Created in the ACE Toolkit) |
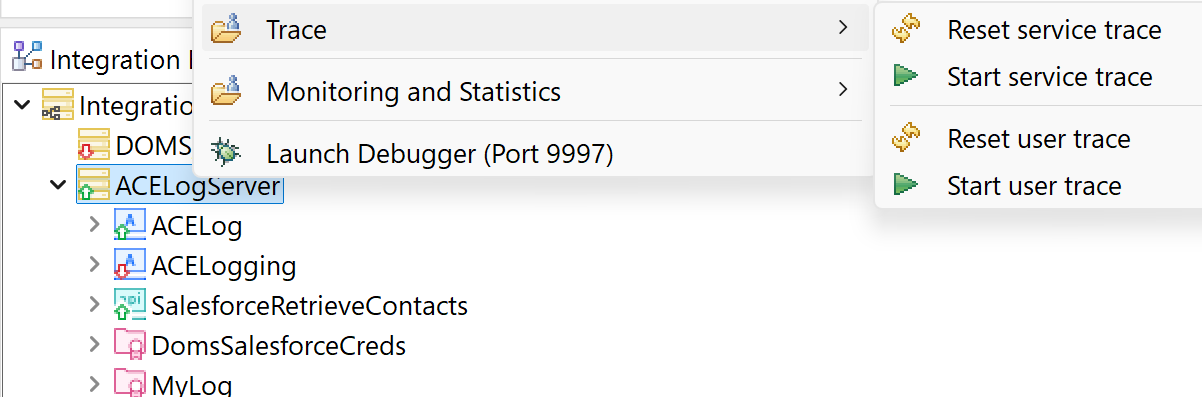
Outputs to either User Trace (See User Trace section below on how to retrieve), File, or Local Error Log (console log) |
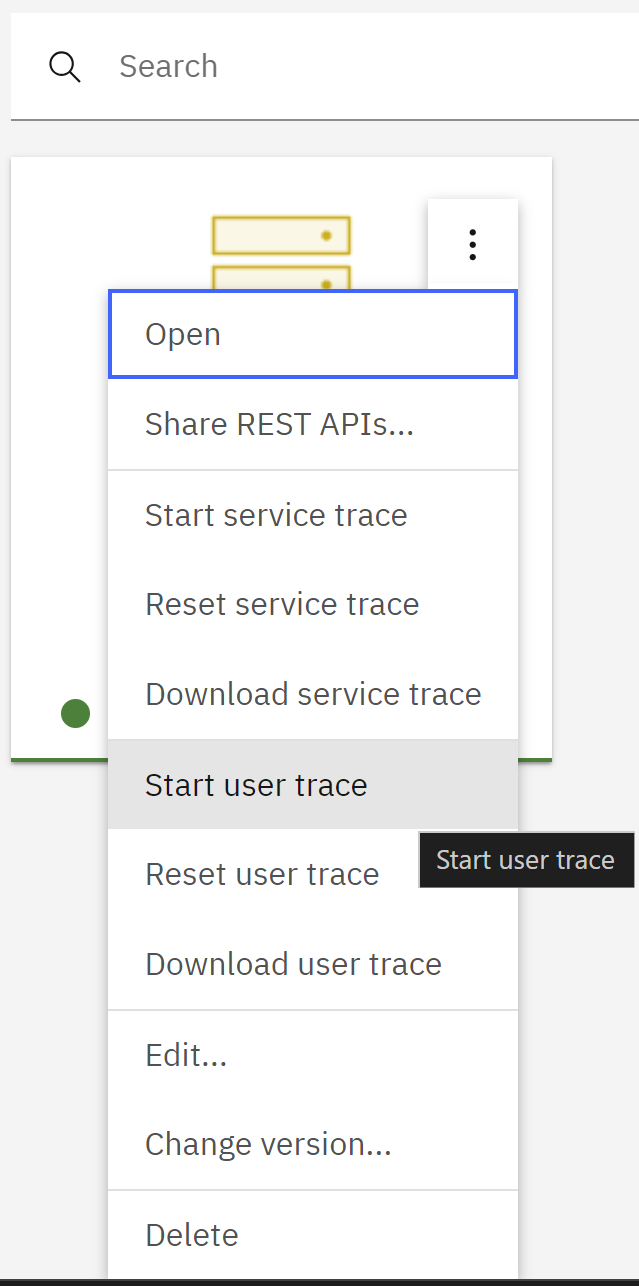
Outputs to User Trace (retrieved through the Dashboard UI), File, or Local Error Log (console log) |
Output to User Trace and then can be retrieved through the Dashboard UI as with ACEcc |
Tracing
Tracing the integration flows allows you to see what path any messages have taken through your flow and can be very verbose like service trace (normally only to investigate any product issues) or less verbose like user trace.
|
ACE |
ACEcc |
ACEaaS |
|
|
User Trace (Also includes all ActivityLog entries) |
- <workdir>/config/common/log
- /var/mqsi/common/log (AIX and Linux)
- C:\ProgramData\IBM\mqsi\common\log (Windows)
|
Uses a Trace configuration to enable and then pull back any created trace files; All achievable through the Dashboard UI.
|
Uses a Trace configuration to enable and then pull back all achievable through the Dashboard UI as in ACEcc |
|
Service Trace (Much lower-level trace meant mostly for the App Connect Service team) |
Same as above for User Trace, more details here |
Uses a Trace configuration to enable and then pull back; All achievable through the Dashboard UI, again the same mechanism as User Trace above. | Uses a Trace configuration to enable and then pull back all achievable through the Dashboard UI as in ACEcc |
ActivityLog
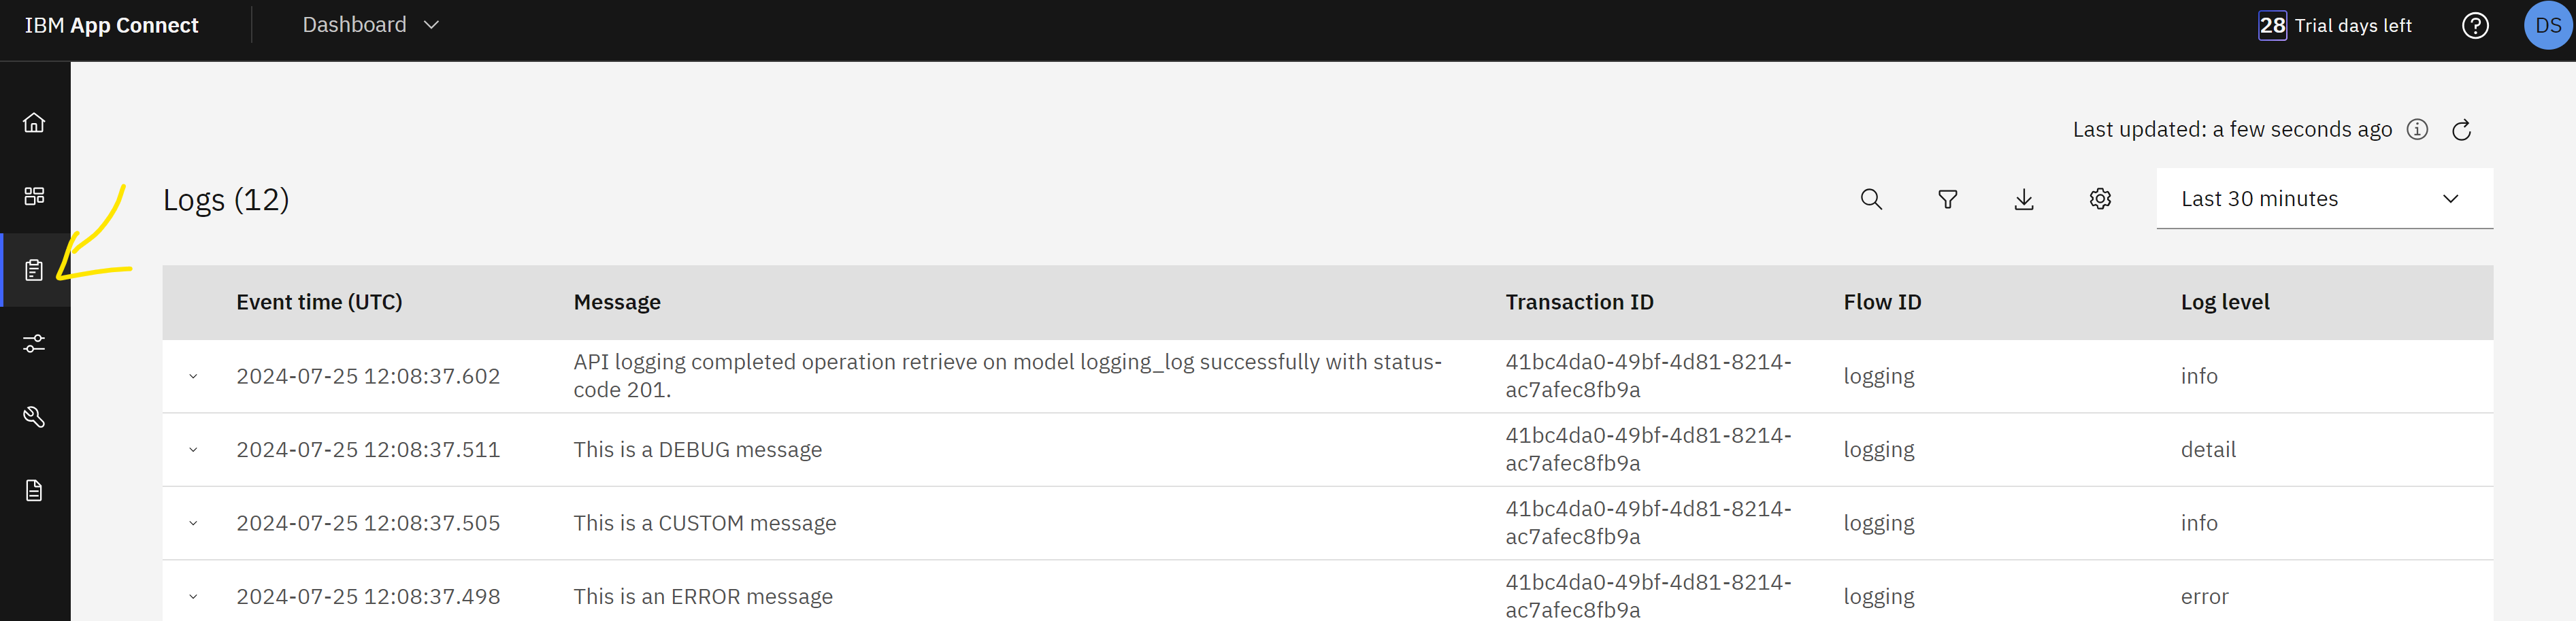
The ActivityLog can be viewed in ACE and ACEcc in the admin UI. (For ACEcc, you need to specify a specific replica to be able to view this). This is stored in memory but can be configured in the server.conf.yaml to output to several places all in parallel, ranging from file to an ELK stack, for example. You can consolidate the view in ACEcc or ACEaaS by sending the output to the console.
For ACEcc there is also the consideration of your k8s RBACs, the Dashboard and Designer here run as a single user.
More details on configuring the ActivityLog output are here.

There are a large number of ActivityLog types that can be found in the Activity log structure and types documentation. For example, the CICS ActivityLog:
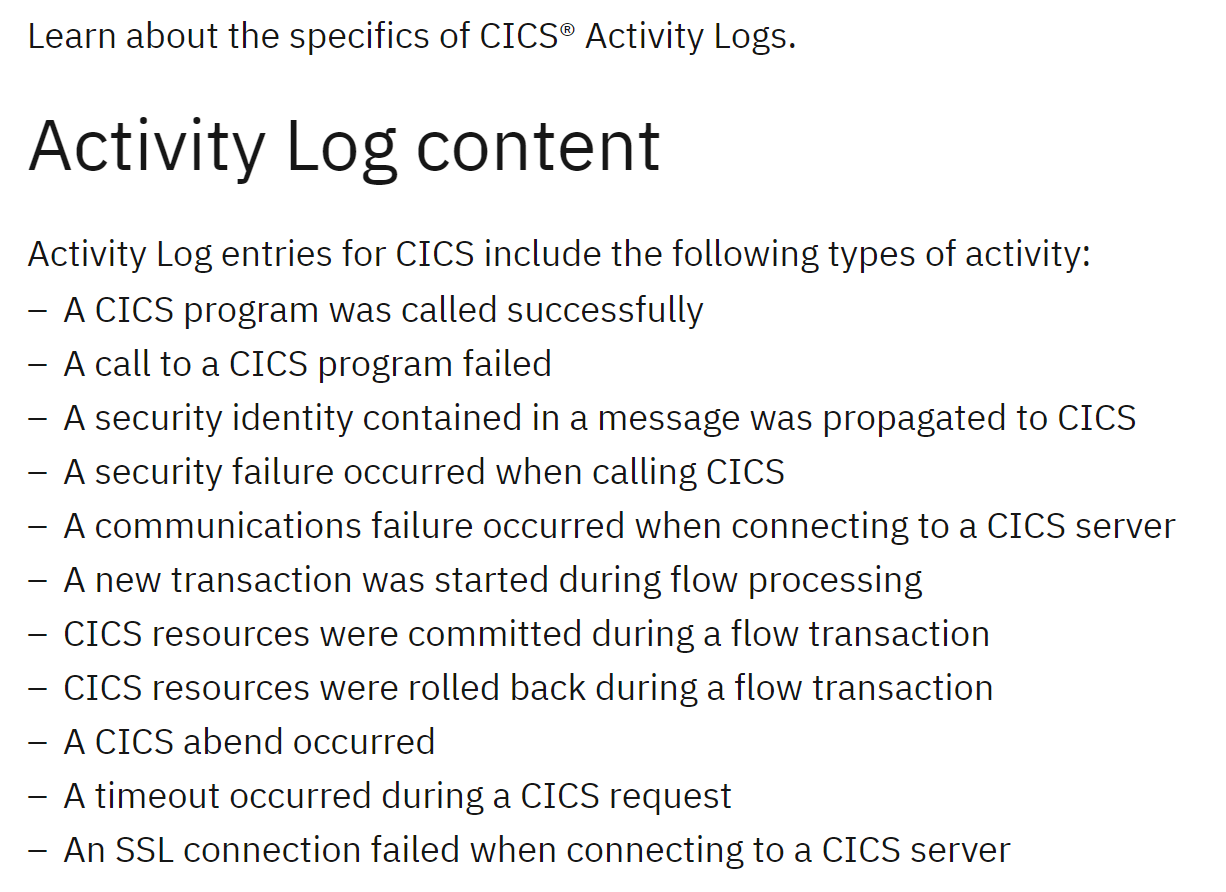
They can all be configured to output across all three of the App Connect form factors by using the ActivityLog stanza in the ACE runtime server.conf.yaml.
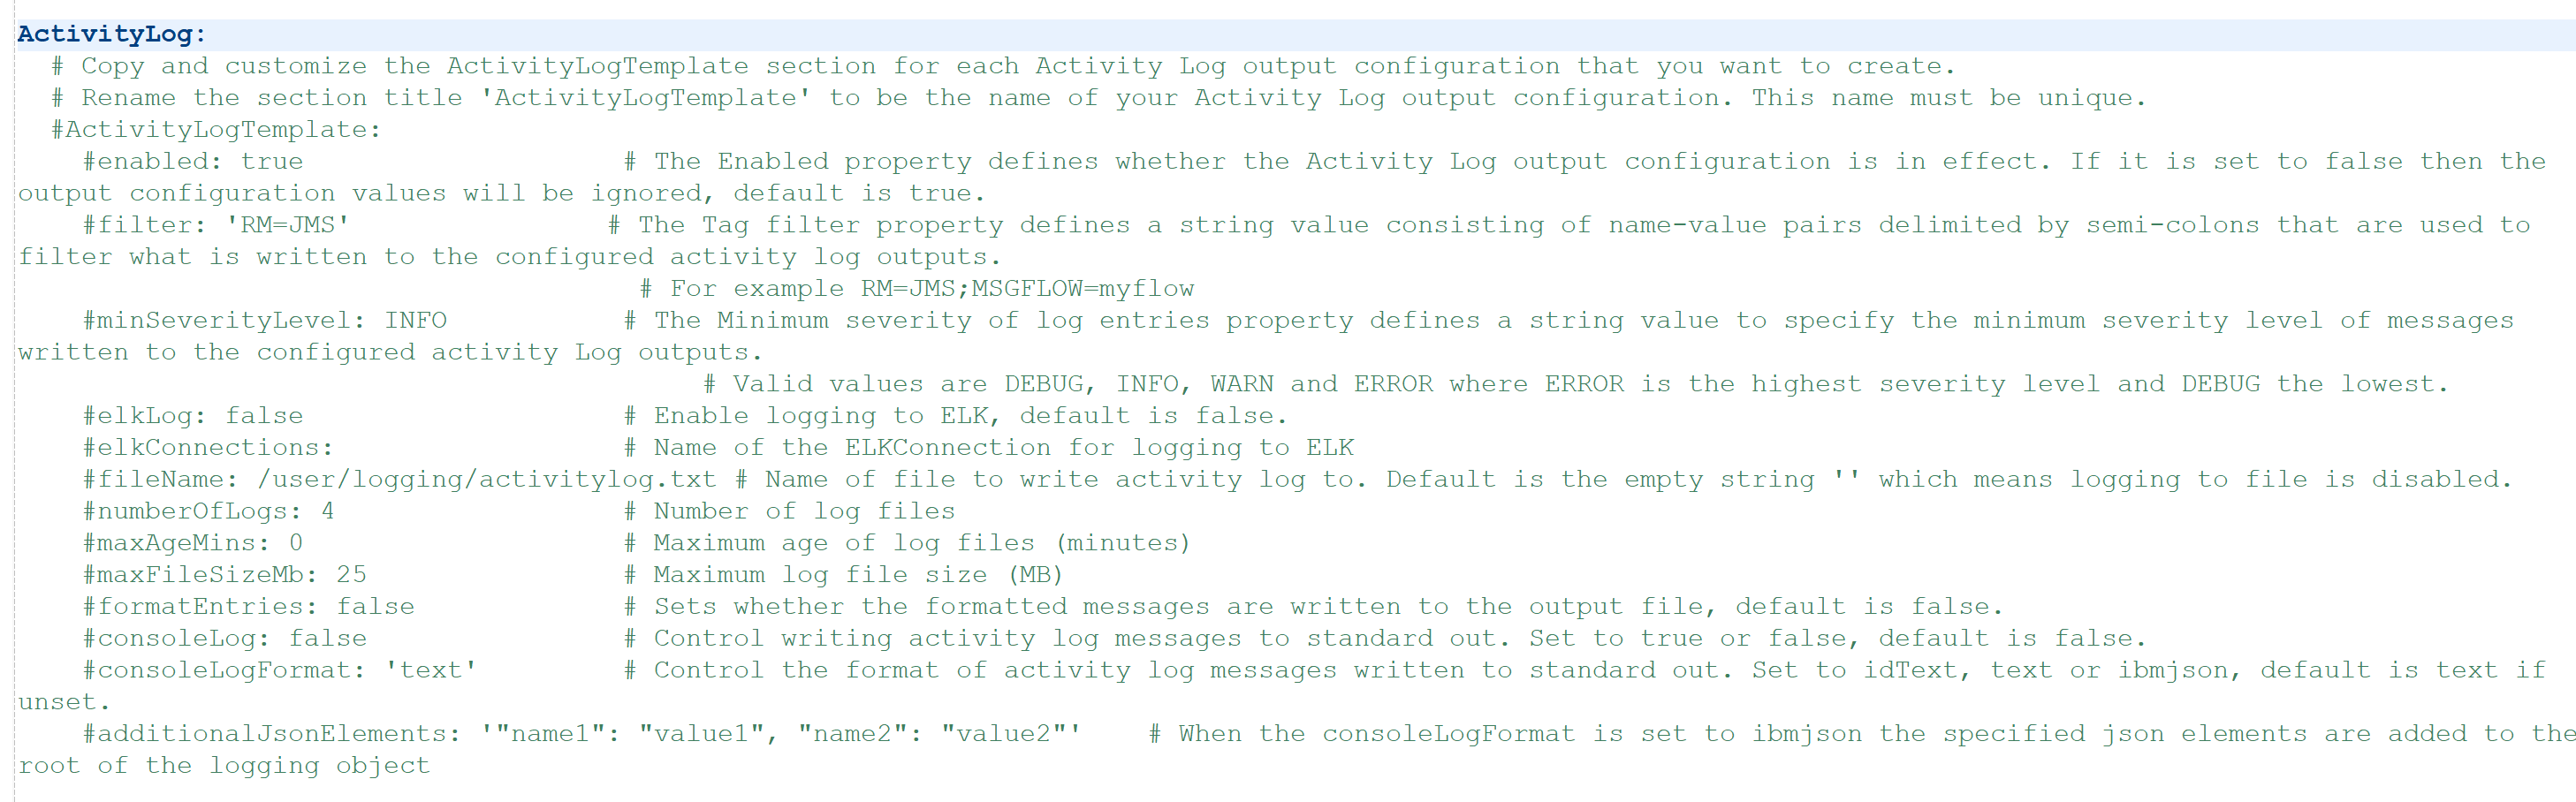
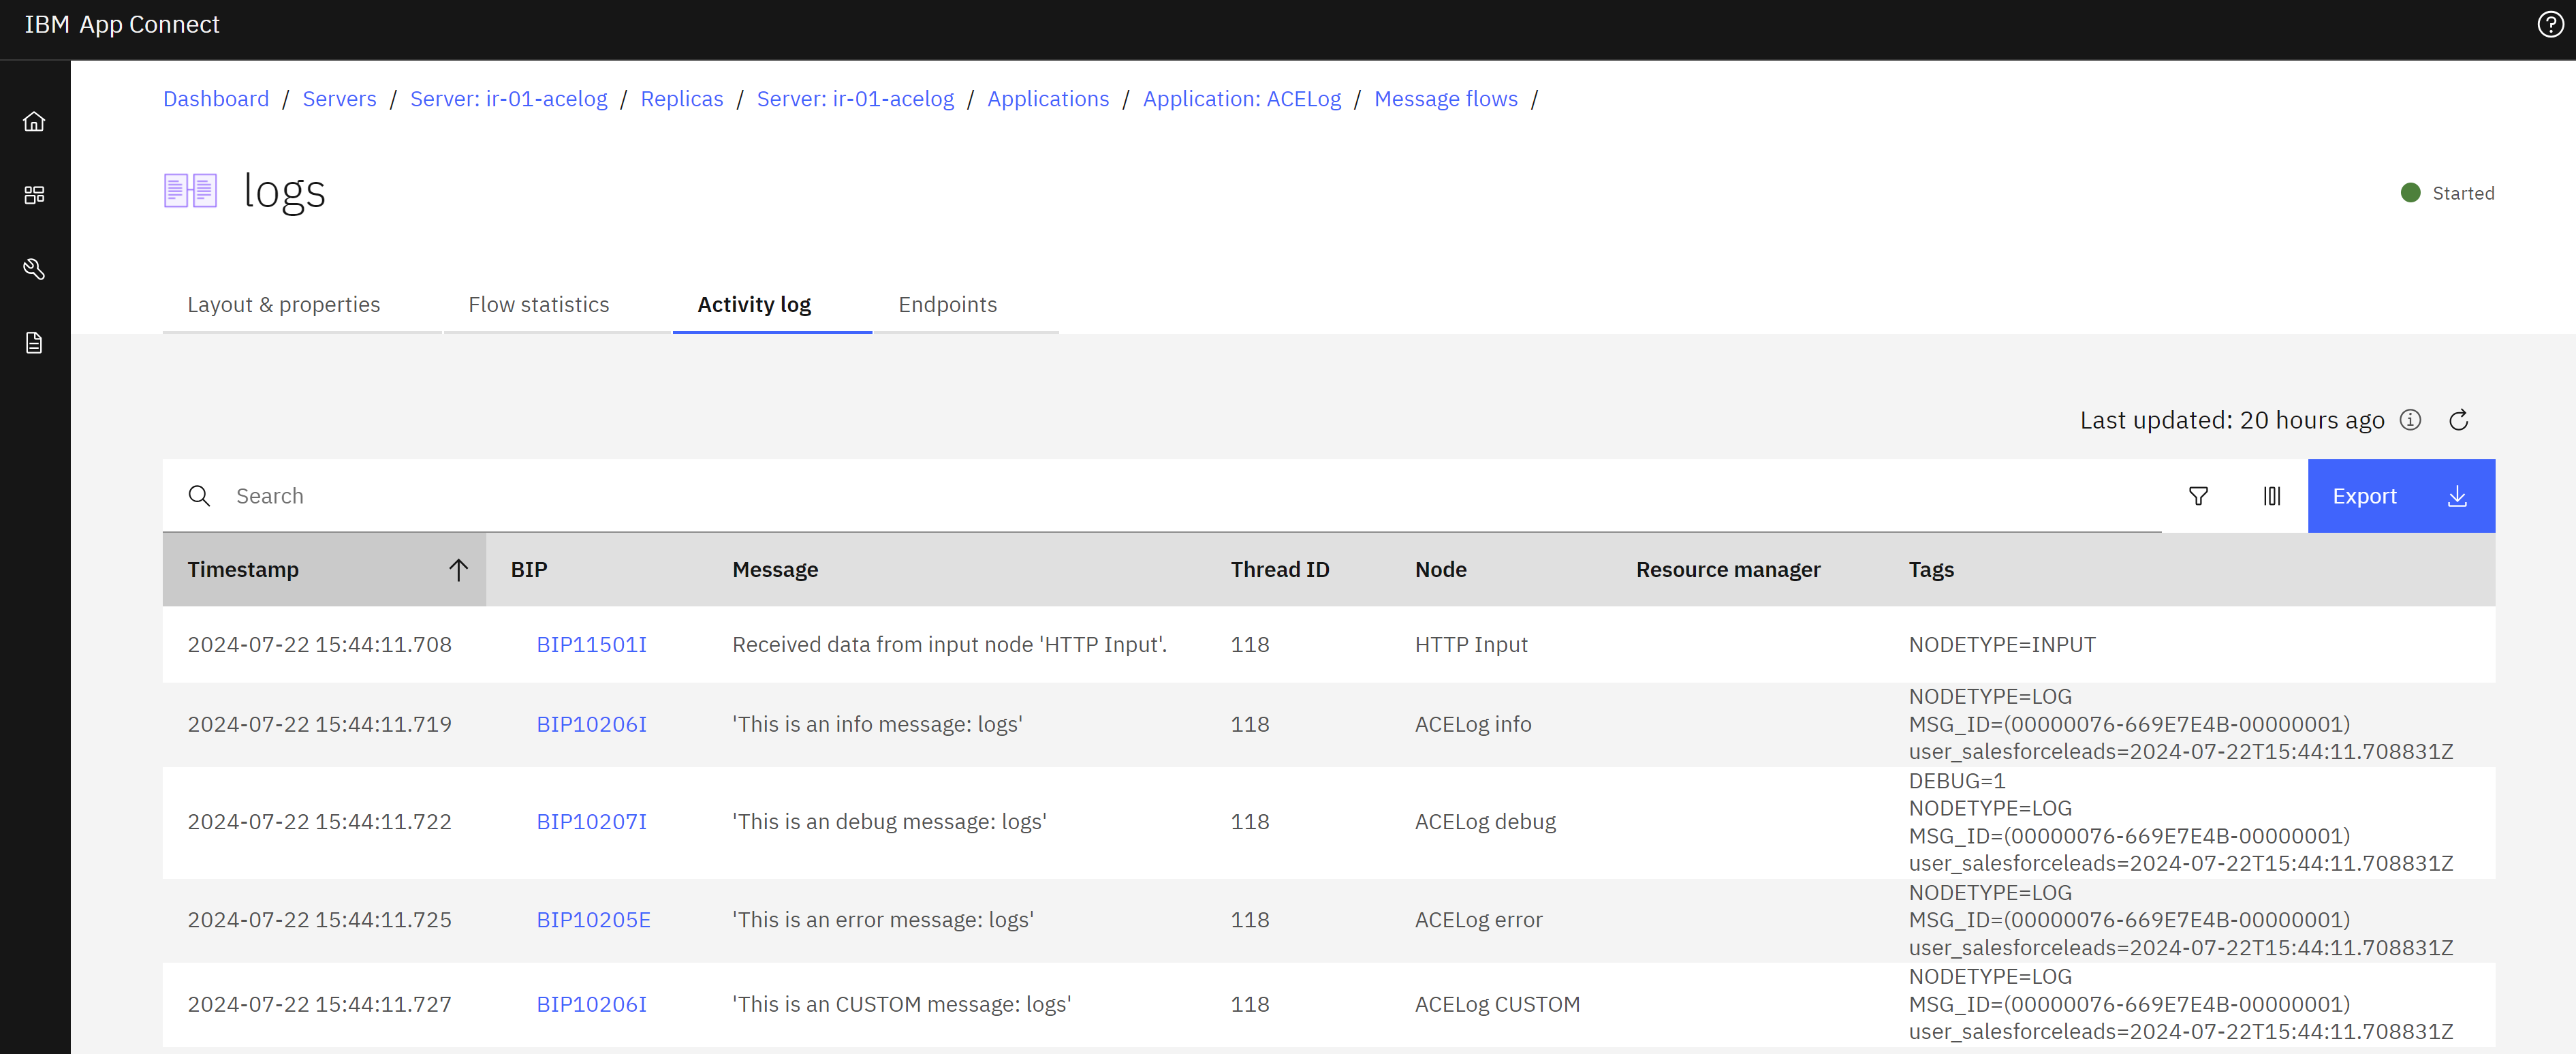
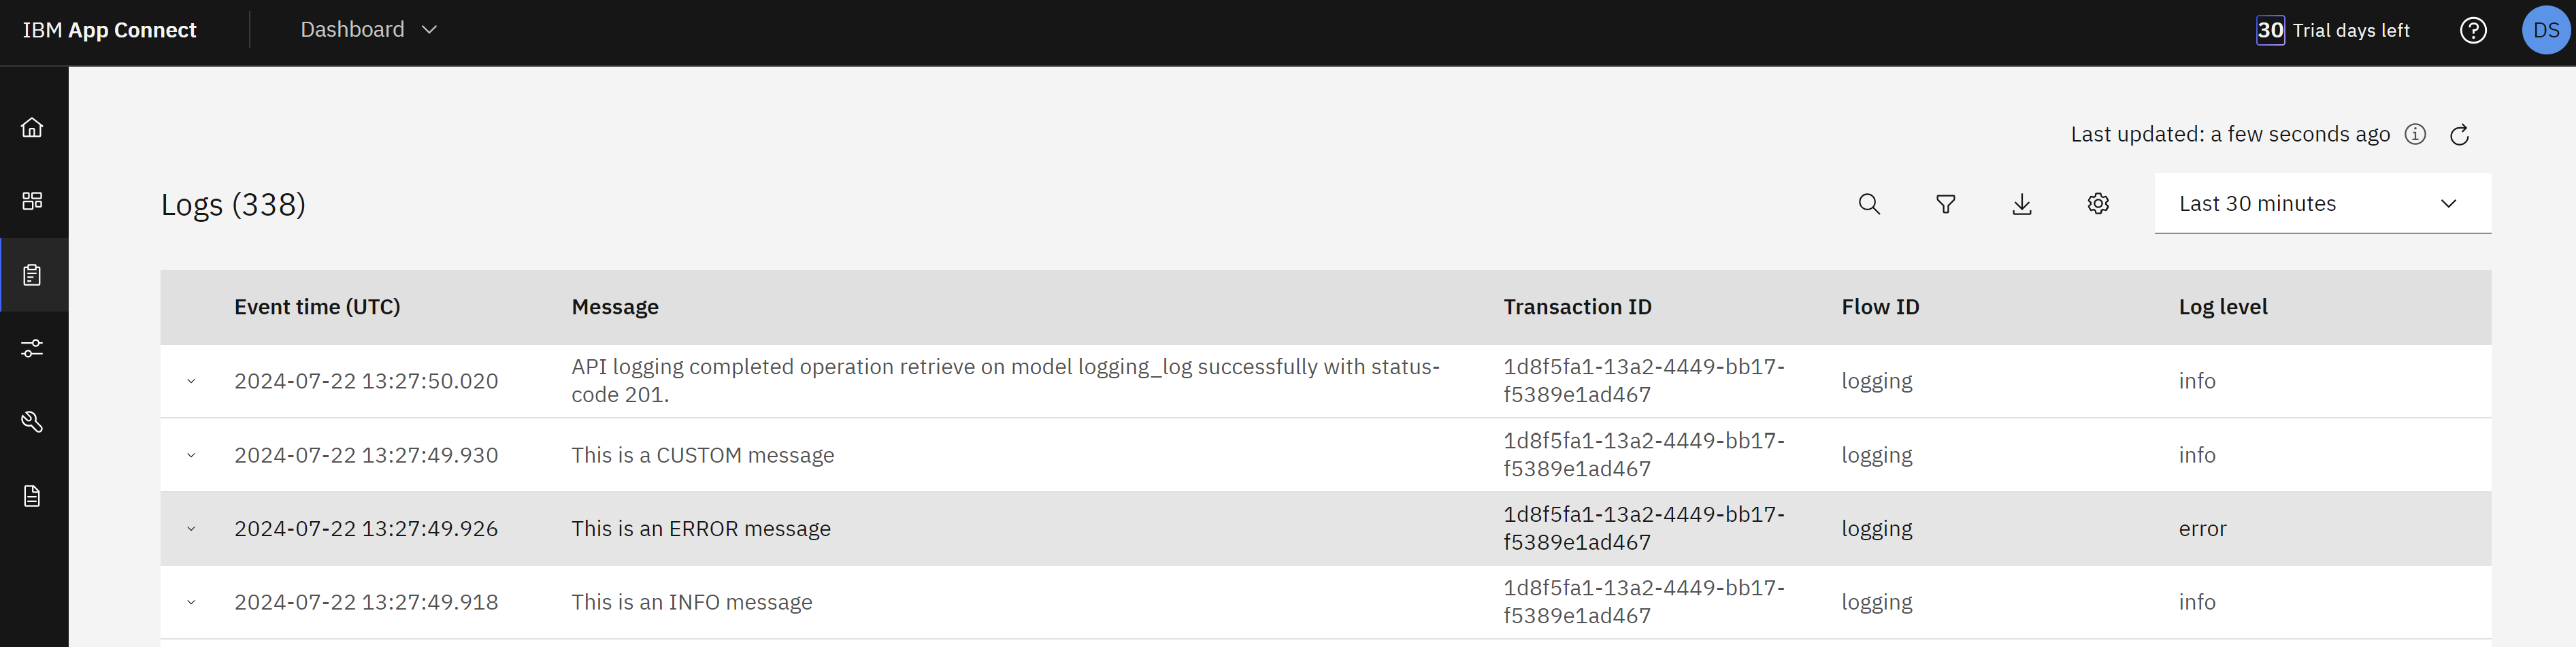
The 'ActivityLogTemplate' name can be anything you want, and you can then configure the filter to output what you want; for example, filter: RM=CICS;RM=JMS to output the CICS and JMS ActivityLog to a specific location. As mentioned in the table above, to see these entries in ACEcc or ACEaaS, you then need to specify consoleLog: true and consoleLogFormat: 'ibmjson' so that the entries are output to the console. For ACEaaS these can then be viewed in the Logs view.
Advanced Tracing Links
Conclusion
The granularity of logging and tracing is very customizable within the App Connect product, so this can make it complex to get to the exact logging you require. We have tried to make the common flow logging as accessible as possible with the Activity Log being a common factor, but we are constantly looking to improve the useability of App Connect in all our 3 form factors.
If there is anything you would like to see improved, please raise a request for a feature improvement.
Opinions expressed by DZone contributors are their own.
Comments