Logging With the Elastic Stack
It's imperative to have a system that can analyze large amounts of logs and present a singular view. Centralized logging provided by the Elastic Stack is a step in the right direction.
Join the DZone community and get the full member experience.
Join For FreeApplications generate logs because they serve as a mirror to their state and health.
With the voluminous amount of generated logs, it becomes imperative to have a system that can analyze these logs and present a singular view of the application. When the application is deployed in a distributed environment, maintaining and retrieving the logs can be challenging.
Searching for an error across several servers and through a large number of log files is extremely difficult.
The Open-Source Elastic Stack
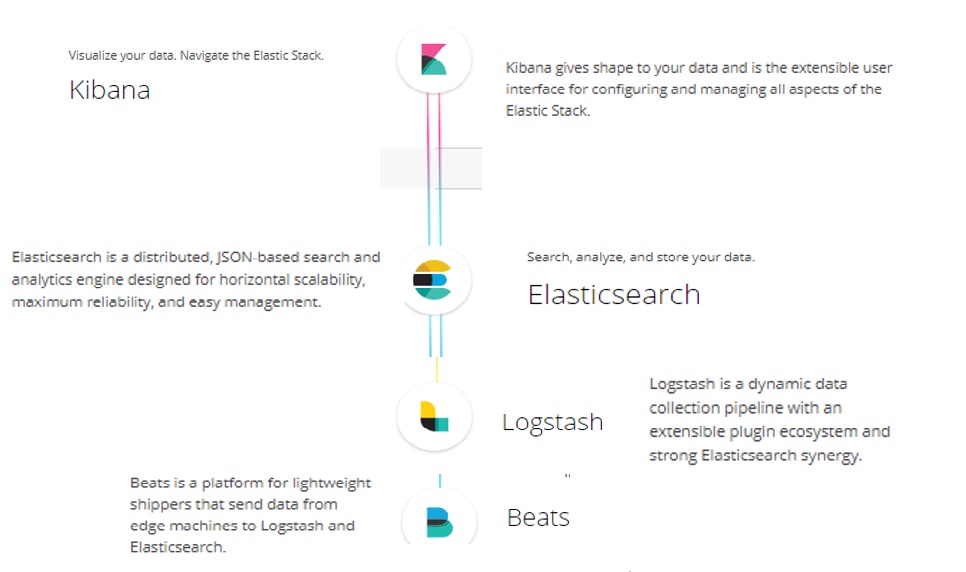
Centralized logging provided by the Elastic Stack is a step in this direction. It allows searching through all logs at a central place. The Elastic Stack is a versatile collection of open-source software tools that are implemented based on a distributed log collector approach that makes gathering insights from data easier. It is also referred to as the ELK stack (Elasticsearch, Logstash, Kibana).

- Filebeat is a lightweight application that can read logs and forward to Logstash.
- Logstash is used for data collection and sets up a transportation pipeline. It processes log events and data sources and sends them to various outputs.
- Elasticsearch is a log search engine. It can be set up in a scalable model and is highly reliable.
- Kibana is a tool which provides data visualization for Elasticsearch.
Logical Architecture
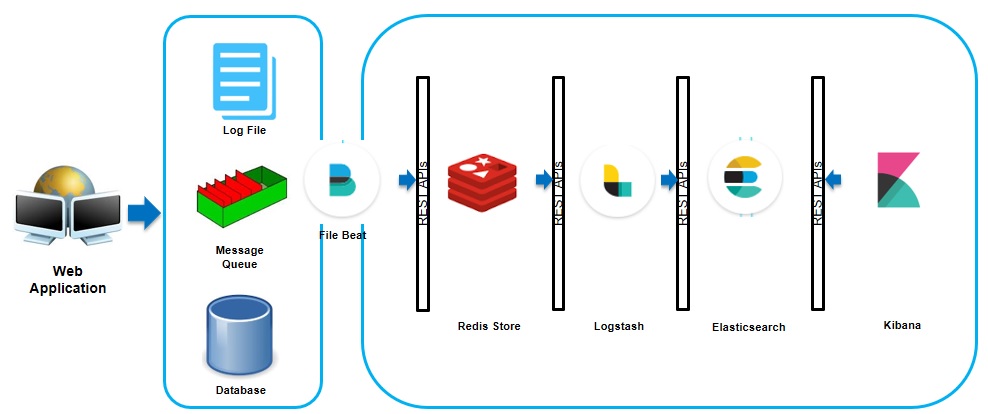
The below image indicates logical architecture of the Elastic Stack.

Different kinds of logs are generated like system log files, database log files, logs generated by message queues, and other middlewares. These logs are collected by Filebeat installed on all servers producing logs. Filebeat sends the logs to Redis for store and forward. Redis serves as a temporary storage area for logs coming from beats. It further supplies these logs to Logstash at a fixed interval.
Logstash transforms the logs and processes them as configured. Elasticsearch will then index and store these logs. Finally, Kibana provides a visual interface for searching and analyzing the logs.
Deployment Architecture
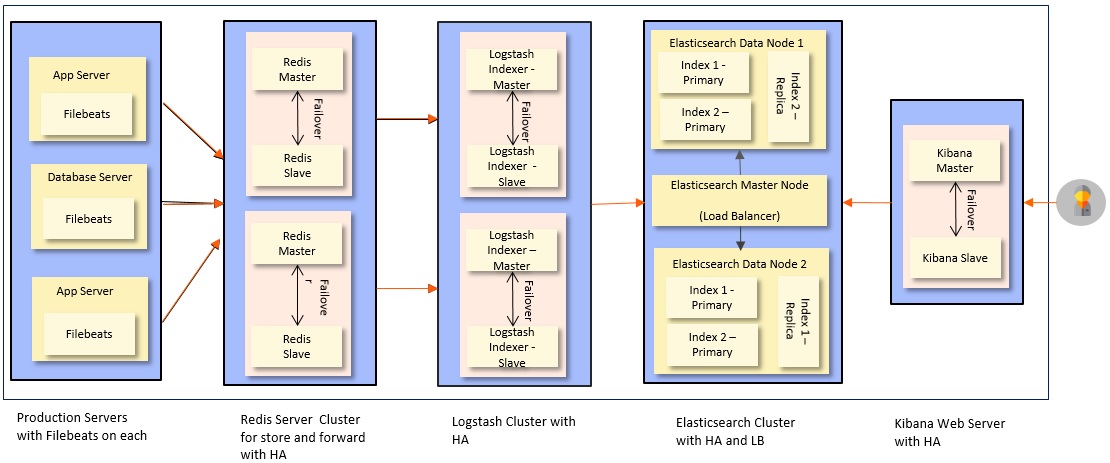
A suggested deployment of the Elastic Stack is given below. It ensures high availability and load balancing.

Logstash Overview
Logstash is typically configured as given below.

- Inputs: Logstash supports a variety of inputs that pull in events from a multitude of common sources, all at the same time. Easily ingest from your logs, metrics, web applications, data stores, and various AWS services, all in continuous, streaming fashion.
- Filters: These are Logstash Plugins that can read events, parse them, structure data, and then transform them into an easy to analyze format. Common filters are:
- grok: Derive structure from unstructured data.
- geoip: Decipher geo-coordinates from IP addresses.
- fingerprint: Anonymize PII data, exclude sensitive fields.
- date: Identifies timestamp of the log.
- Outputs: Logstash supports many kinds of outputs. Elasticsearch is the default but if needed, logs can be sent to email, files on disk, HTTP endpoint, MongoDB, Redis, Kafka, etc. as needed.
Below is a sample Filebeat configuration:
filebeat.prospectors:
- type: log
  # Change to true to enable this prospector onfiguration.
 enabled: true
  # Paths that should be crawled and fetched. Glob based paths.
  paths:
    - d:\ElasticStack\Logs\logfile.log
#----------------------------- Logstash output --------------------------------
output.logstash:
  # The Logstash hosts
  hosts: ["localhost:5044"]
Below is the Logstash configuration:
input {
    beats {
        port => "5044"
    }
}
 filter {
    grok {
        match => { "message" => "%{COMBINEDAPACHELOG}"}
    }
    geoip {
        source => "clientip"
    }
}
output {
    elasticsearch {
        hosts => [ "localhost:9200" ]
    }
}
Elasticsearch Overview
Elasticsearch is a distributed, RESTful search and analytics engine. It allows us to store, search, and analyze big volumes of data quickly and in near real time.
A quick review of some of the basic concepts:
- Cluster: A cluster is a collection of one or more nodes (servers) that together holds your entire data and provides indexing and search capabilities across all nodes.
- Node: A node is a single server that stores your data and participates in the cluster’s indexing and searching capabilities.
- Document: A document is a basic unit of information that can be indexed. For example, you can have a document for a single customer and another document for a single product.
- Index: An index is a collection of documents that have somewhat similar characteristics.For example, you can have an index for customer data, another index for a product catalog.
- Type: A type used to be a logical category/partition of your index to allow you to store different types of documents in the same index, i.e. one type for users and another for blog posts.
- Shards: Elasticsearch provides the ability to subdivide your index into multiple pieces called shards. Each shard is in itself a fully-functional and independent "index" that can be hosted on any node in the cluster. It allows you to distribute and parallelize operations across shards (potentially on multiple nodes), thus increasing performance/throughput.
- Replica: Elasticsearch allows you to make one or more copies of your index’s shards into replicas. It provides high availability in case a shard/node fails. It allows you to scale out your search volume/throughput since searches can be executed on all replicas in parallel.
To summarize, each index can be split into multiple shards. An index can also be replicated zero (meaning no replicas) or more times. Once replicated, each index will have primary shards (the original shards that were replicated from) and replica shards (the copies of the primary shards).
Below is the Elasticsearch configuration:
cluster.name: elasticsearch                   # Cluster name
node.name: "Node 1“                           # Node name
node.master: false                            # Allow this node to be eligible as a master node
node.data: true                               # Allow this node to store data
index.number_of_shards: 5                     # Set  the number of shards (splits) of an index
index.number_of_replicas: 1                   # Set the number of replicas (additional copies) of an index
path.conf: /elasticsearch-1.4.4/config/conf   # Path to directory containing configuration
path.data: /elasticsearch-1.4.4/data          # Path to directory where to store index data allocated for this node.
path.work: /elasticsearch-1.4.4/work          # Path to temporary files
network.bind_host: 192.168.0.1                # Binds itself to this address, and listens on port [9200-9300] for HTTP traffic and on port [9300-9400] for node-to-node communication.
http.port: 9200                               # Set a custom port to listen for HTTP traffic
Kibana Overview
Kibana provides data visualization capability. It has a browser-based UI. It is the analytics and visualization components of the Elastic Stack. Kibana provides various kinds of charts like histograms, line graphs, and pie charts. It integrates easily with Elasticsearch. It has easy-to-share reports as PDFs, CSVs, embed links, etc.
Below is Kibana configuration:
# Kibana is served by a back end server. This setting specifies the port to use.
server.port: 5601
server.host: "localhost"
# The URL of the Elasticsearch instance to use for all your queries.
elasticsearch.url: http://localhost:9200
elasticsearch.username: "user“
elasticsearch.password: "pass"
To generate Kibana reports, first, ensure that data is loaded in Elasticsearch and then define an index pattern and write a query to discover data within the indexes meeting the pattern criteria. To visualize data, choose from a variety of diagrams available and finally glue your preferred diagrams on a customizable dashboard.
Opinions expressed by DZone contributors are their own.

Comments