DZone
Thanks for visiting DZone today,
Edit Profile
  • Manage Email Subscriptions
  • How to Post to DZone
  • Article Submission Guidelines
Sign Out View Profile
  • Post an Article
  • Manage My Drafts
Over 2 million developers have joined DZone.
Log In / Join
Please enter at least three characters to search
Refcards Trend Reports
Events Video Library
Refcards
Trend Reports

Events

View Events Video Library

Zones

Culture and Methodologies Agile Career Development Methodologies Team Management
Data Engineering AI/ML Big Data Data Databases IoT
Software Design and Architecture Cloud Architecture Containers Integration Microservices Performance Security
Coding Frameworks Java JavaScript Languages Tools
Testing, Deployment, and Maintenance Deployment DevOps and CI/CD Maintenance Monitoring and Observability Testing, Tools, and Frameworks
Culture and Methodologies
Agile Career Development Methodologies Team Management
Data Engineering
AI/ML Big Data Data Databases IoT
Software Design and Architecture
Cloud Architecture Containers Integration Microservices Performance Security
Coding
Frameworks Java JavaScript Languages Tools
Testing, Deployment, and Maintenance
Deployment DevOps and CI/CD Maintenance Monitoring and Observability Testing, Tools, and Frameworks

The software you build is only as secure as the code that powers it. Learn how malicious code creeps into your software supply chain.

Apache Cassandra combines the benefits of major NoSQL databases to support data management needs not covered by traditional RDBMS vendors.

Generative AI has transformed nearly every industry. How can you leverage GenAI to improve your productivity and efficiency?

Modernize your data layer. Learn how to design cloud-native database architectures to meet the evolving demands of AI and GenAI workloads.

Related

  • Process Mining Key Elements
  • The Transformer Algorithm: A Love Story of Data and Attention
  • Predicting Traffic Volume With Artificial Intelligence and Machine Learning
  • Outlier Identification in Continuous Data Streams With Z-Score and Modified Z-Score in a Moving Window

Trending

  • Start Coding With Google Cloud Workstations
  • Infrastructure as Code (IaC) Beyond the Basics
  • The Full-Stack Developer's Blind Spot: Why Data Cleansing Shouldn't Be an Afterthought
  • Ethical AI in Agile
  1. DZone
  2. Data Engineering
  3. AI/ML
  4. Simplifying Logistic Regression

Simplifying Logistic Regression

Learn how to use linear regression for use cases like predictive analytics, classification, probability, and more.

By 
Himanshu Rajput user avatar
Himanshu Rajput
·
Apr. 17, 18 · Tutorial
Likes (6)
Comment
Save
Tweet
Share
8.7K Views

Join the DZone community and get the full member experience.

Join For Free

Logistic regression is one of the most popular machine learning algorithms for binary classification. This is because it is a simple algorithm that performs very well on a wide range of problems. It is used when you know that the data is linearly separable/classifiable and the outcome is binary or dichotomous but it can be extended when the dependent has more than two categories. Logistic regression is used when the outcome is a discrete variable, such as trying to figure out who will win the election, whether a student will pass an exam or not, or whether an email is a spam. This is commonly called as a classification problem because we are trying to determine which class the dataset best fits.

Linear Regression vs. Logistic Regression

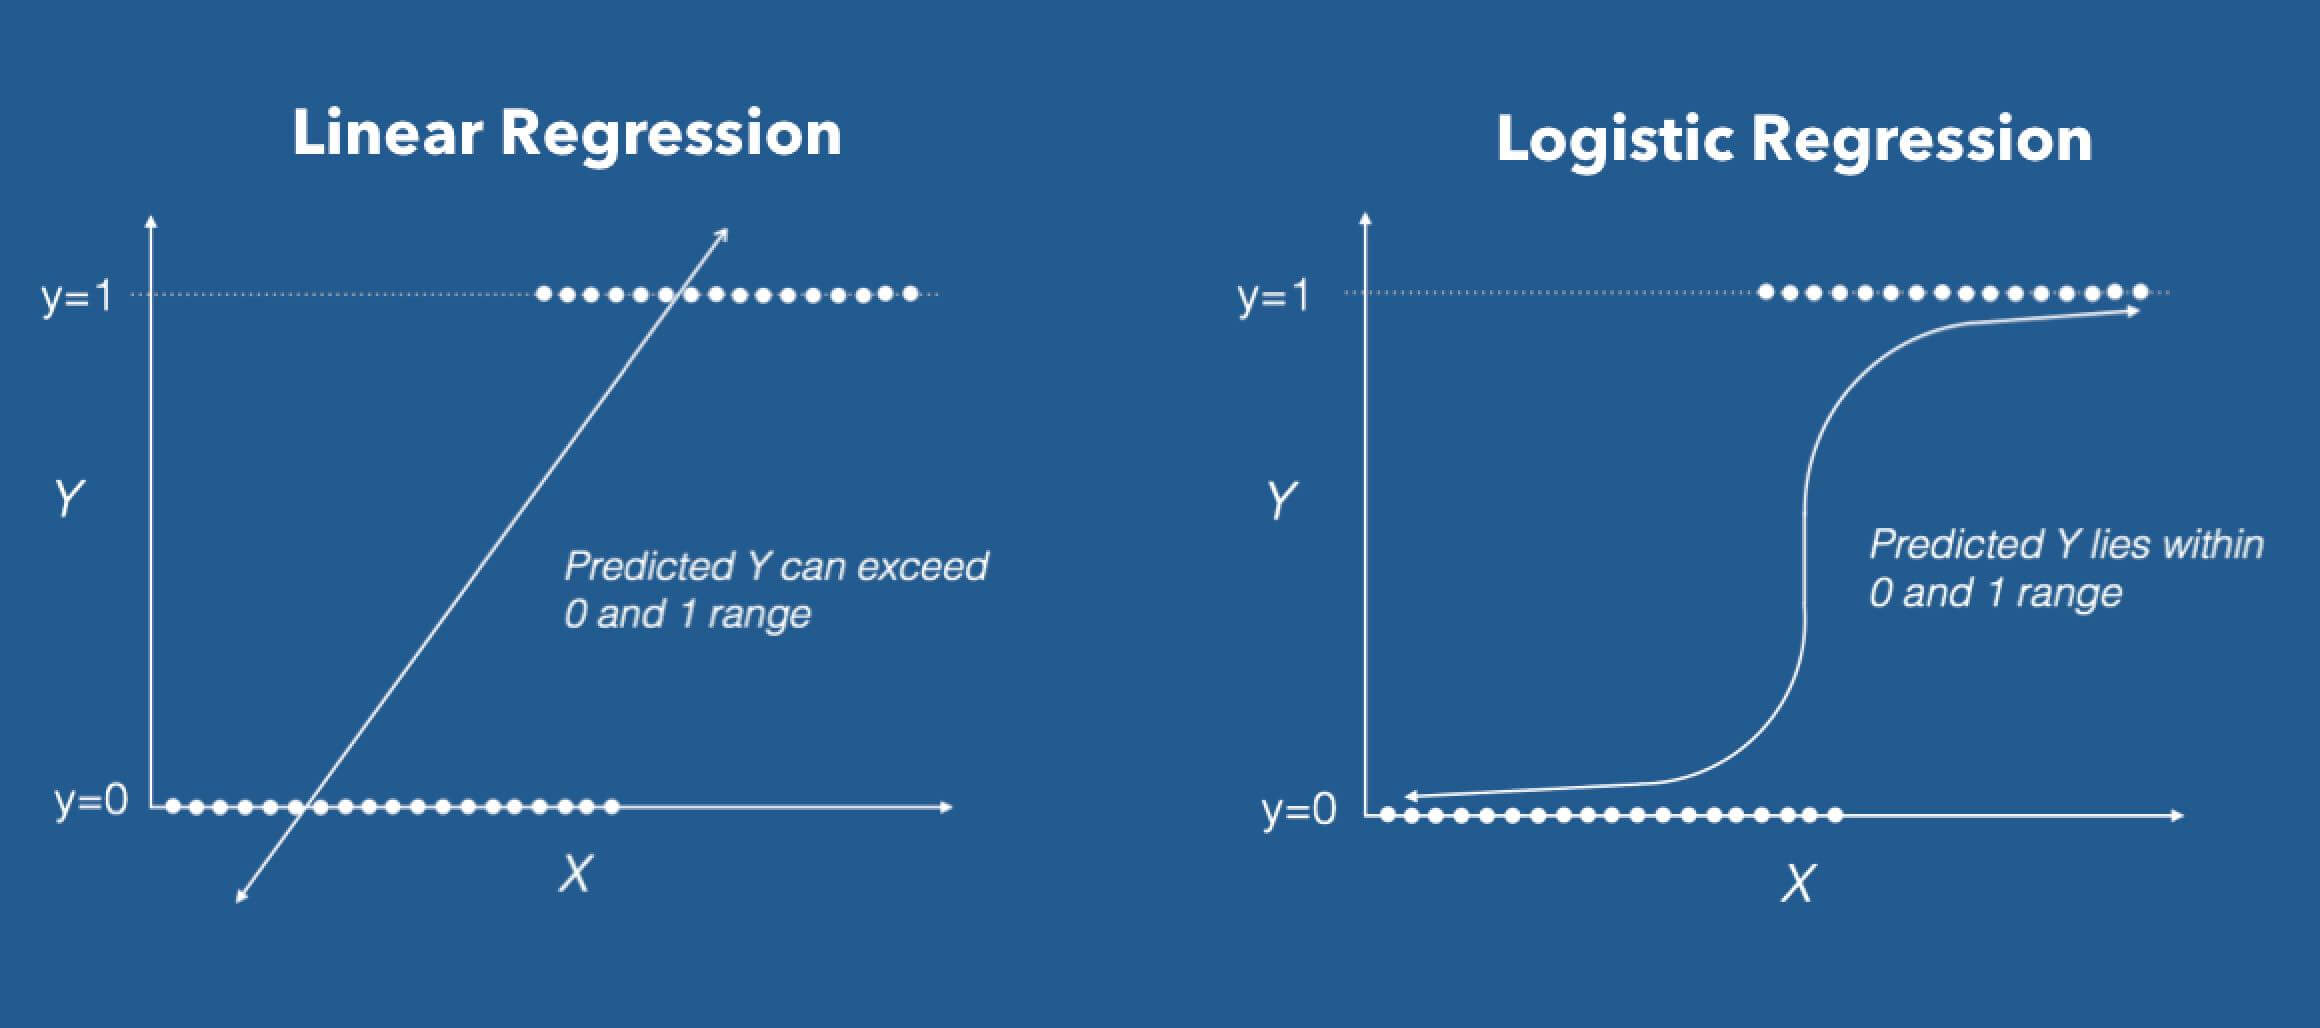
In linear regression, the outcome is continuous. It can have any one of an infinite number of possible values while In logistic regression, the outcome has only a limited number of possible values, generally 0 or 1.

Linear regression needs to establish the linear relationship between dependent and independent variable whereas it is not necessary for logistic regression.

In linear regression, the independent variables can be correlated with each other. On the contrary, in logistic regression, the variable must not be correlated with each other.

Terminology Used for Logistic Regression

  • Probability: Probability is the measure of the likelihood that an event will occur.Probability is quantified as a number between 0 and 1.
  • Odds: Odds is the ratio of the probability of occurring of an event and probability of not occurring such as odds = P(Occurring)/P(Not occurring) where P = Probability.
  • Odds ratio: Odds ratio for a variable in logistic regression that represents how the odds change with 1 unit increase in that variable holding all the other variables as constant. It can be defined as the ratio of two odds.
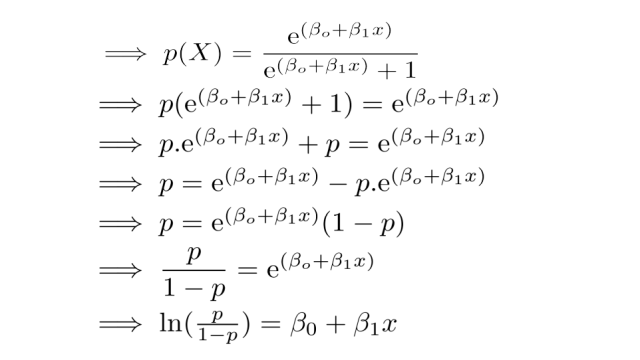
  • Logit: In logistic regression, we need a function that can link independent variables or map the linear combination of variables that could result in any value from 0 to 1. That function is called logit: ln(odds) = ln(p/1-p) = logit(p).

In logistic regression, we estimate an unknown probability for any given linear combination of independent variables.

Regression coefficients for logistic regression are calculated using maximum likelihood estimation (MLE).

So, in the above equation, x is the independent variable and the rest of them are regression coefficients. This equation is called estimated regression.

Applications of Logistic Regression

Logistic regression can be applied anywhere that the outcome is binary, such as 0 or 1. Some of the applications of logistic regression are:

  1. Predicting whether a student will pass or not on the basis of hours of study or any relevant information.
  2. Predicting the approval of loan on the basis of credit score.
  3. Predicting the failure of a firm.

This article was first published on the Knoldus blog.

Linear regression Machine learning Maximum likelihood application Pass (software) Event Algorithm Data (computing) Holding (law)

Published at DZone with permission of Himanshu Rajput, DZone MVB. See the original article here.

Opinions expressed by DZone contributors are their own.

Related

  • Process Mining Key Elements
  • The Transformer Algorithm: A Love Story of Data and Attention
  • Predicting Traffic Volume With Artificial Intelligence and Machine Learning
  • Outlier Identification in Continuous Data Streams With Z-Score and Modified Z-Score in a Moving Window

Partner Resources

×

Comments
Oops! Something Went Wrong

The likes didn't load as expected. Please refresh the page and try again.

ABOUT US

  • About DZone
  • Support and feedback
  • Community research
  • Sitemap

ADVERTISE

  • Advertise with DZone

CONTRIBUTE ON DZONE

  • Article Submission Guidelines
  • Become a Contributor
  • Core Program
  • Visit the Writers' Zone

LEGAL

  • Terms of Service
  • Privacy Policy

CONTACT US

  • 3343 Perimeter Hill Drive
  • Suite 100
  • Nashville, TN 37211
  • support@dzone.com

Let's be friends:

Likes
There are no likes...yet! 👀
Be the first to like this post!
It looks like you're not logged in.
Sign in to see who liked this post!