Managed MQTT Broker Comparison — Console/Dashboard Features
I will compare the differences between several managed MQTT Brokers in aspects of console/dashboard features.
Join the DZone community and get the full member experience.
Join For FreeThis is the second article in the "Managed MQTT Broker Comparison" series. Here is the link to the first article.
Brokers I Choose to Compare
I choose the products from independent MQTT Broker vendors who focus on this area instead of other IoT fields. Compared to the comprehensive IoT platform like AWS IoT Core or Azure IoT Hub, the independent products are more flexible and avoid binding with particular cloud services. Managed MQTT Brokers are usually the cloud implement of self-hosted MQTT Broker.
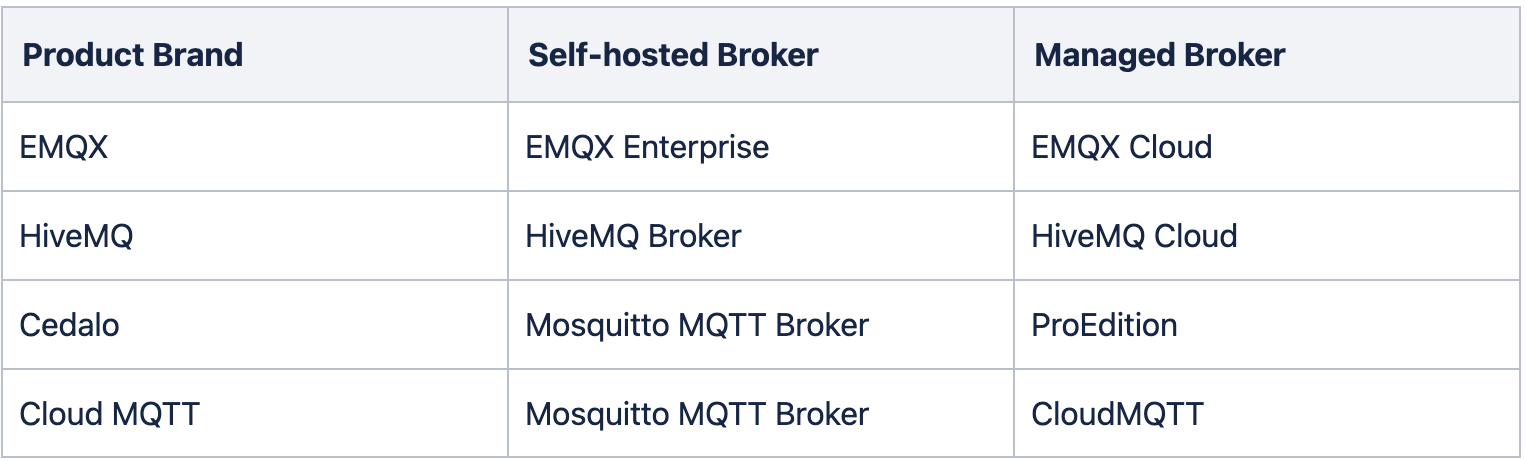
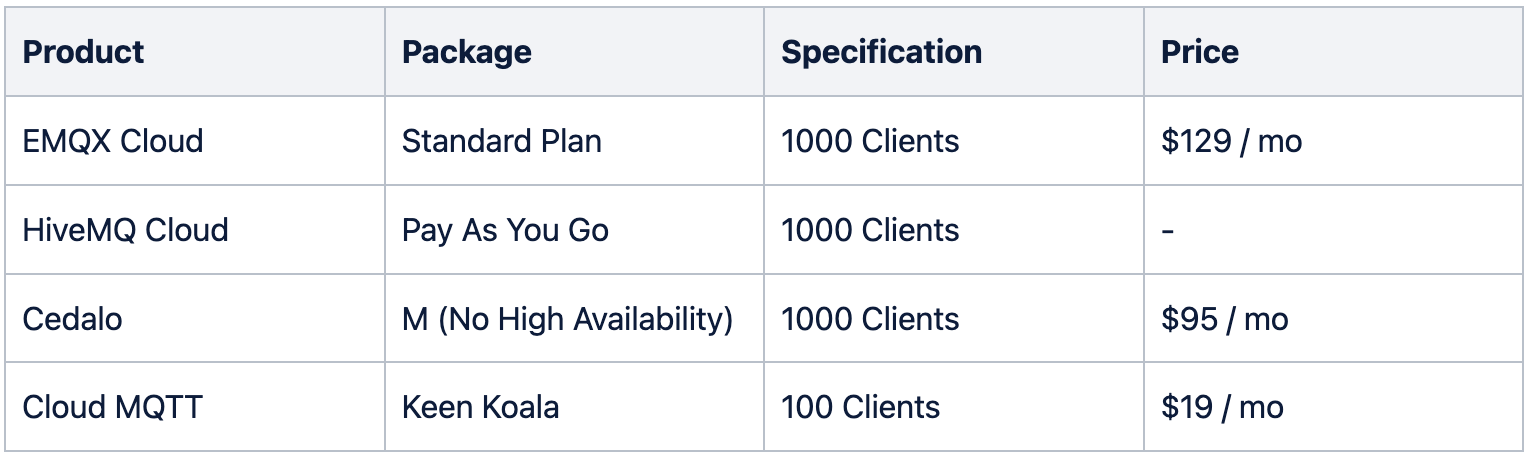
In this article, I’ll compare the console and dashboard features. For the product package, I choose the relatively low tier of each product which are affordable for personal or small business. By the time I wrote this article, the standard version of HiveMQ Cloud was not available anymore, so I chose the GSYG Mode instead.
Cloud Service and Regions
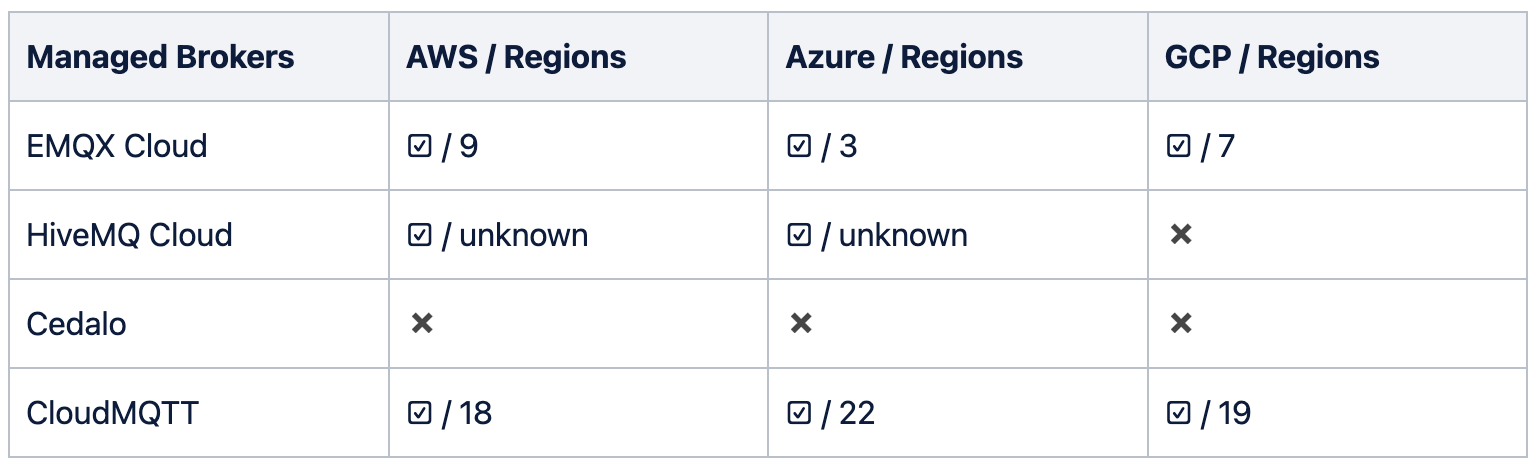
CloudMQTT is absolutely the winner, supporting up to 59 regions. In EMQX Cloud, 17 regions are available. The cloud provider of Cedalo is Hetzner, and servers are located in Virginia, U.S; Finland; and two locations in Germany. AWS or Azure can be chosen for cluster creation, but the region is assigned automatically.
Connectivity
The most important function of the console is to indicate the address and port for MQTT brokers and guide the user to quickly complete the connection.
EMQX Cloud
EMQX Cloud offers two MQTT ports: 15445(MQTT) and 15505(MQTT). The port is dynamic in Standard Plan. You can test the connection easily through “Online Test“ by setting up a WebSocket client.

HiveMQ Cloud
HiveMQ Cloud offers standard TLS ports, 8883(MQTT) and 8884(Websocket).
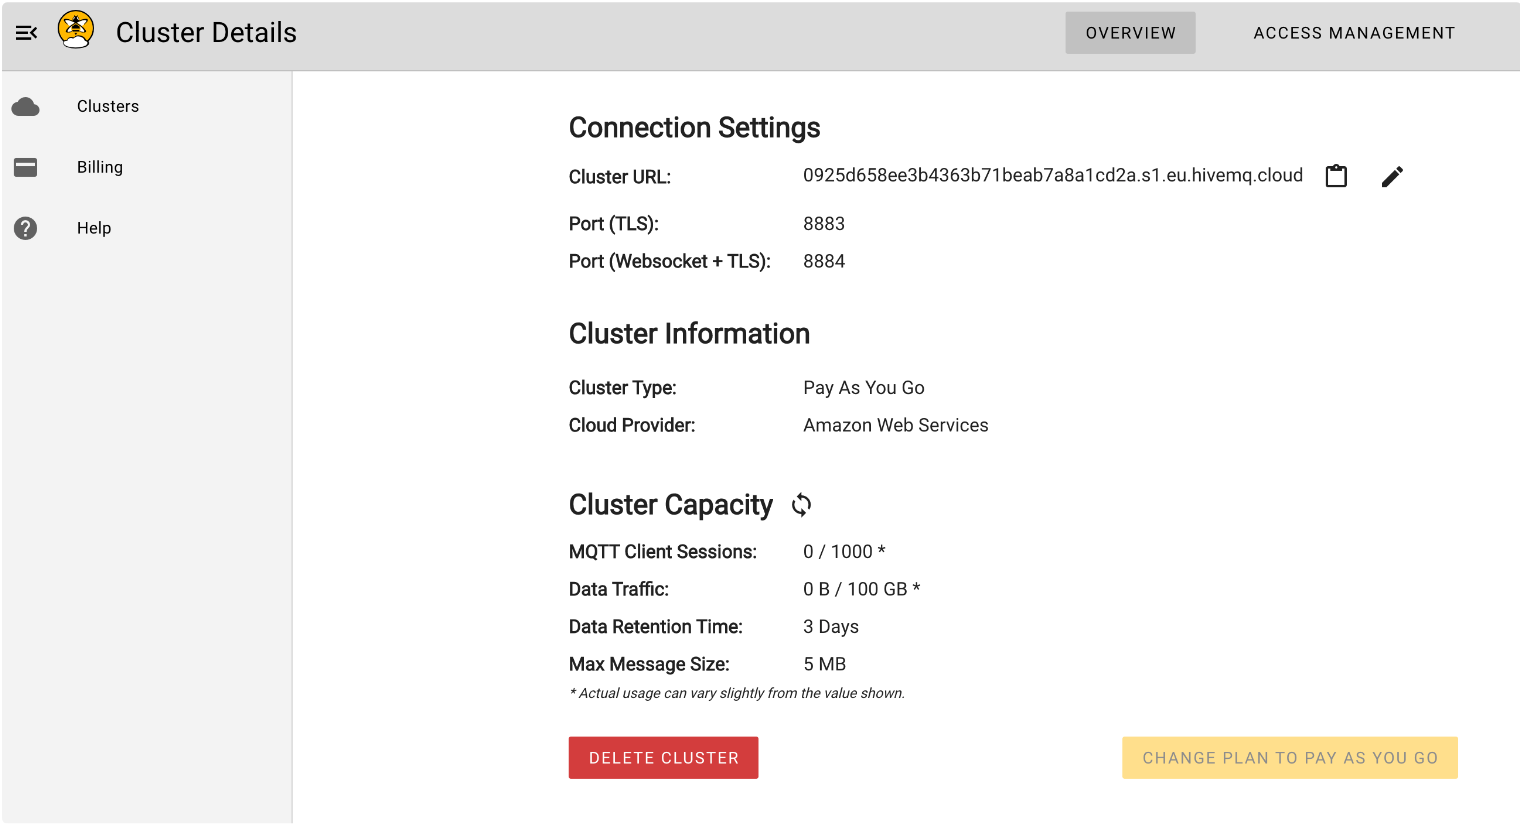
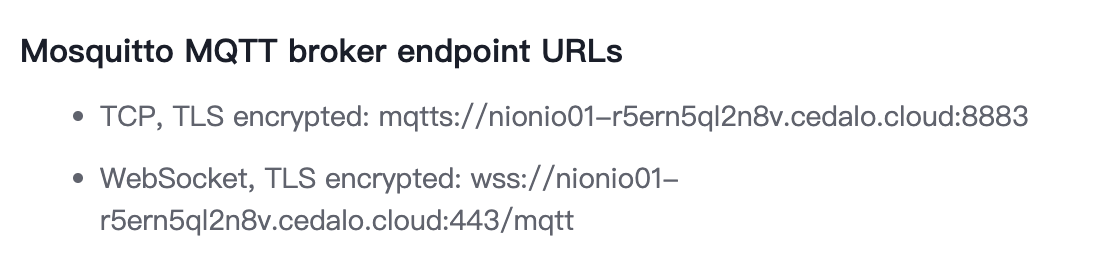
Cedalo — Pro Edition
Same as HiveMQ, Cedalo Pro Edition provides TLS over MQTT and WebSocket.
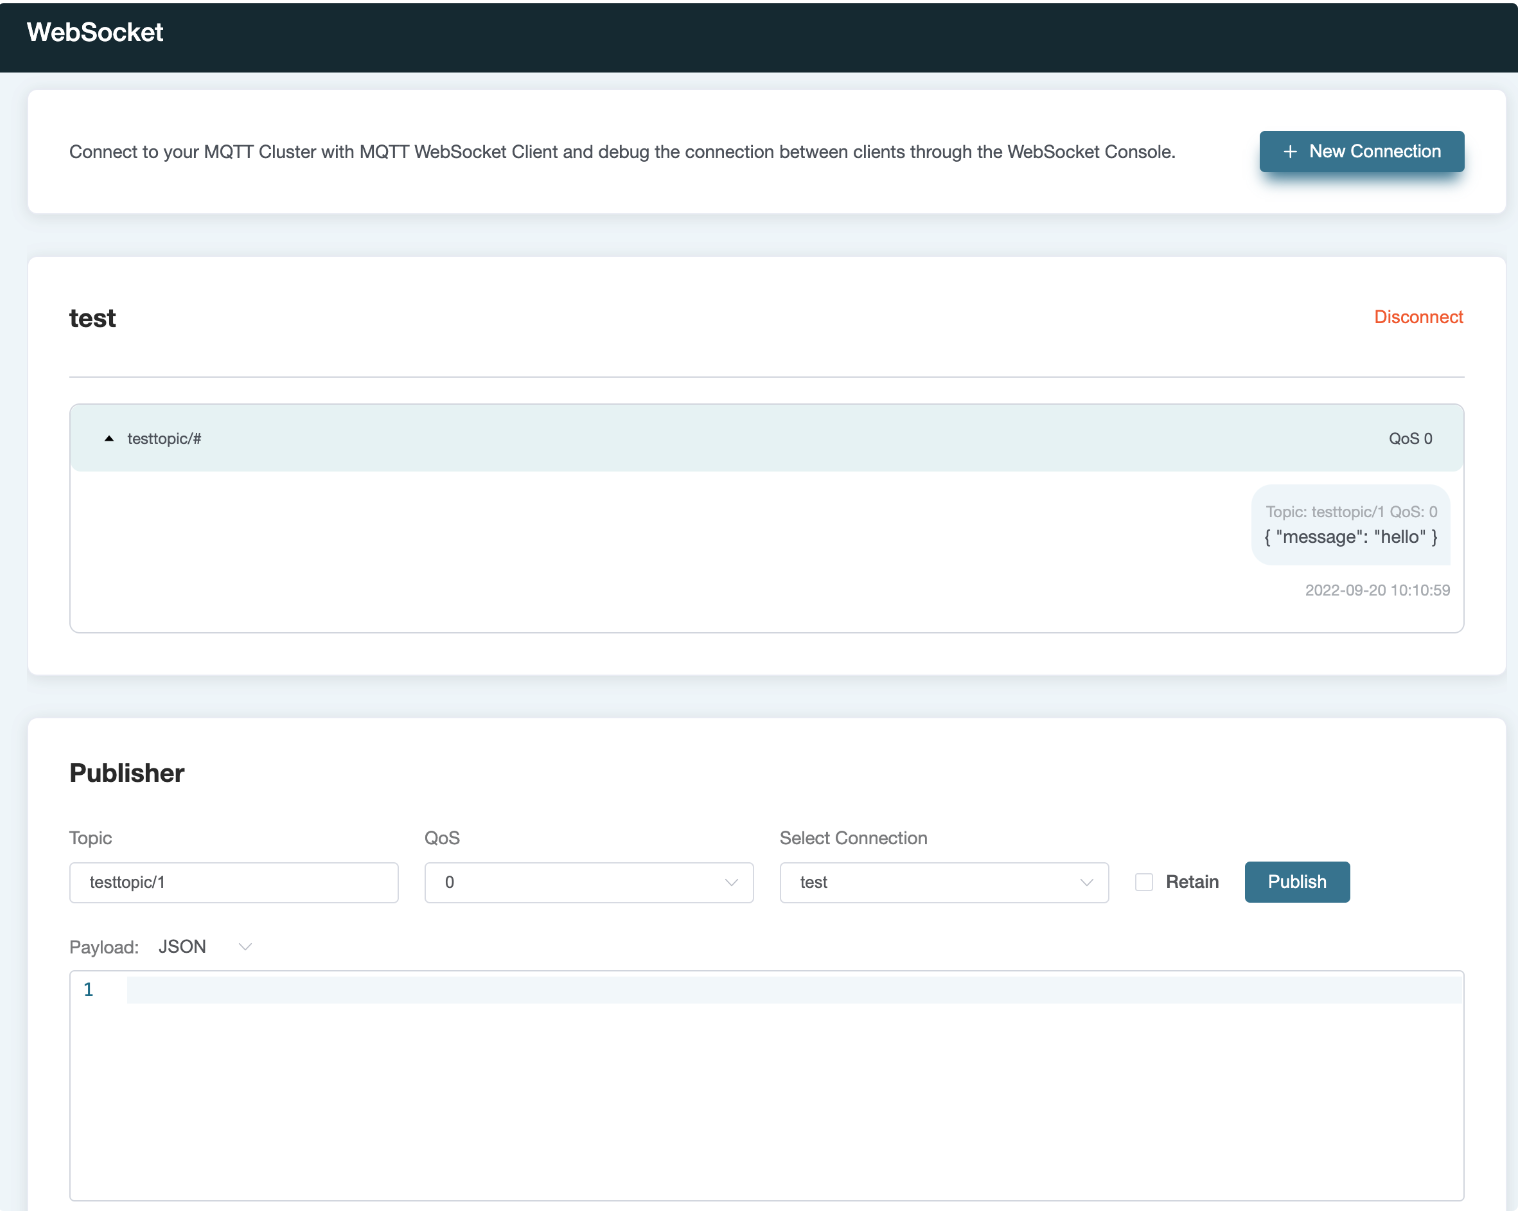
CloudMQTT
CloudMQTT supports both the 1883 port and the 8883 port. Like EMQX Cloud, it’s easy to test the connection by sending a message from WebSocket UI in the console.
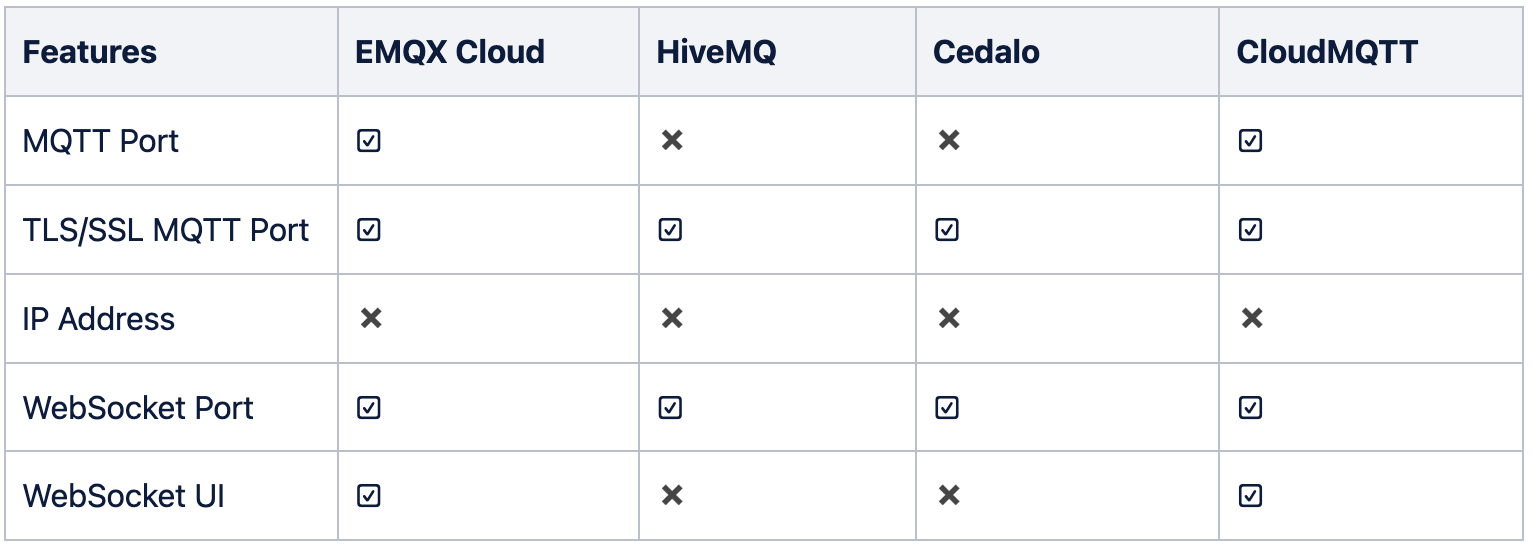
Comparison of Connectivity
Authentication and Access Control
Authentication is typically used to define usernames and passwords for clients' verification, while access control can define client Pub/Sub under certain conditions.
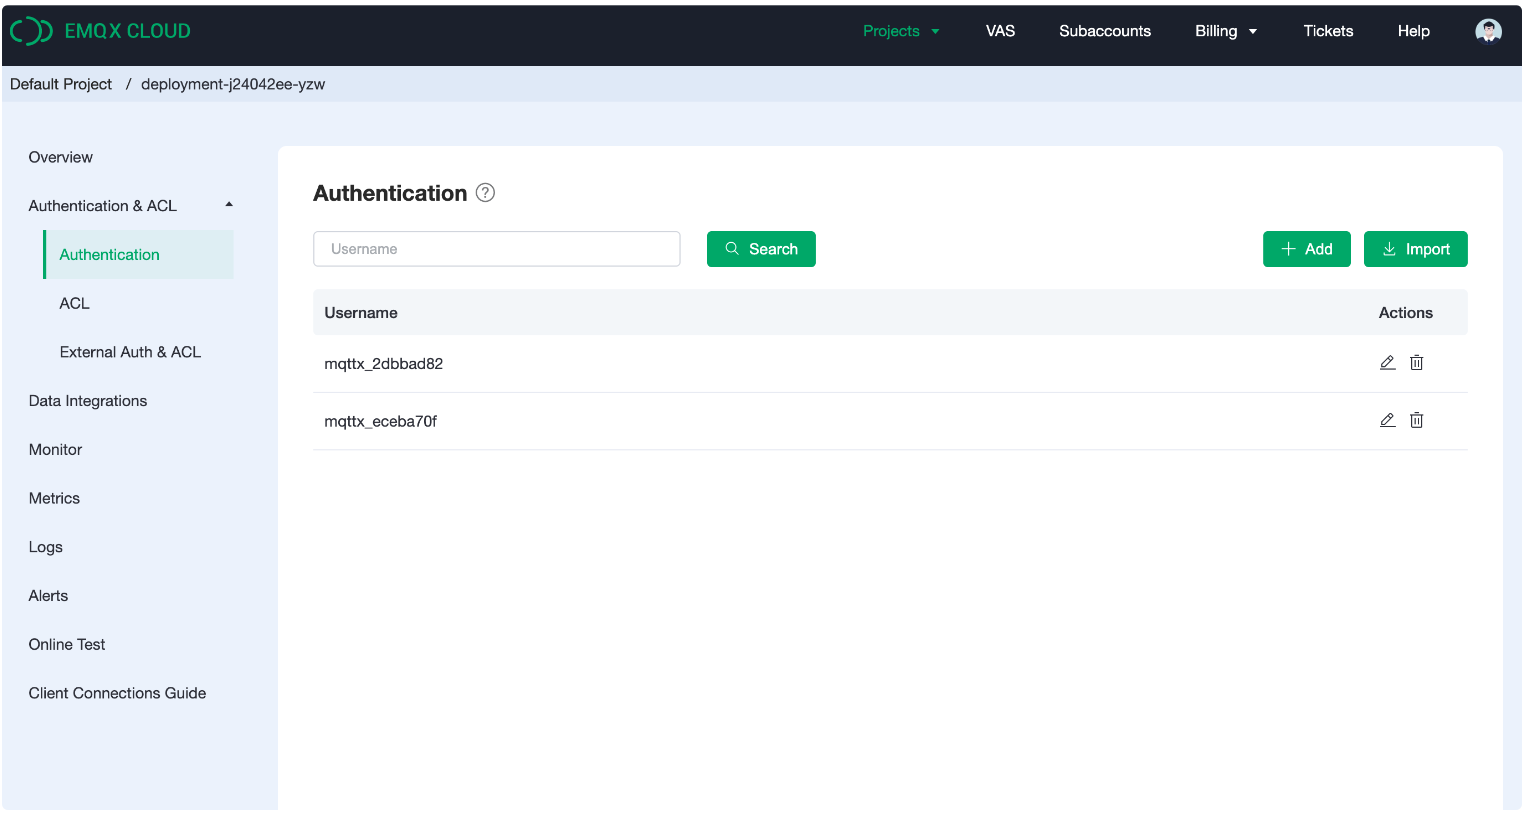
EMQX Cloud
The device credentials rely on username and password authentication in EMQX Cloud. Set username and password in the console or upload a CSV file that contains all the authentication information to the console. The device uses a pair of usernames and password to sign in.
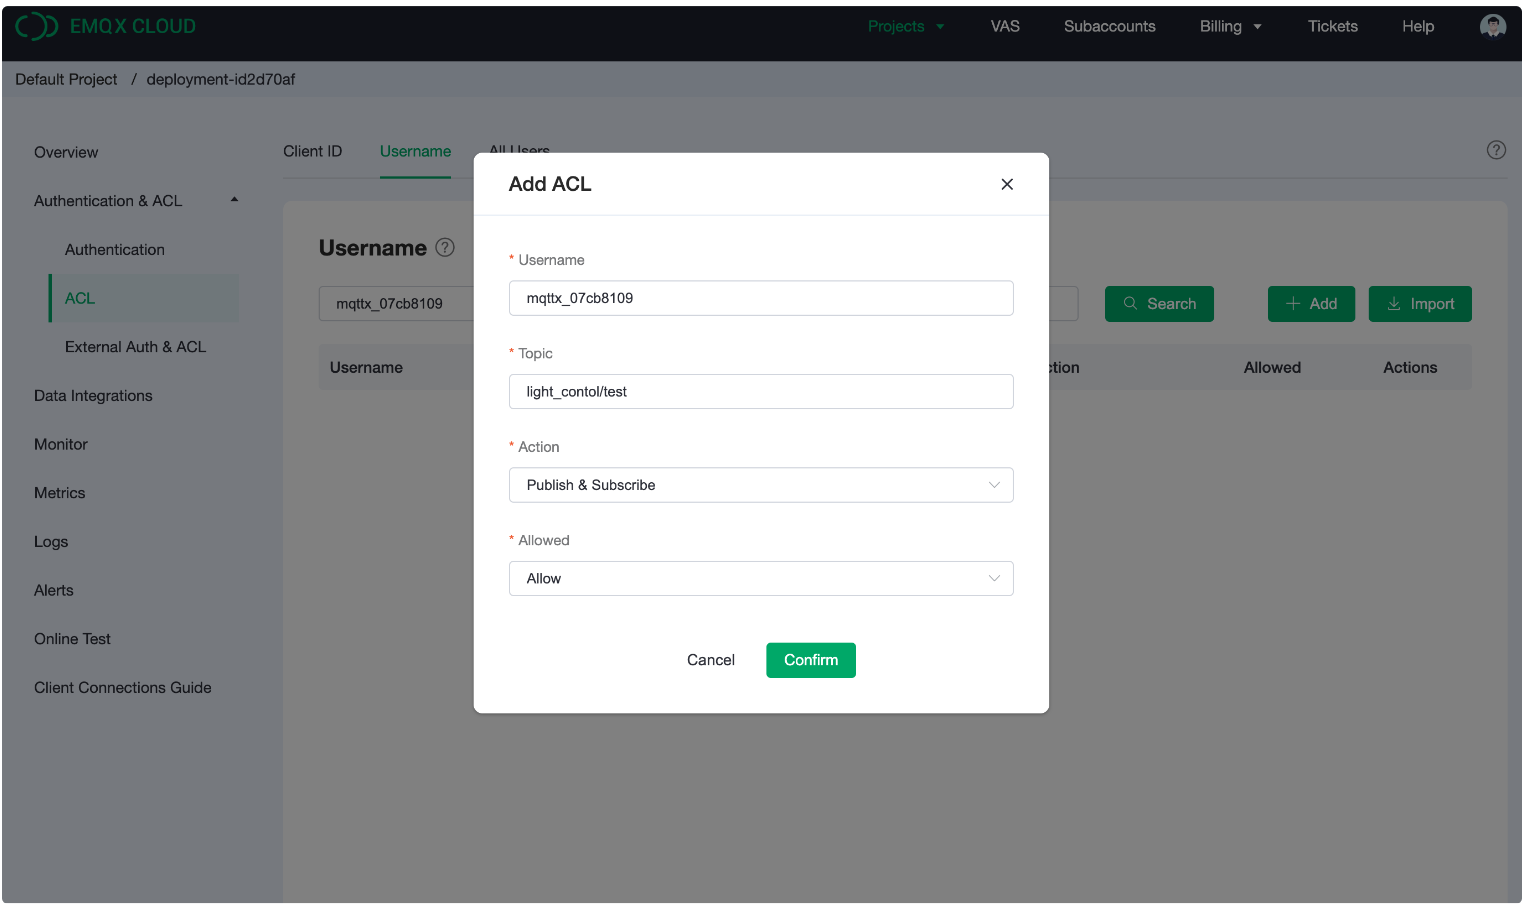
The ACL(Access Control) allows for rules definition over “Client ID, “Username, “ and “All Users. “ For example, I can set a rule that only allows a client (mqttx_07cb8109) to publish and subscribe to the topic “light_control/test. “ The way to set the rules is straight and flexible.
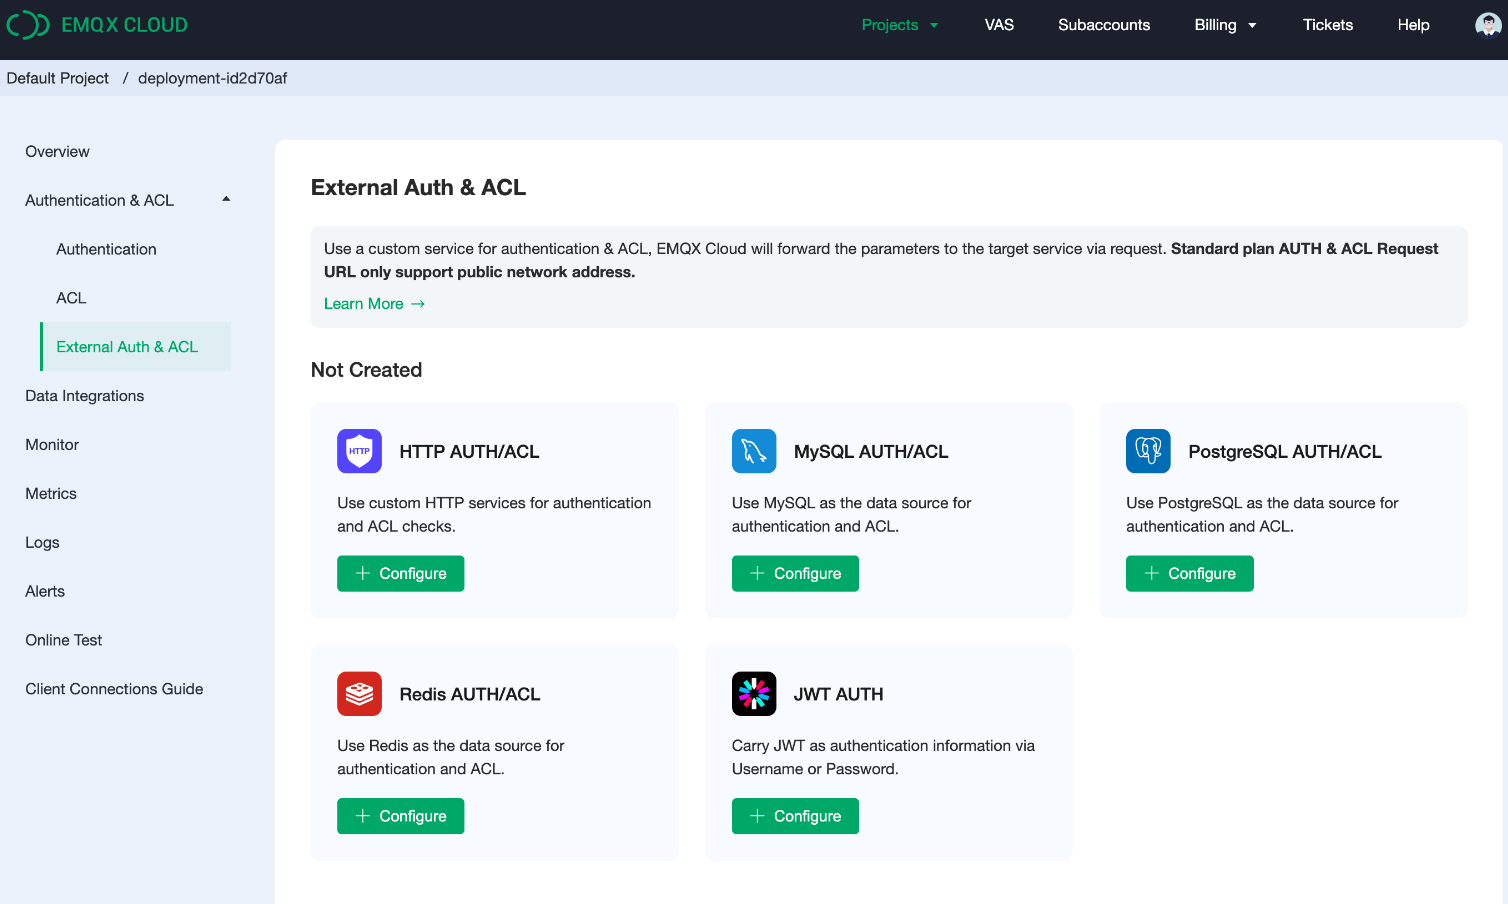
In addition to the normal way of setting up authentication and access control, EMQX Cloud allows you to forward authentication from your database. There are five ways to fetch data: HTTP auth, MySQL, PostgreSQL, Redis, and JWT auth.
HiveMQ Cloud
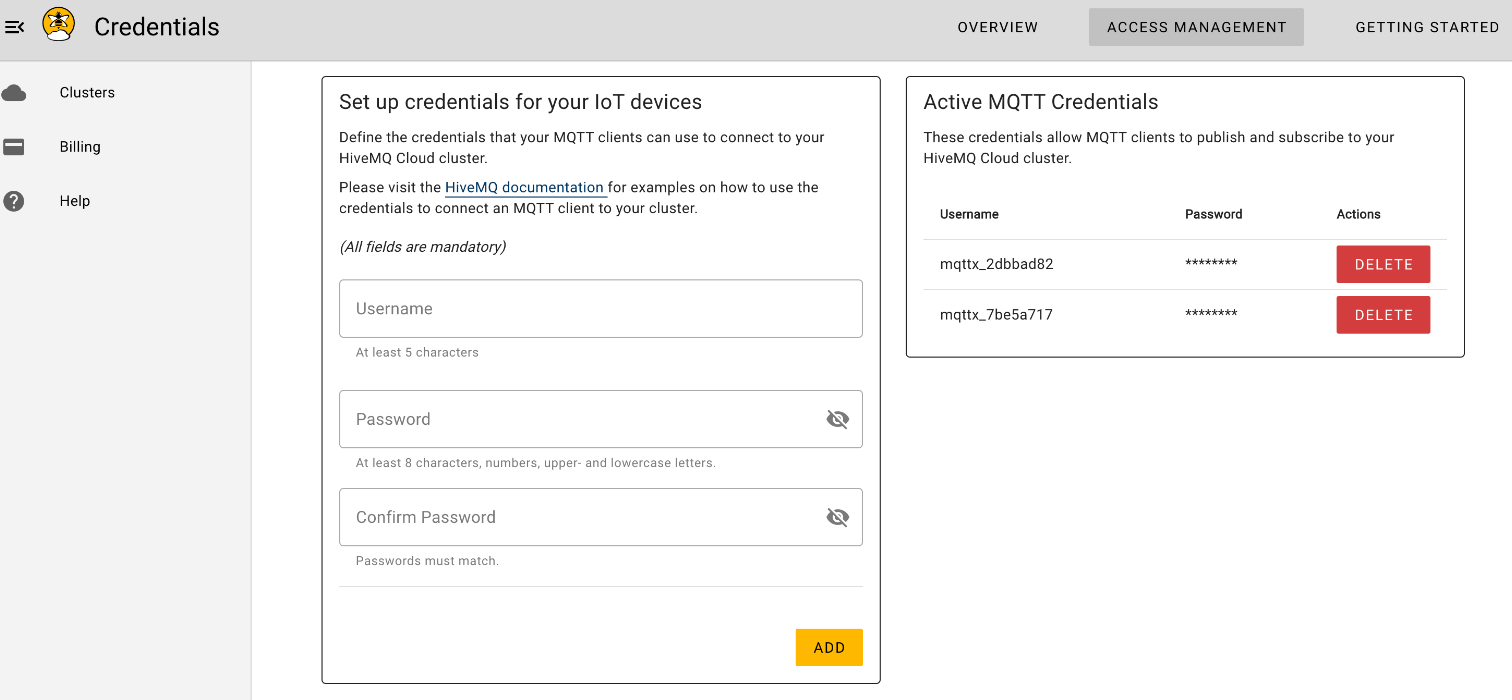
The Access Management section of HiveMQ Cloud is quite simple. To set up the username and password, one needs to add the credentials one by one, which is not convenient for large-scale import. And there is no access control over topics.
Cedalo — Pro Edition
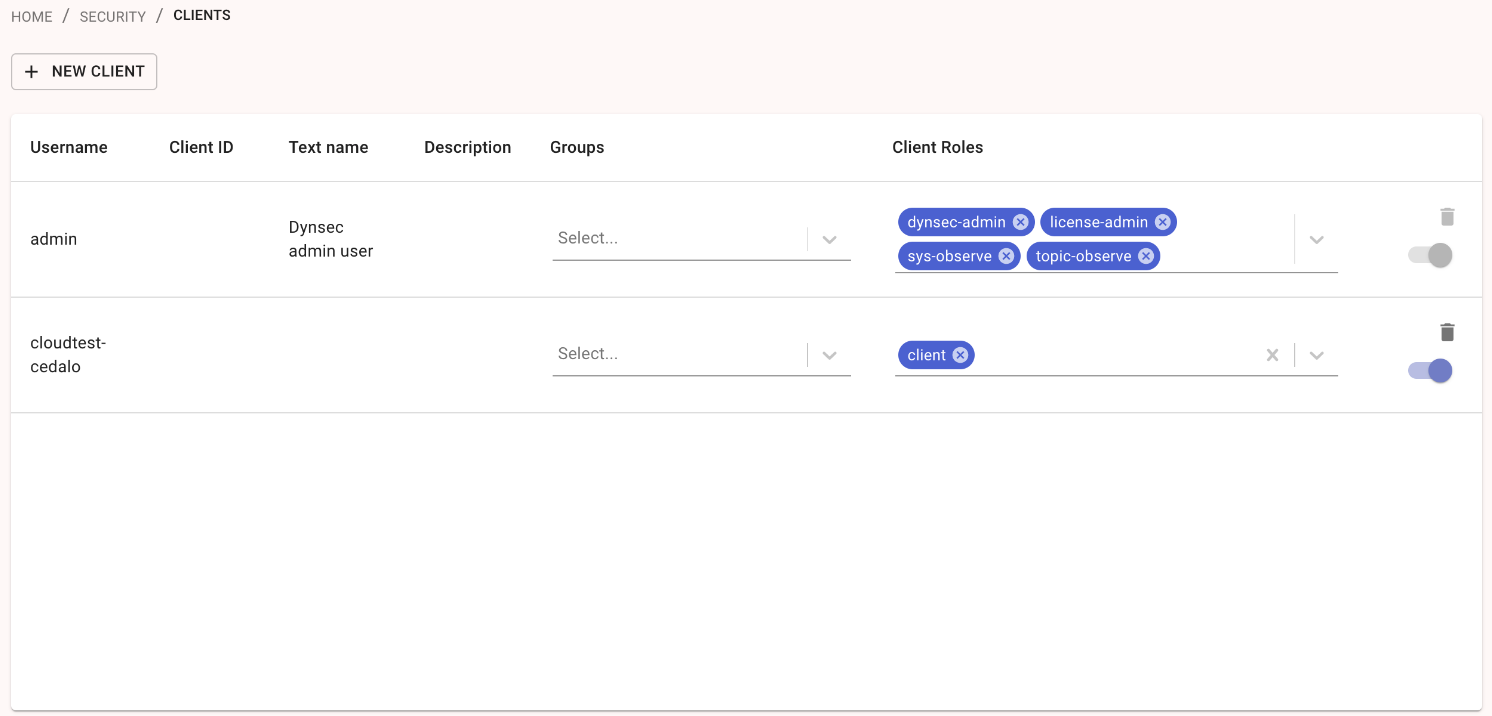
In Cedalo, you need to define a client first and then add a role to this client. In order to control access, rules can be applied to a certain role. It's not so straightforward but can do the job.
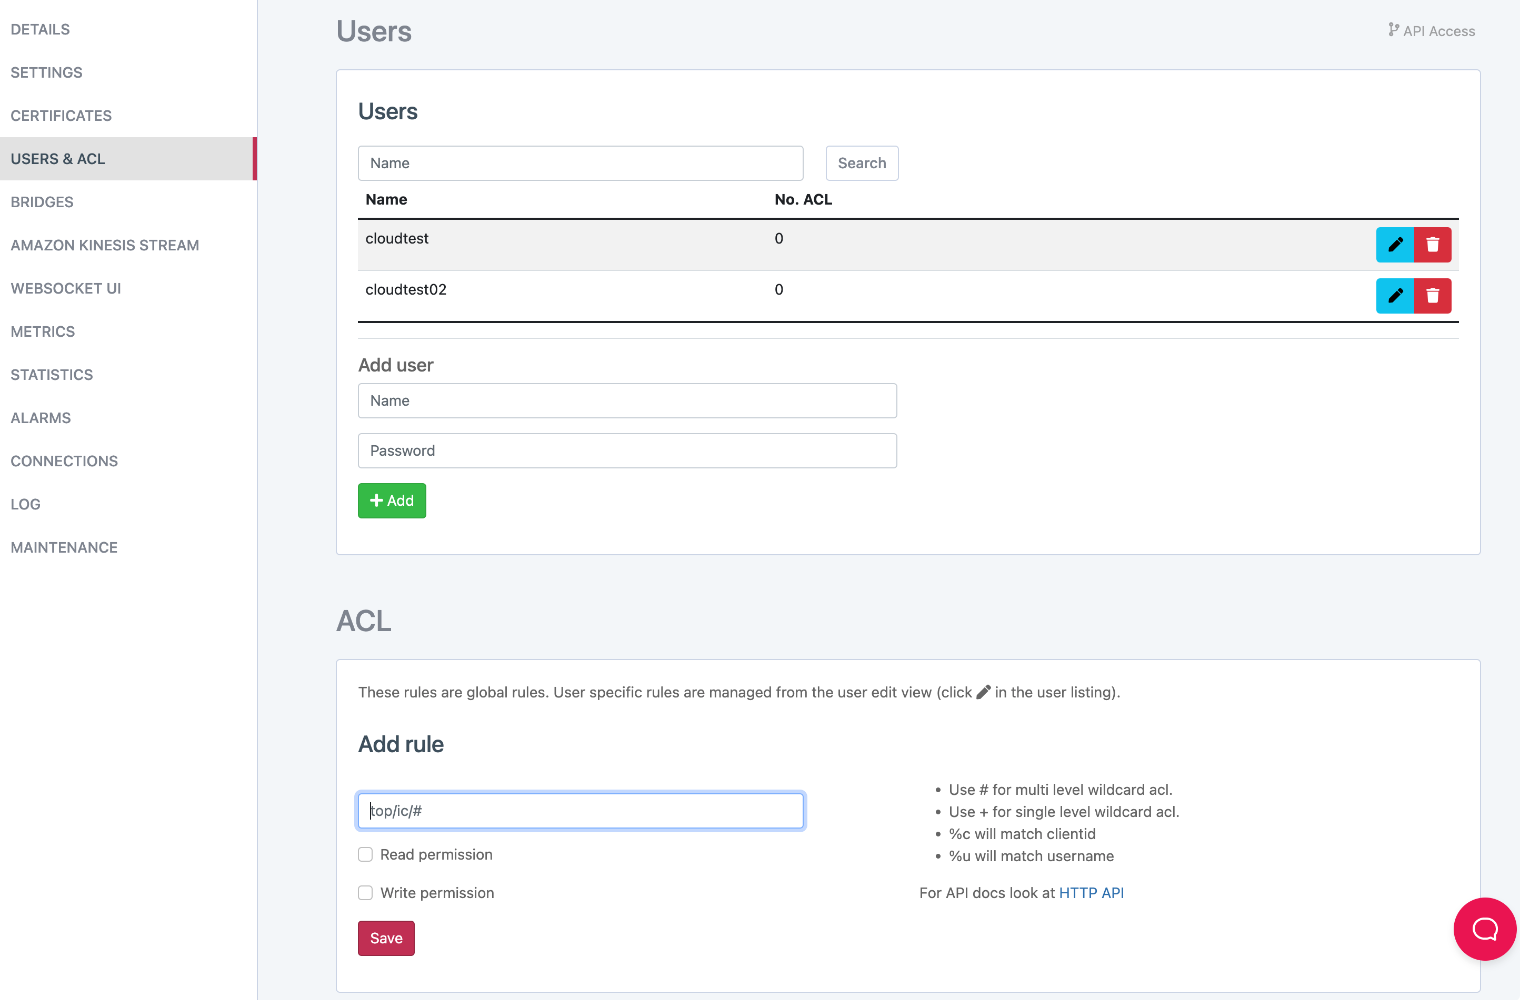
CloudMQTT
In CloudMQTT, batch import is not available. The ACL rules can be set globally or individually to the username. The way to define a rule is to use wildcard characters which is a little bit tricky.
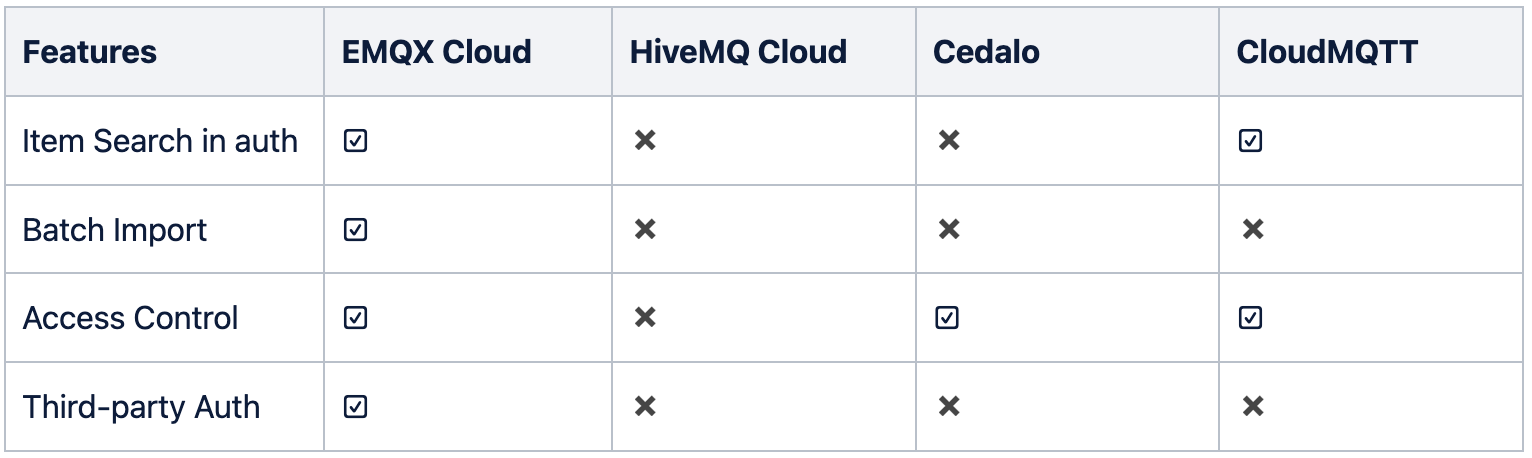
Comparison of Auth
Metrics and Statistics
EMQX Cloud
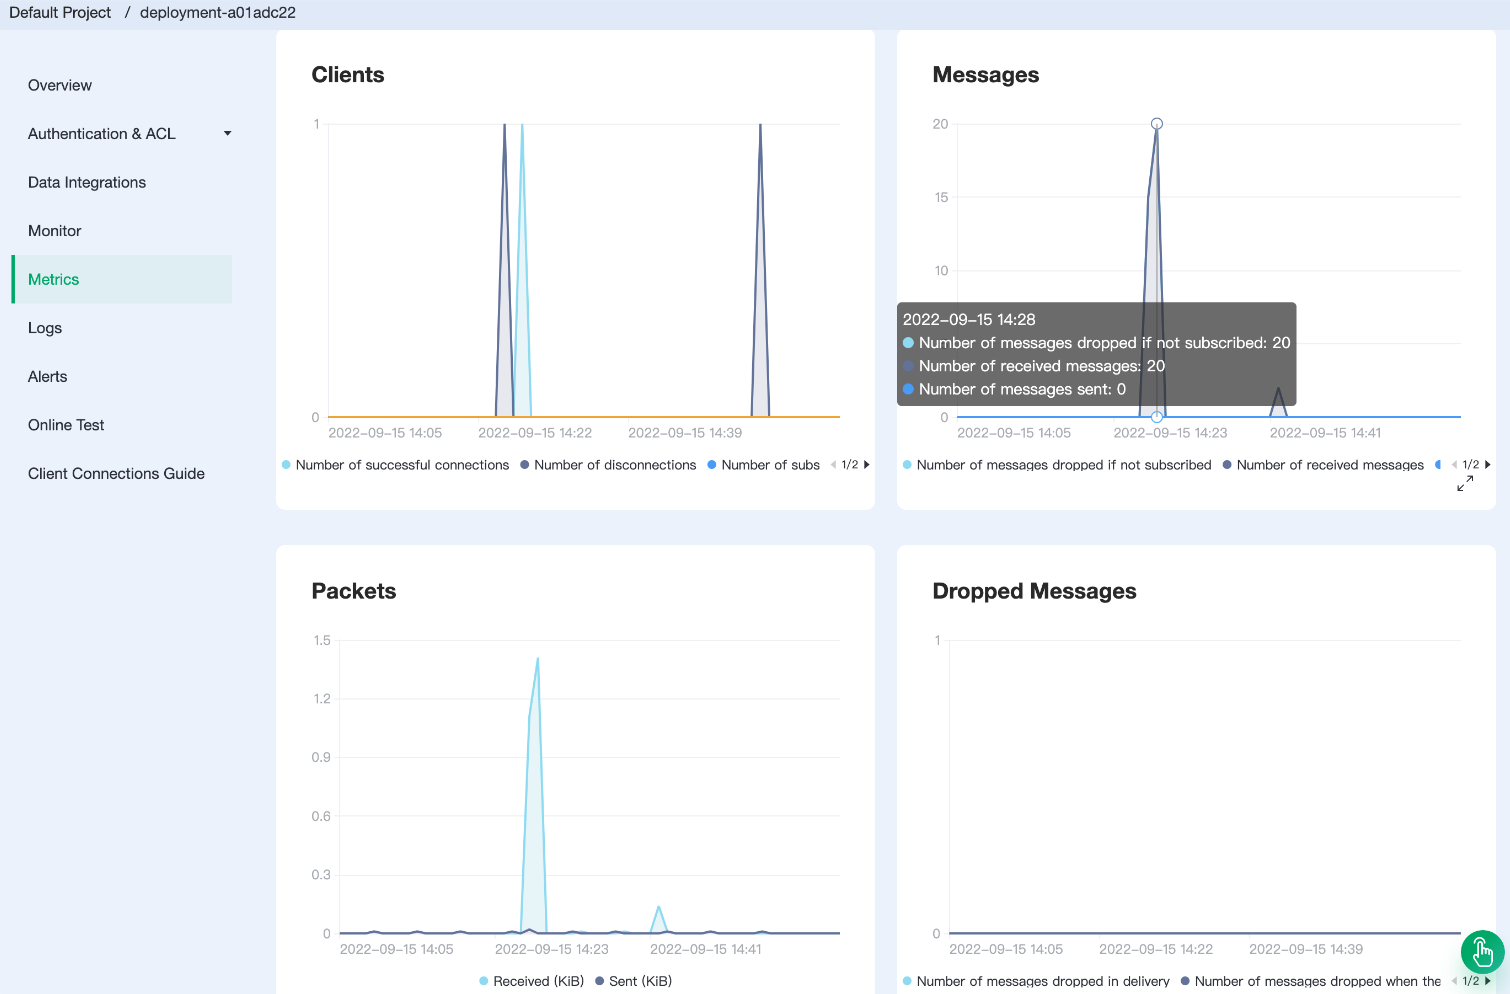
EMQX Cloud provides four incremental metrics: messages, clients, packets, and delivery. You can view the display chart corresponding to each indicator and the detailed information at a certain point in time.
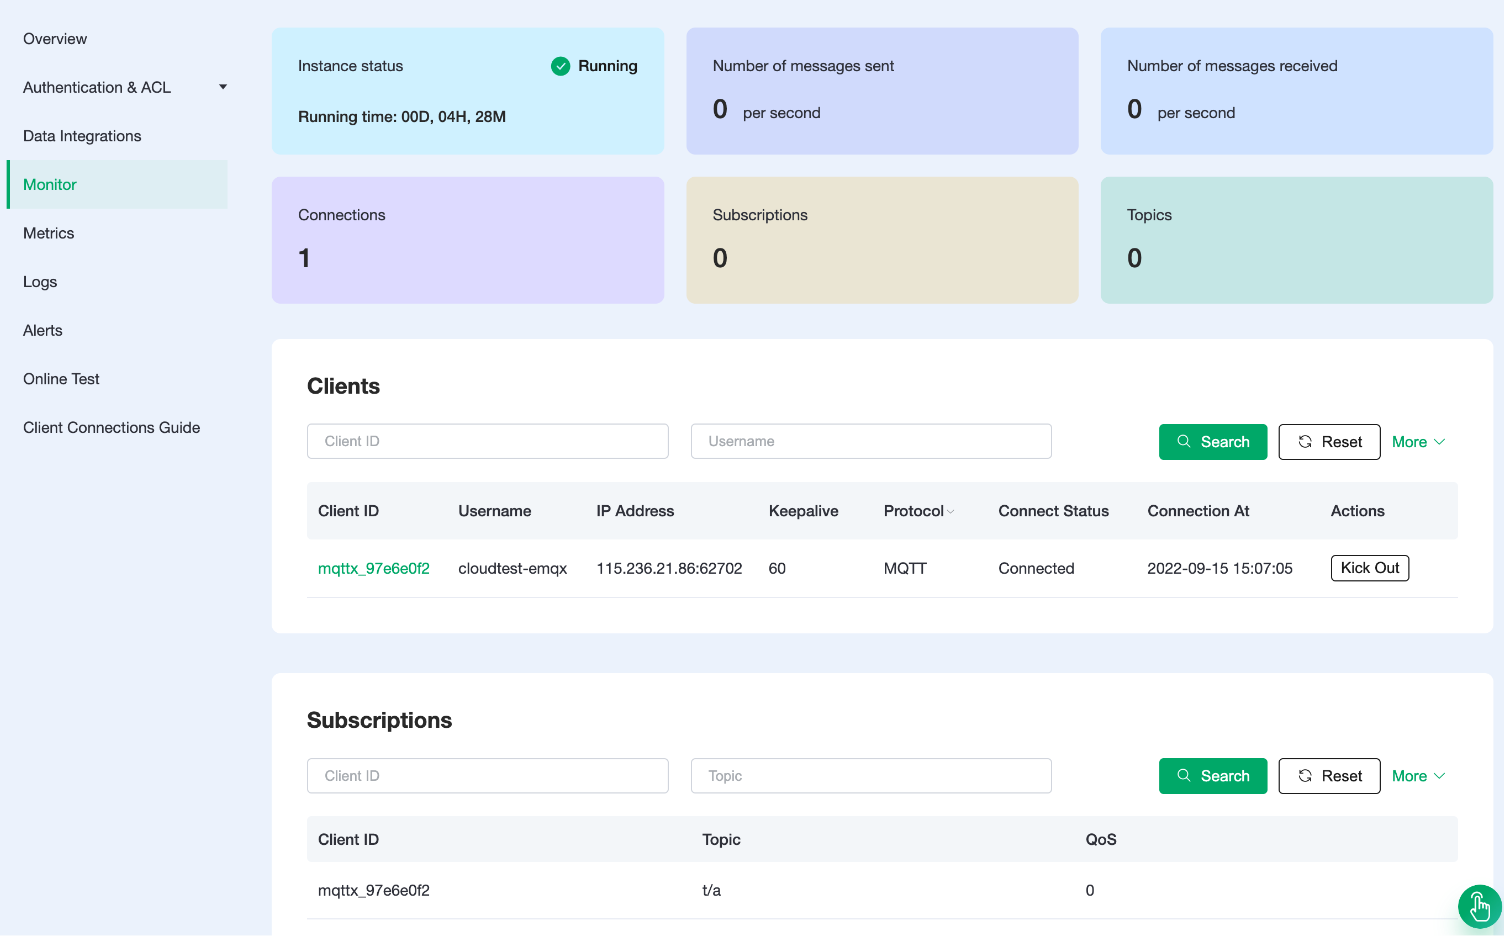
EMQX Cloud provides monitoring metrics to view data such as TPS, number of connections, subscriptions, and topics in real-time. Clients card list all the clients that connect to the broker at the moment. Subscriptions card list all the topics the broker subscribed to.
HiveMQ Cloud
All the Metrics and Statistics are available in HiveMQ Control Center. However, Control Center is not included in Pay As You Mode. If you want to know more about this function, check the documents for more information.
CloudMQTT
In Metrics, the top graph group shows the server metrics on CPU, Memory, Disk, and Network. The bottom graph group shows the clients' connections and messages.
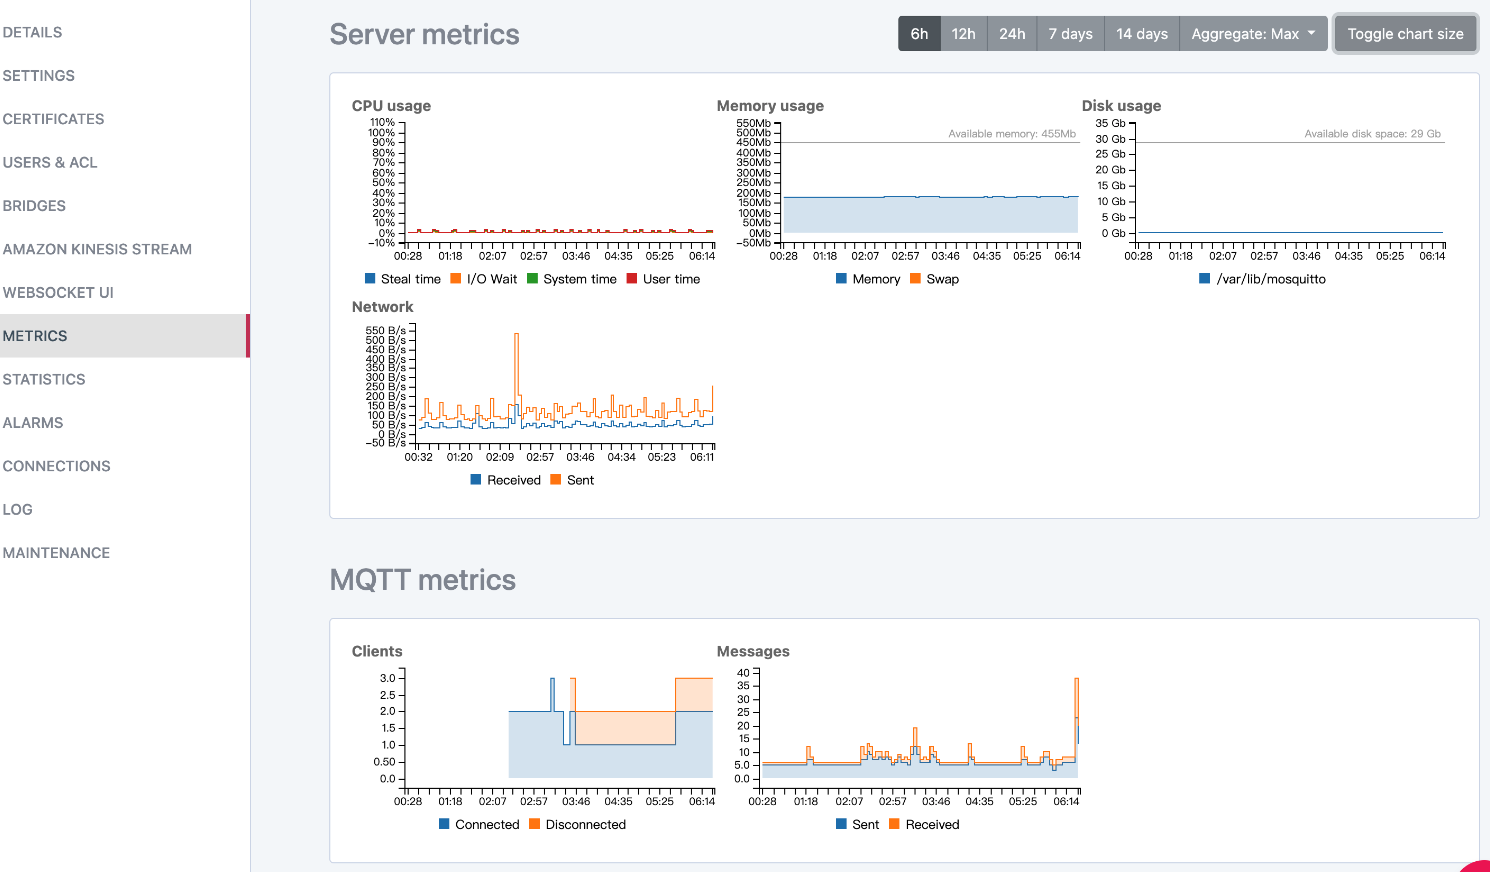
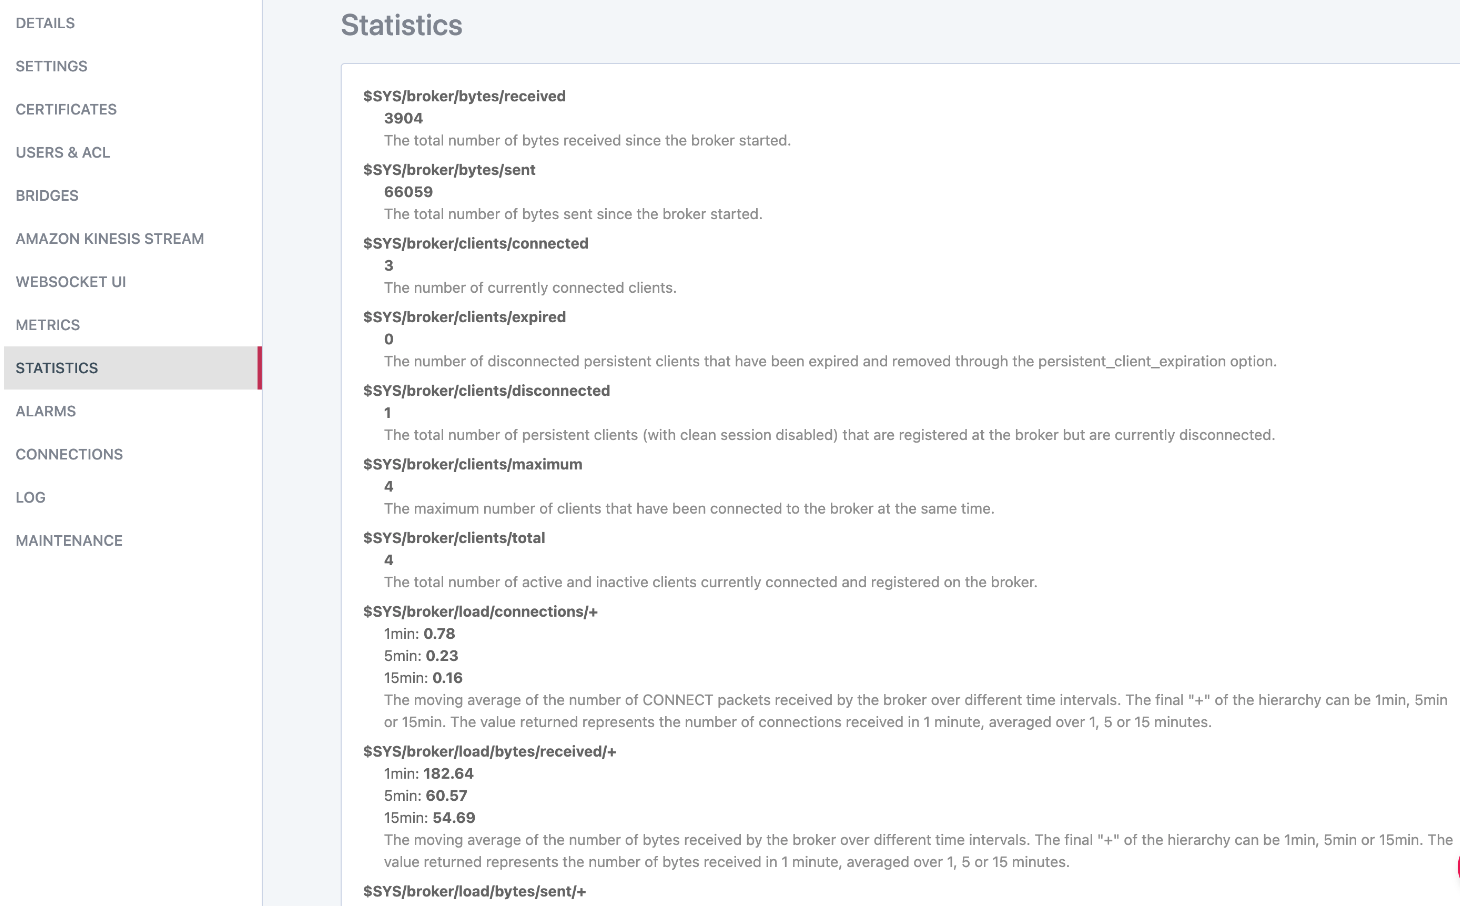
The statistics page displays the systematic parameters directly. There are 27 statistics indicating various aspects of deployments. It will be much better to visualize all the indicators.
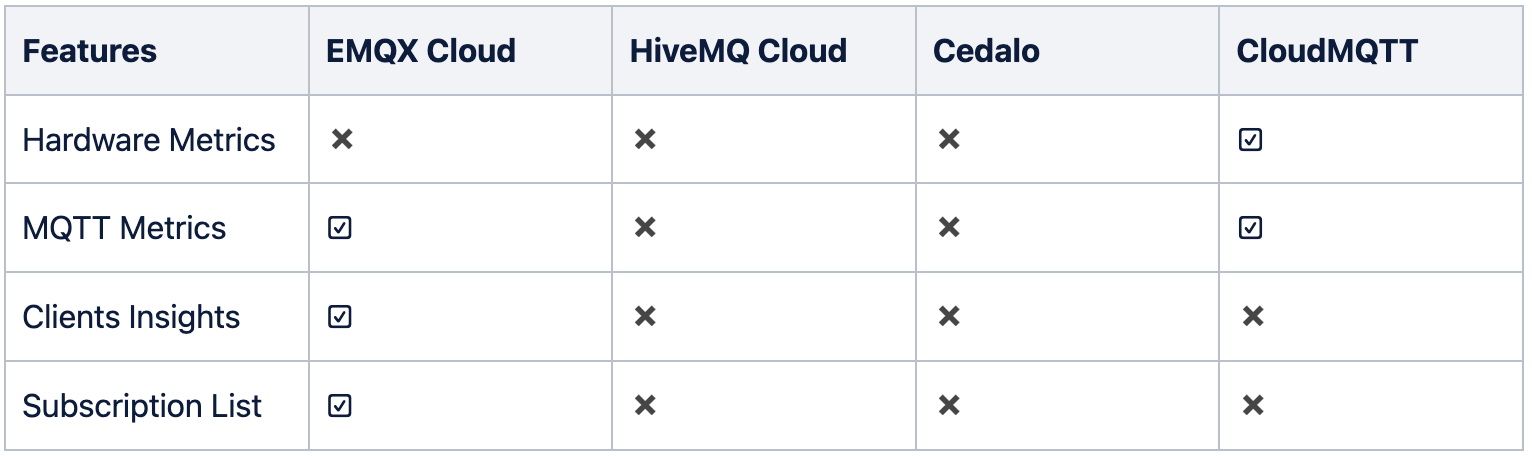
Comparison of Metrics and Statistics
Integration
EMQX Cloud
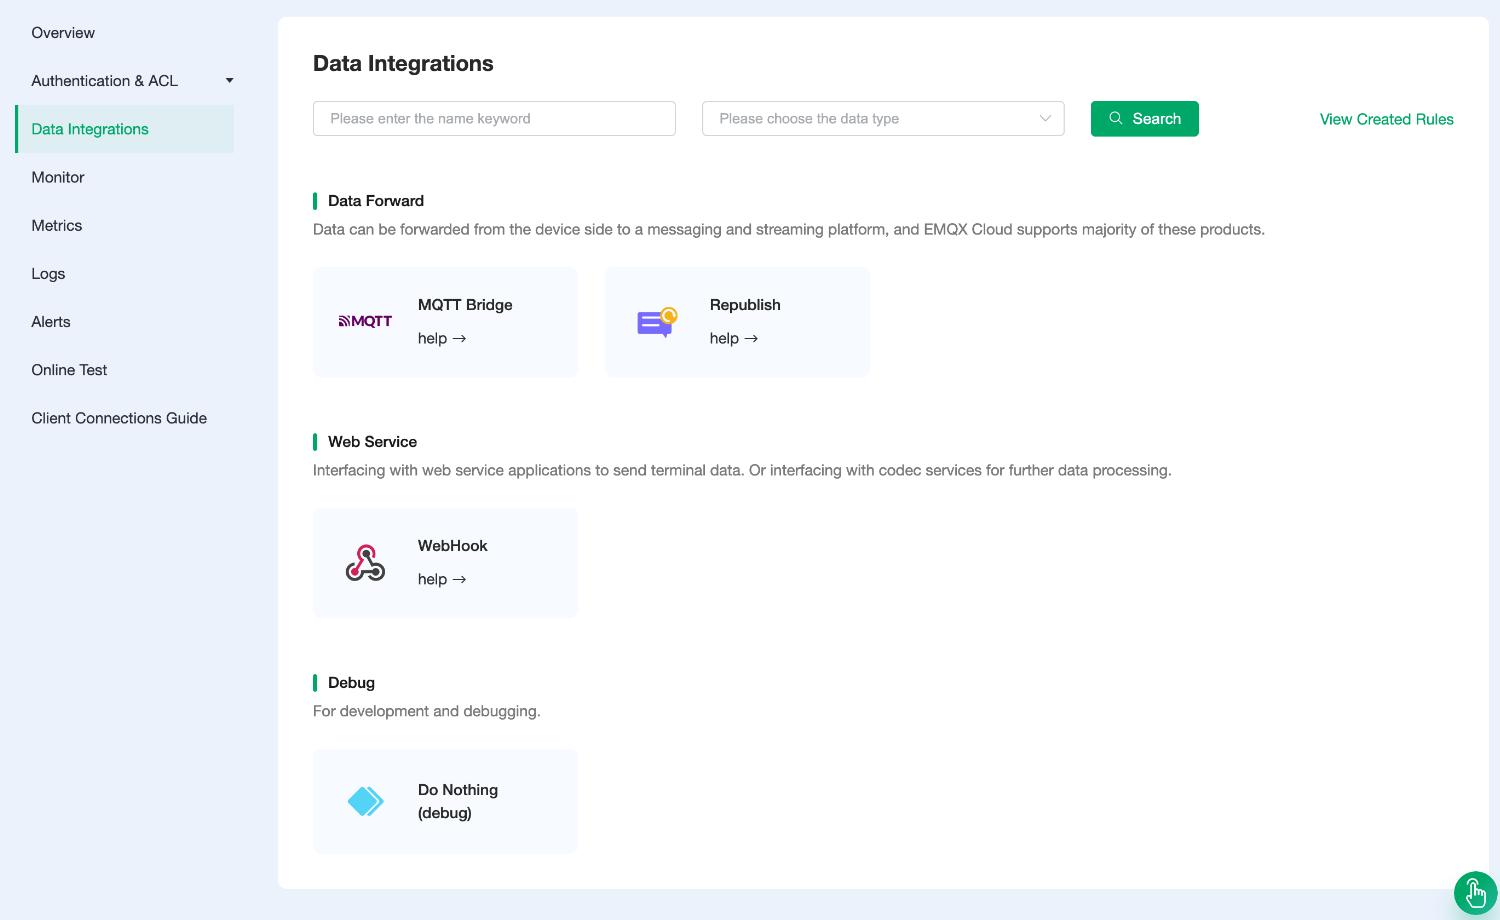
In Standard Plan, you can create an MQTT bridge to forward the messages to another broker or send the messages to the web application by Webhook.
CloudMQTT
Broker bridge is used to send messages to another broker or receive messages from another broker.
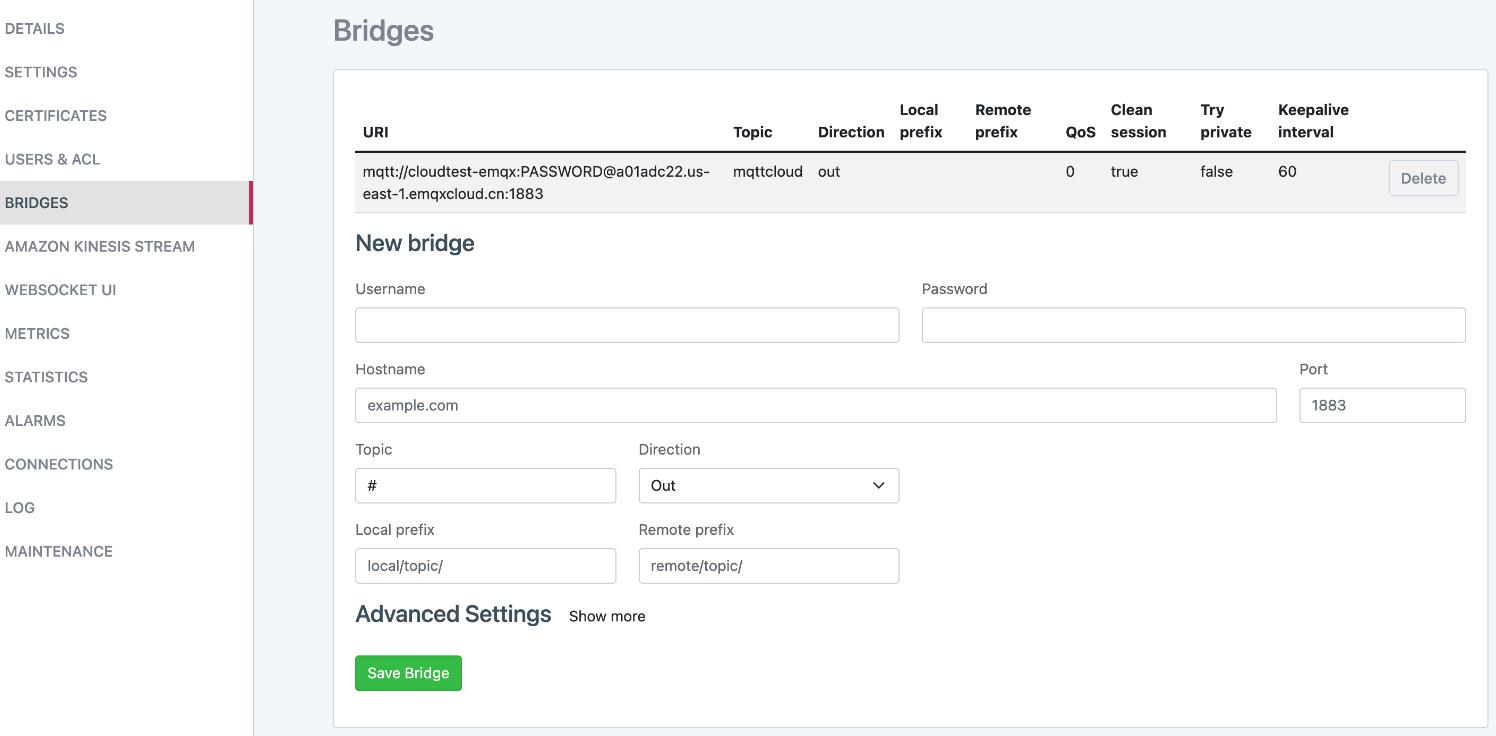
CloudMQTT integrates the ability to send messages to Amazon Kinesis Stream.
Billings
EMQX Cloud

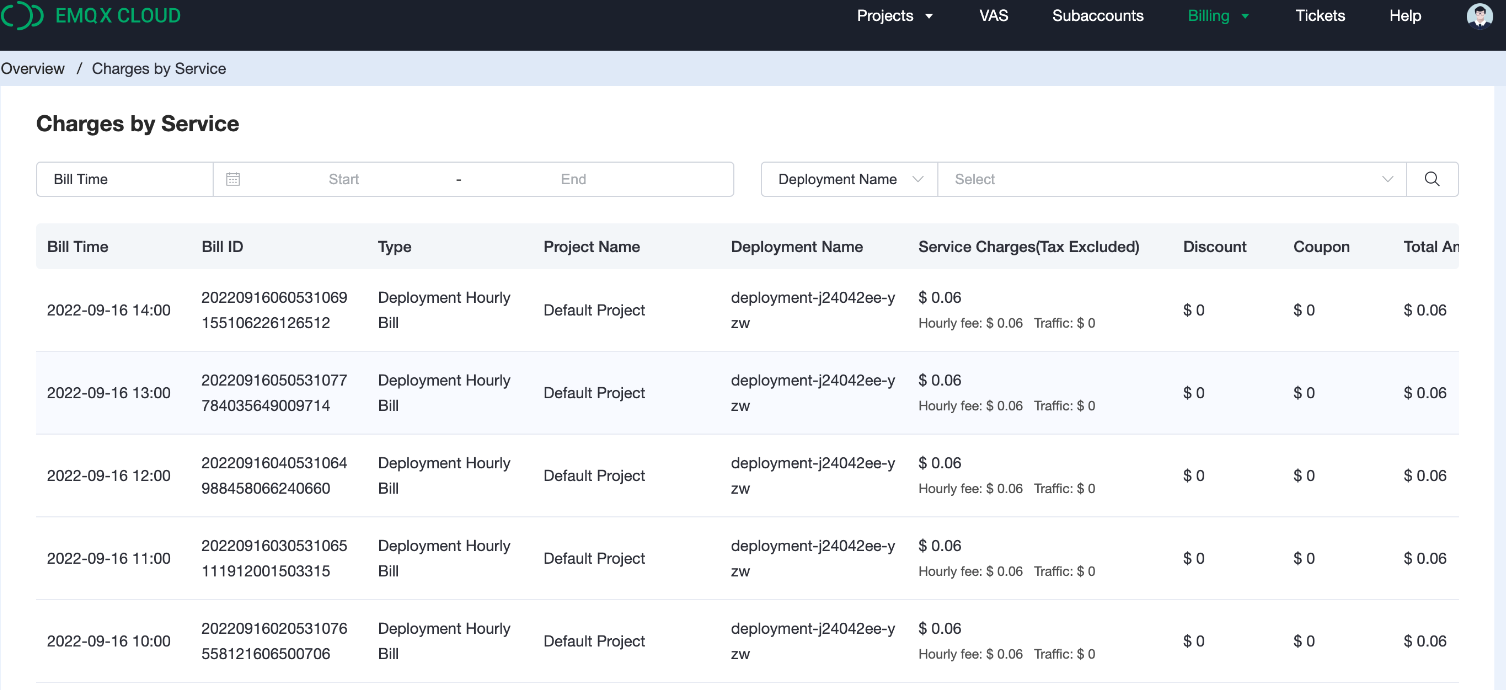
On the Billing page, you can find both brief and detailed information about every cent spent.
HiveMQ Cloud

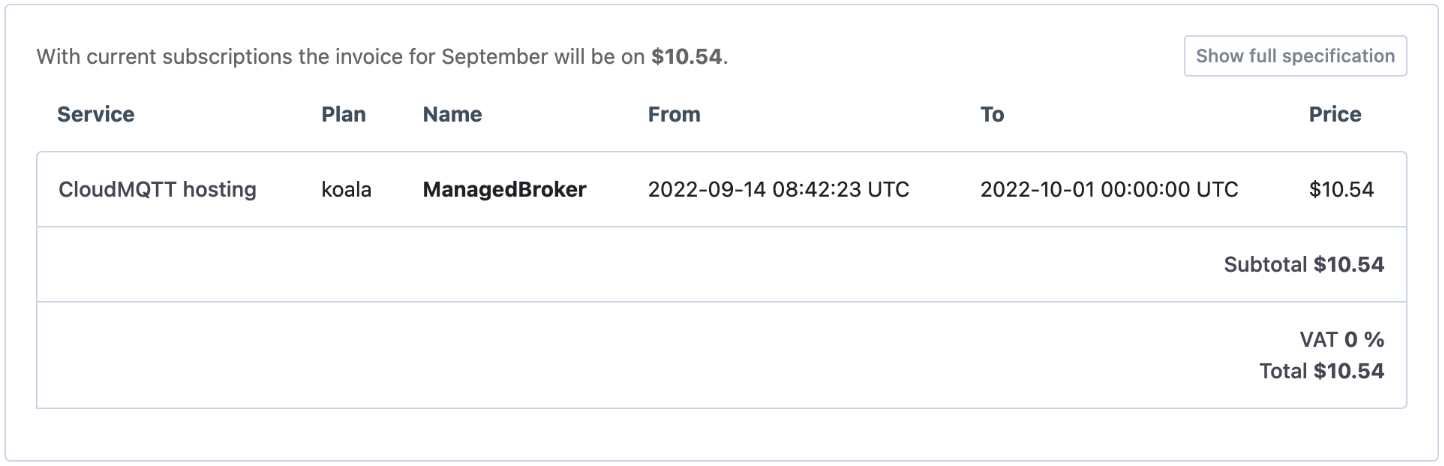
CloudMQTT
Logs and Notification
EMQX Cloud
Logs offer the ability to search for keywords, providing multiple levels of log information, including ClientID, ClientIP, Username, Topic, Resource, and Rule ID, as well as filtering by error types.
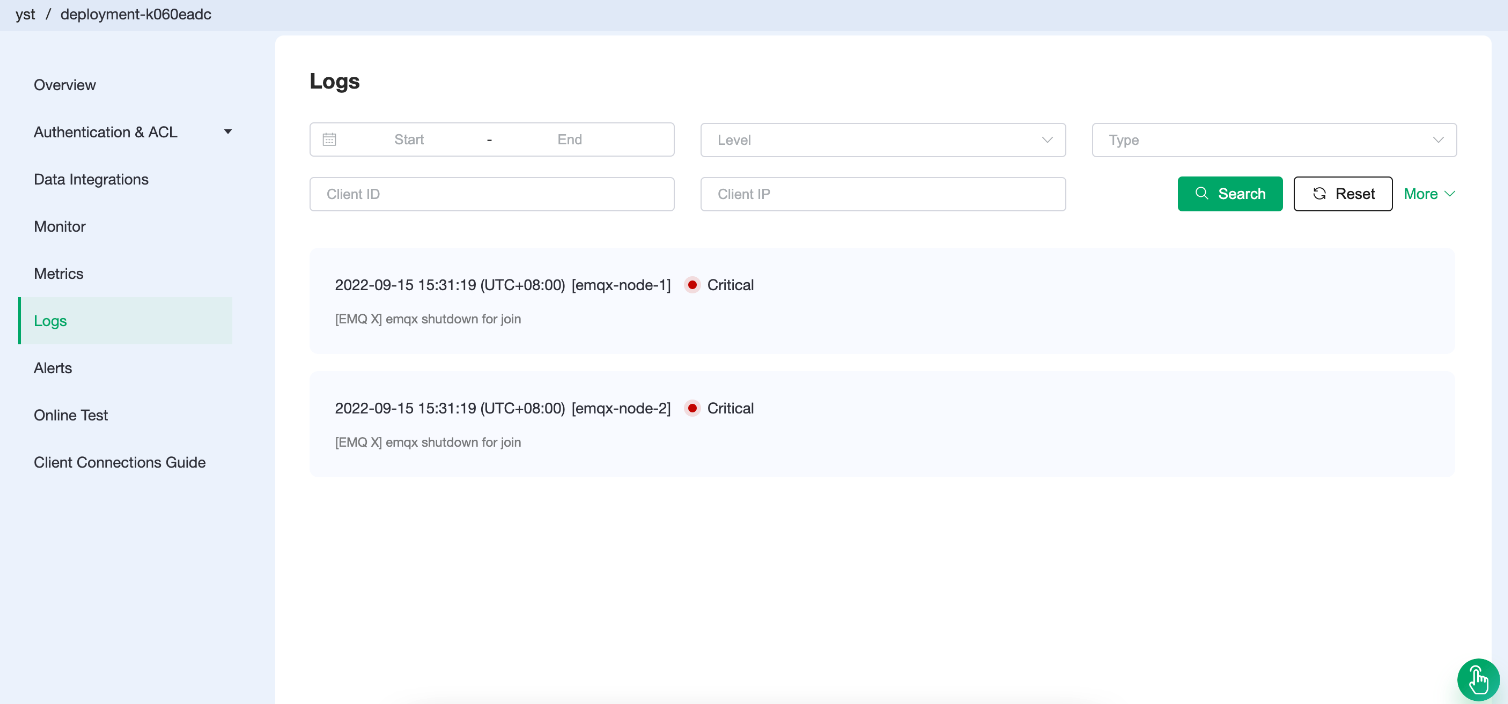
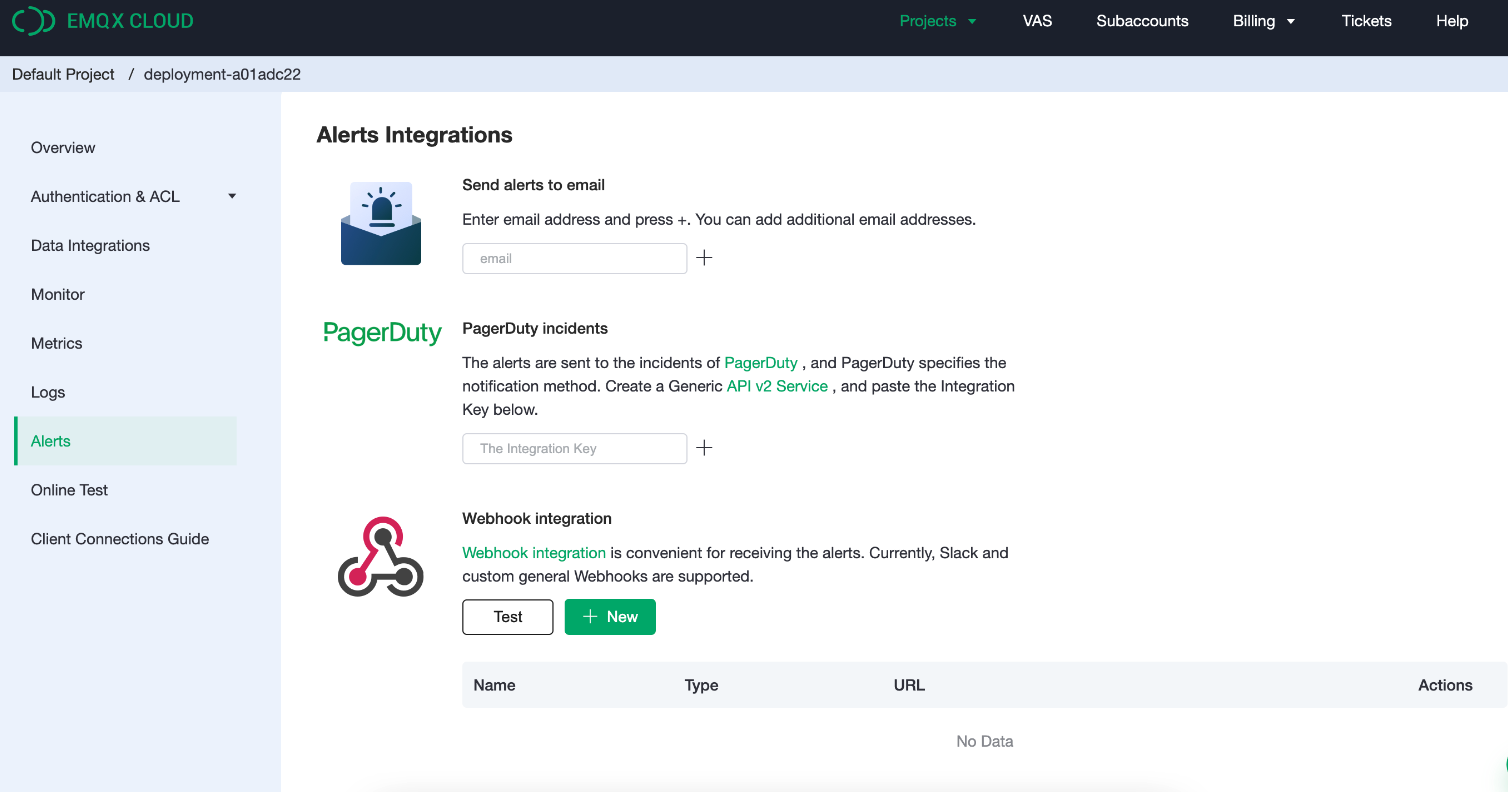
EMQX Cloud provides complete alerts reminders and alert integration, allowing users to make corresponding treatments promptly based on the alerts. EMQX Cloud provides the following alerts: Email, PageDuty, and Webhook (link the alerts to your system through webhook or to Slack group).
CloudMQTT
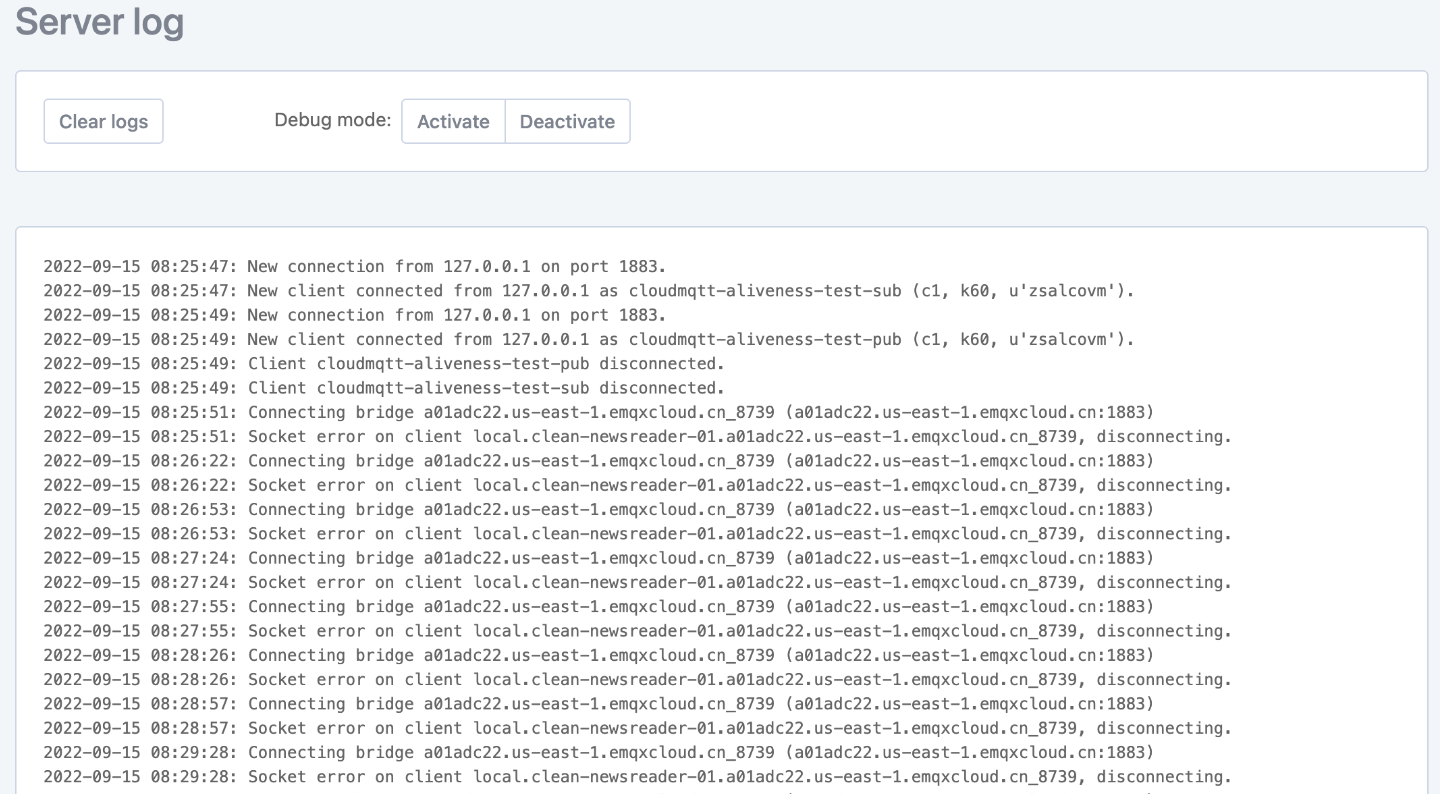
The Server Log Page lists all the logs, and the debug mode is quite useful for error detection.
The notification can be sent by several options: Email, Webhook, PageDuty, OpsGenie, VictorOps, and Slack when an alarm is triggered. Besides MQTT-related alarms, the hardware alarms about CPU, memory, and disk are detected as well.

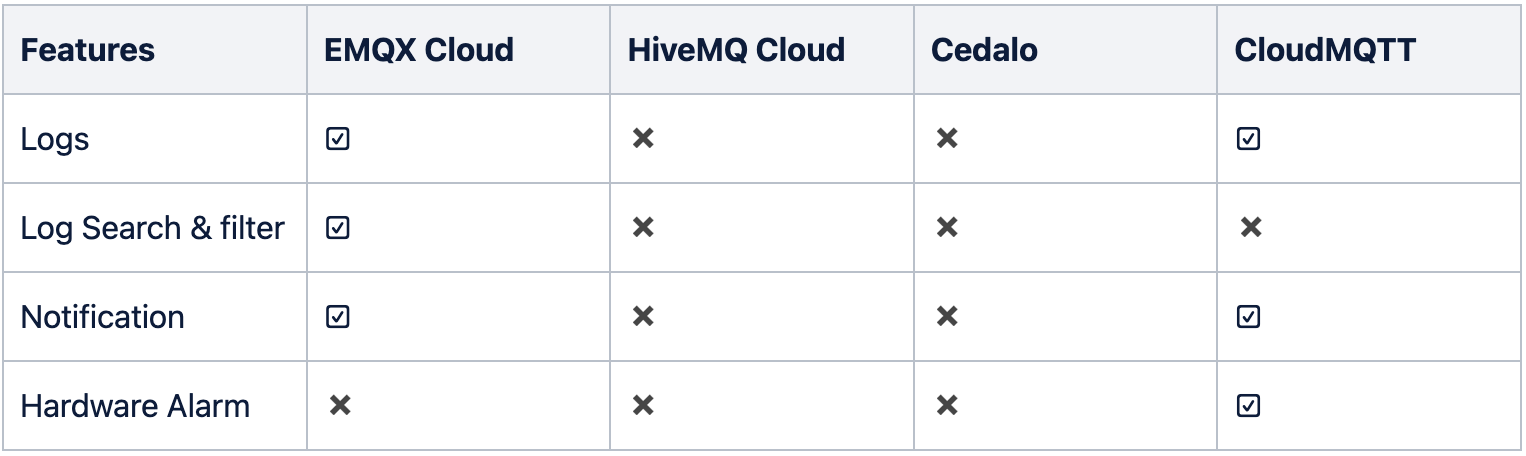
Comparison of Logs and Notifications
Conclusion
EMQX Cloud
The EMQX Cloud console features are the most comprehensive, providing everything needed for MQTT Broker-based IoT applications. It’s designed for real IoT application scenarios more than MQTT learning and testing.
Although the price is relatively high, the monthly usage cost will be around $100 if the package is prepaid annually. EMQX Cloud also provides excellent technical support service through the ticket system, and the replies are on time.
HiveMQ Cloud
Most of the features of HiveMQ Cloud, except those related to connectivity and access management, are in the Control Center, which is only available in the Standard and Dedicated versions. (For some reason, it is no longer possible to create the Standard version, so it’s not so easy for most users to experience the advanced features). In the Pay As You Go version, the functionality is pretty poor. If your application scenario is simple and the traffic and devices are limited, you can choose PSYG to reduce the cost. However, it is not recommended for users with higher functional requirements.
Cedalo — Pro Edition
Probably because of the trial version, the experience of using Cedalo's MQTT Broker is poor. It's more like a Beta in progress instead of a commercial product. There is no comprehensive statistics and monitoring, lack of notification method, billing function, and so on. In comparison with other products, it does not show any impressive advantages.
CloudMQTT
As you can see from the comparison, CloudMQTT’s console features are comprehensive and promise a mature product. In terms of comprehensiveness, CloudMQTT ranks only second to EMQX Cloud in managed broker comparison. The 100-connection version is insufficient for large use. And the next upgrade (1000 connection version) price will be $95 per month. The price is quite reasonable and competitive for all the features.
Opinions expressed by DZone contributors are their own.
Comments