Measuring Service Performance: The Whys and Hows
In this article, we explore the importance of measuring the performance of network services, emphasizing key metrics and statistics.
Join the DZone community and get the full member experience.
Join For FreeI enjoy improving application performance. After all, the primary purpose of computers is to execute tasks efficiently and swiftly. When you consider the fundamentals of computing, it seems almost magical — at its core, it involves simple arithmetic and logical operations, such as addition and comparison of binary numbers. Yet, by rapidly performing countless such operations, computers enable us to enjoy video games, watch endless videos, explore the vast expanse of human knowledge and culture, and even unlock the secrets of the universe and life itself. That is why optimizing applications is so important — it allows us to make better use of our most precious resource: time. To paraphrase a famous quote:
In the end, it’s not the number of years you live that matter, but the number of innovations that transpire within those years.
However, application performance often takes a backseat until it becomes a pressing issue. Why is this the case? Two primary reasons are at play: prioritization and the outdated notion of obtaining performance improvements for free.
Software Development Priorities
When it comes to system architecture, engineers typically rank their priorities as follows:
1. Security
2. Reliability
3. Performance
This hierarchy is logical, as speed is only valuable if tasks can be executed securely and reliably. Crafting high-quality software demands considerable effort and discipline. The larger the scale of service, the more challenging it becomes to ensure security and reliability. In such scenarios, teams often grapple with bugs, new feature requests, and occasional availability issues stemming from various factors. Consequently, performance is frequently perceived as a luxury, with attention given only if it impacts the bottom line.
This pattern is not unique to software development, though it may not be as apparent in other industries. For example, we rarely evaluate a car based on its "reliability" nowadays. In the past, this was not the case — it took several decades for people to shift their focus to aspects like design, comfort, and fuel efficiency, which were once considered "luxuries" or non-factors. A similar evolution is bound to occur within the software industry. As it matures, performance will increasingly become a key differentiator in a growing number of product areas, further underscoring its importance.
The End of Free Performance Gains
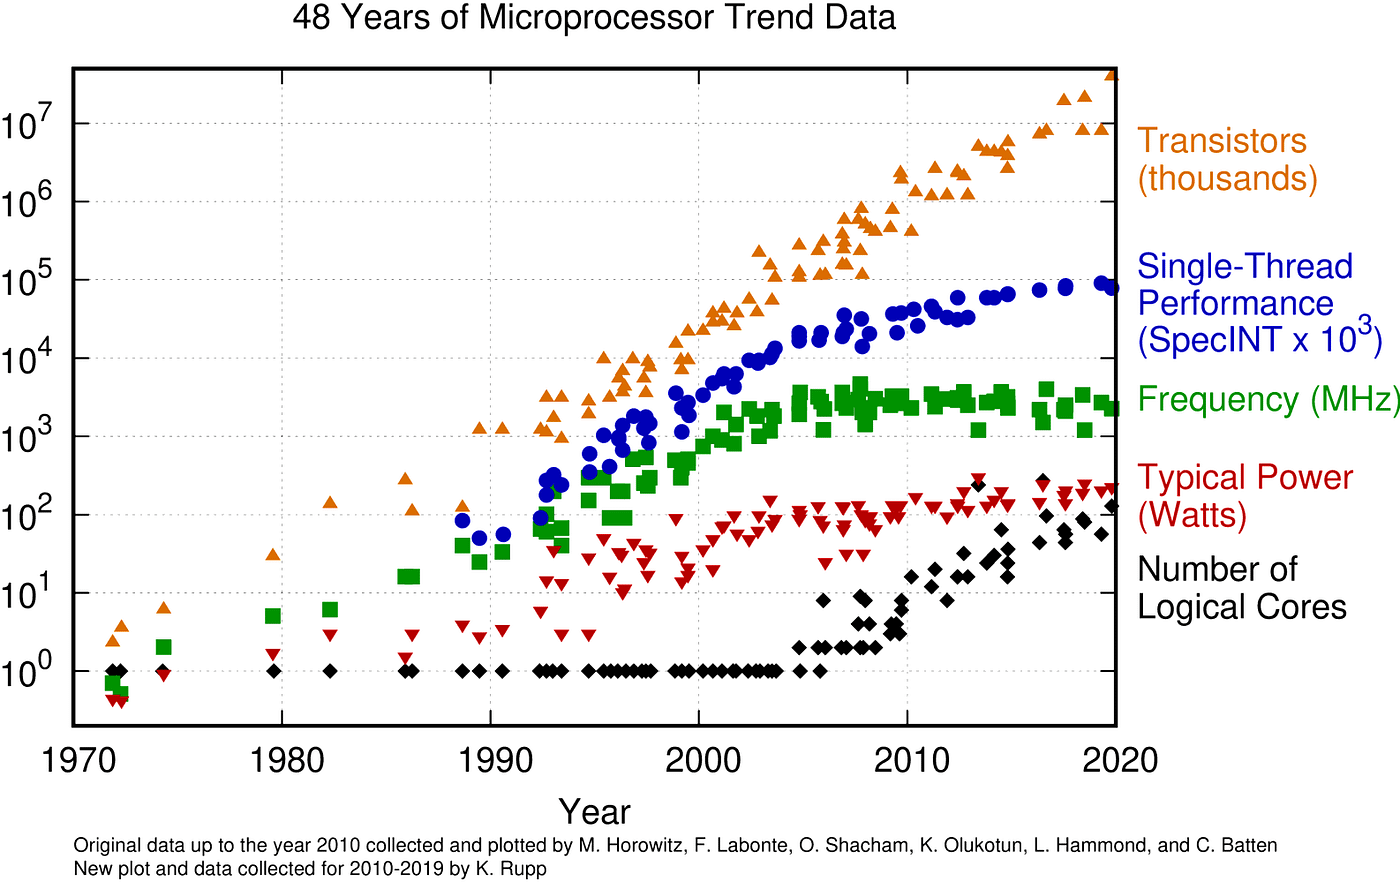
Another factor contributing to the low prioritization of performance is that it was once relatively effortless to achieve. As computers continually became faster, there was little incentive to invest in smarter engineering when a simple hardware upgrade could do the trick. However, this is no longer the case:
Optimizing Application Performance
Achieving exceptional results is rarely a matter of chance. If you want your product to meet specific standards and continually improve, you need a process that consistently produces such outcomes.
For example, to develop secure applications, your process should include establishing security policies, conducting regular security reviews, and performing scans. Ensuring reliability involves multiple layers of testing (unit tests, integration tests, end-to-end tests), as well as monitoring, alerting, and training organizations to respond effectively to incidents. Owners of large systems also integrate stress and failure injection testing into their practices, often referred to as "chaos engineering."
In essence, to build secure and reliable systems, software engineers must adhere to specific rules and practices applicable to all stages of a system development life cycle.
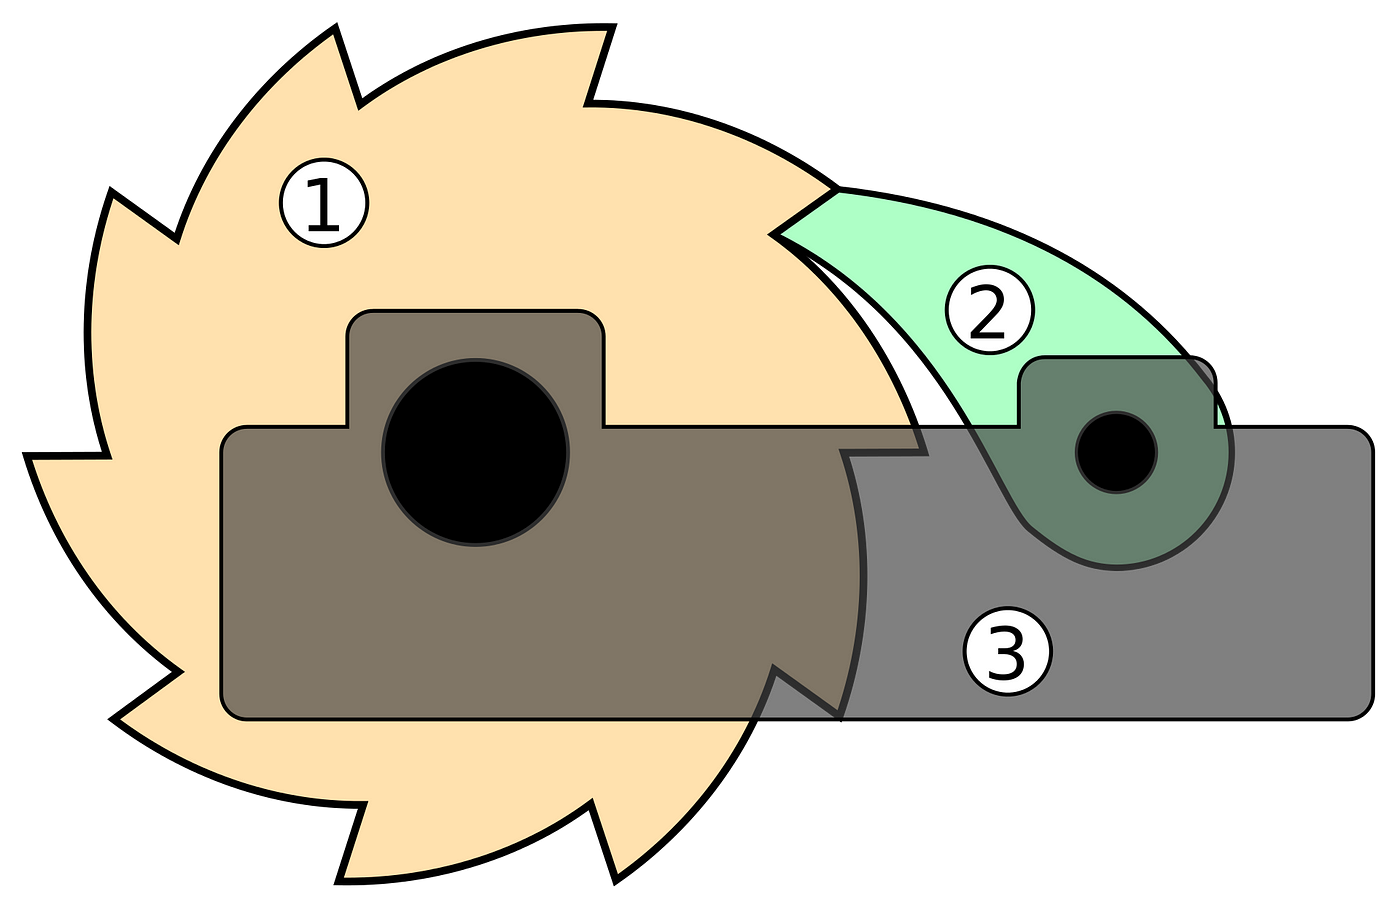
Performance optimization is no exception to this principle. Application code is subject to various forces — new features, bug fixes, version upgrades, scaling, and more. While most code changes are performance-neutral, they are more likely to hinder performance than enhance it unless the modification is a deliberate optimization. Therefore, it is essential to implement a mechanism that encourages performance improvements while safeguarding against inadvertent regressions:
There could be different use cases that involve multiple independent components. Only some of them may regress, or such regressions only manifest under particular circumstances. These components communicate over the network, which may have noise levels high enough to hide regressions, especially for tail latency and outliers. The application may show no signs of performance degradation under a low load but substantially slow down under stress.
Performance measurements may not capture general tendencies because some pay attention only to specific latency percentiles. On top of that, it’s impossible to model real-life conditions in non-production environments. So, without proper metrics and profiling, it would be difficult to identify and attribute performance issues.
In other words, it requires a deep understanding of the system and the infrastructure, as well as having the right tools and knowledge of how to effectively put all of that together. In this post, I will touch only the tip of this iceberg.
Essential Factors for Measuring Service Performance
When aiming to measure the performance of an isolated network service, it is crucial to establish a well-defined methodology. This ensures that the results are accurate and relevant to real-world scenarios. The following criteria are critical for assessing service performance:
- Avoid network latency/noise
- Prevent “noisy neighbor” issues from a Virtual Machine (VM) co-location
- Achieve latency resolution down to microseconds
- Control request rate
- Minimize overhead from the benchmarking tool
- Saturate CPU up to 100% to determine the limit of your service
- Provide comprehensive latency statistics
Let's delve deeper into each of the essential criteria for effectively measuring service performance.
Avoid Network Latency/Noise
Network latency is significantly larger than in-memory operations and is subject to various random events or states, such as packet loss, re-transmissions, and network saturation. These factors can impact results, particularly tail latency.
Prevent “Noisy Neighbor” Issues From VM Co-Location
Cloud providers often place multiple virtual machines (VMs) on the same hardware. To ensure accurate measurements, use either a dedicated "bare-metal" instance or a VM without over-subscription, providing exclusive access to all available CPUs.
Control Request Rate
Comparing different solutions at low, moderate, and high request rates allows for a more comprehensive evaluation. Thread contention and implementation deficiencies may only become evident at certain load levels. Additionally, ramping up traffic linearly helps analyze latency degradation patterns.
Achieve Latency Resolution Down to Microseconds
Millisecond latency resolution is suitable for measuring end-user latency but may be insufficient for a single service. To minimize noise-contributing factors and measure pure operation costs, a higher resolution is necessary. Although measuring batches of operations in milliseconds can be informative, this approach only calculates the average, losing visibility into percentiles and variance.
Saturate CPU up to 100% To Determine the Service Limits
The true test for a system is its performance at high request rates. Understanding a system's maximum throughput is crucial for allocating hardware resources and handling traffic spikes effectively.
Minimize Overhead From the Benchmarking Tool
Ensuring the precision and stability of measurements is paramount. The benchmarking tool itself should not be a significant source of overhead or latency, as this would undermine the reliability of the results.
Comprehensive Latency Statistics
To effectively measure performance, it is essential to utilize a range of metrics and statistics. The following list outlines some key indicators to consider:
p50(the median) — a value that is greater than 50% of observed latency samples.p90— the 90th percentile, a value better than 9 out of 10 latency samples. This is typically a good proxy for latency perceivable by humans.p99(tail latency) — the 99th percentile, the threshold for the worst 1% of samples.- Outliers:
p99.9andp99.99— crucial for systems with multiple network hops or large fan-outs (e.g., a request gathering data from tens or hundreds of microservices). max— the worst-case scenario should not be overlooked.tm99.9— (trimmed mean), the mean value of all samples, excluding the best and worst 0.1%. This is more informative than the traditional mean, as it eliminates the potentially disproportionate influence of outliers.stddev— (standard deviation) — a measure of stability and predictability.
While most of these metrics are considered standard in evaluating performance, it is worth taking a closer look at two less popular ones: outliers and the trimmed mean
Outliers (P99.9 and P99.99)
In simple terms, p99.9 and p99.99 represent the worst request per 1,000 and per 10,000 requests, respectively. While this may not seem significant to humans, it can considerably impact sub-request latency.
Consider this example: To process a user request, your service makes 100 sub-requests to other services (whether sequential or parallel doesn't matter for this example). Assume the following latency distribution:
- 999 requests — 1ms
- 1 request — 1,000ms
What is the probability your users will see 1,000+ms latency? The chance of a sub-request encountering 1s latency is 0.1%, but the probability of it occurring for at least one of the 100 sub-requests is:
(1 — (1–0.001)¹⁰⁰)=0.095 , or 9.5%!
Consequently, this may impact your end-user p90, which is certainly noticeable.
The following image and table illustrate how the number of sub-requests translates p99, p99.9, and p99.99 into the end-user latency percentiles:
Or in the table form (for a few data points):
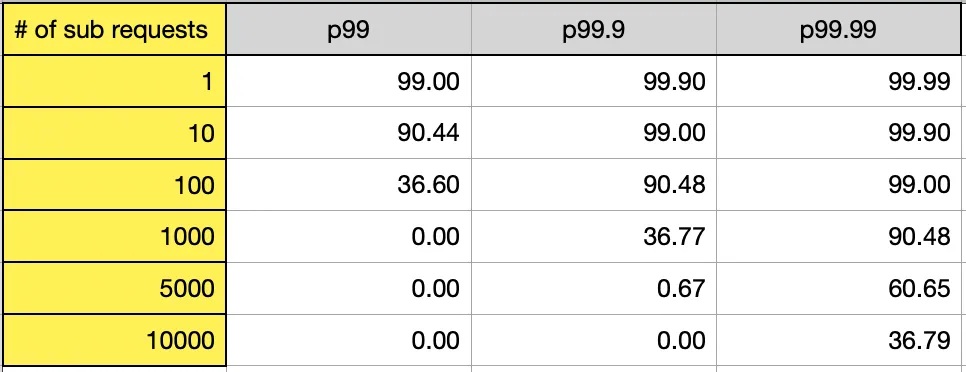
p99 may not be an accurate measure for systems with a large number of sub-requests. Therefore, it is crucial to monitor outliers like p99.9 or p99.99, depending on your system architecture, scale, and objectives.
Trimmed Mean
Are percentiles sufficient? The mean is commonly considered a flawed metric due to its sensitivity to outliers, which is why the median, also known as p50, is generally recommended as a better alternative. It's true that the mean can be sensitive to outliers, which can distort the metric. Let's assume we have the following latency measurements with a single outlier:
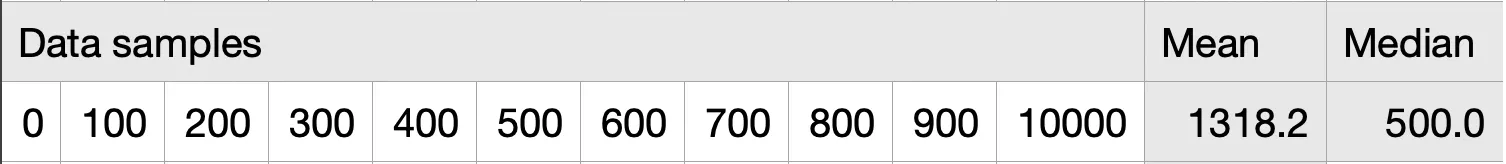
1318.2 is not representative, and the median is much better at capturing the average user experience.
However, the issue with percentiles is that they act as fences and are not sensitive to what happens inside the fence. In other words, this metric might not be proportional to the user experience. Let's assume our service degraded (from the top row to the bottom one):
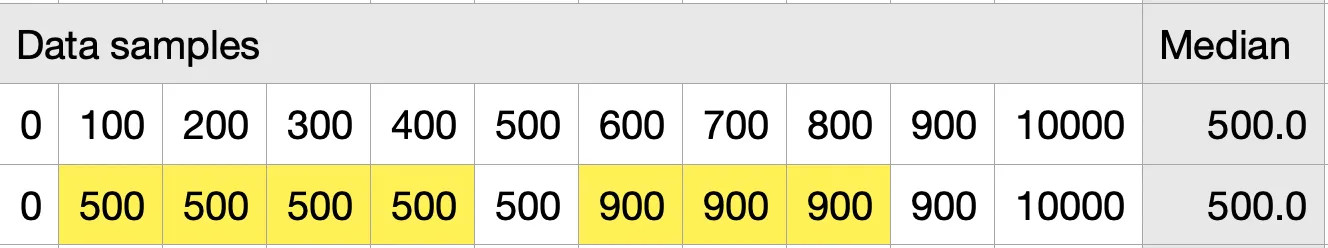
p50/p90thresholds won’t detect it.
Let's examine how the trimmed mean would handle this. It discards the best and the worst samples and calculates the average:
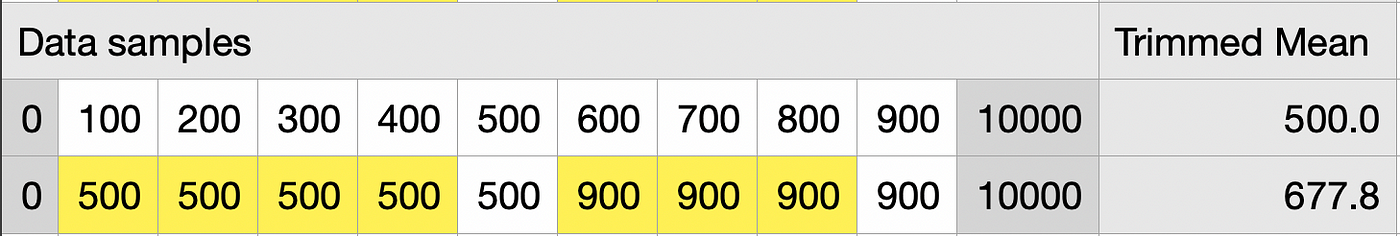
As shown, the trimmed mean reflects the performance regression while still providing a good sense of the average user experience. With the trimmed mean, we can enjoy the best of both worlds.
Practice Exercise
Now that we've explored the theoretical aspects of performance measurement let's dive into a practical exercise to put this knowledge to use. One interesting area to investigate is the baseline I/O performance of TCP proxies implemented in various languages such as C, C++, Rust, Golang, Java, and Python. A TCP proxy serves as an ideal test case because it focuses on the fundamental I/O operations without any additional processing. In essence, no TCP-based network service can be faster than a TCP proxy, making it an excellent subject for comparing the baseline performance across different programming languages.
Upon starting my search for a benchmarking tool, I was somewhat surprised by the challenge in finding an appropriate option, especially within the open-source domain.
Several existing tools are available for performance measurements and stress testing. However, tools written in Java/Python/Golang may suffer from additional overhead and noise generated by garbage-collection pauses. Apache Benchmarking tool ab doesn't allow the user to control the rate, and its latency statistics aren't as detailed. Also, it measures latency in milliseconds.
To solve the first issue, I had to create a performance-gauging tool in Rust that satisfies all of the requirements mentioned earlier. It can produce output like this:
Test: http-tunnel-rust
Duration 60.005715353s
Requests: 1499912
Request rate: 24996.152 per second
Success rate: 100.000%
Total bytes: 15.0 GB
Bitrate: 1999.692 Mbps

Summary:
200 OK: 1499912

Latency:
Min    :  109µs
p50    :  252µs
p90    :  392µs
p99    :  628µs
p99.9  : 1048µs
p99.99 : 1917µs
Max    : 4690µs
Mean   :  276µs
StdDev :  105µs
tm95   :  265µs
tm99   :  271µs
tm99.9 :  274µs
This output is useful for a single run. Unfortunately, a single run is never enough if you want to measure performance properly. It is also difficult to use this output for anything but taking a glance and forgetting the actual numbers.
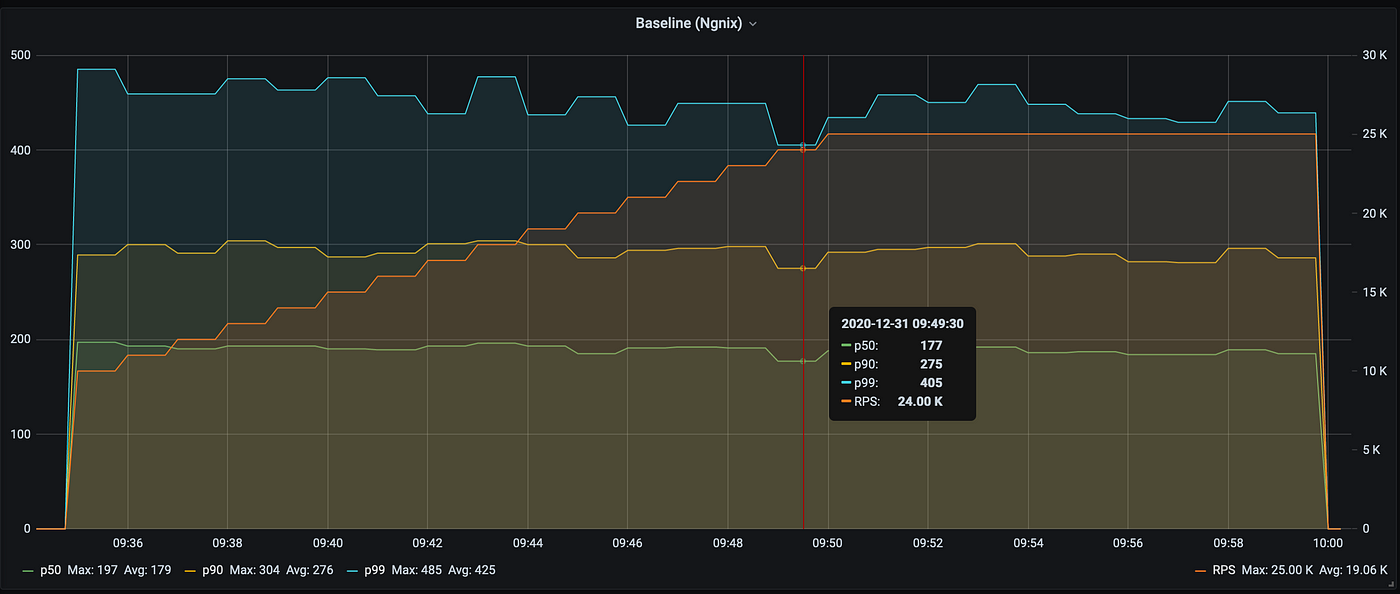
Reporting metrics to Prometheus and running a test continuously seems to be a natural solution to gather comprehensive performance data over time. Below, you can see the ramping up of traffic from 10k to 25k requests per second (rps) and the main percentiles (on the left — latency in µs; on the right — the request rate in 1,000 rps):
Then I configured the following TCP proxies:
HAProxy— in TCP-proxy mode. To compare to a mature solution written in C: http://www.haproxy.org/draft-http-tunnel— a simple C++ solution with very basic functionality (trantor) (running in TCP mode): https://github.com/cmello/draft-http-tunnel/ (thanks to Cesar Mello, who coded it to make this benchmark possible).http-tunnel— a simple HTTP-tunnel/TCP-proxy written in Rust (tokio) (running in TCP mode): https://github.com/xnuter/http-tunnel/tcp-proxy— a Golang solution: https://github.com/jpillora/go-tcp-proxyNetCrusher— a Java solution (Java NIO). Benchmarked on JDK 11, with G1: https://github.com/NetCrusherOrg/NetCrusher-java/pproxy— a Python solution based onasyncio(running in TCP Proxy mode): https://pypi.org/project/pproxy/
All of the solutions above use Non-blocking I/O, it’s the best method to handle network communication if you need highly available services with low latency and large throughput.
All these proxies were compared in the following modes:
- 25k rps, reusing connections for 50 requests.
- Max possible rate to determine the max throughput.
- 3.5k connections per second serving a single request (to test resource allocation and dispatching).
If I were asked to summarize the test result in a single image, I would pick this one (from the max throughput test, the CPU utilization is close to 100%):
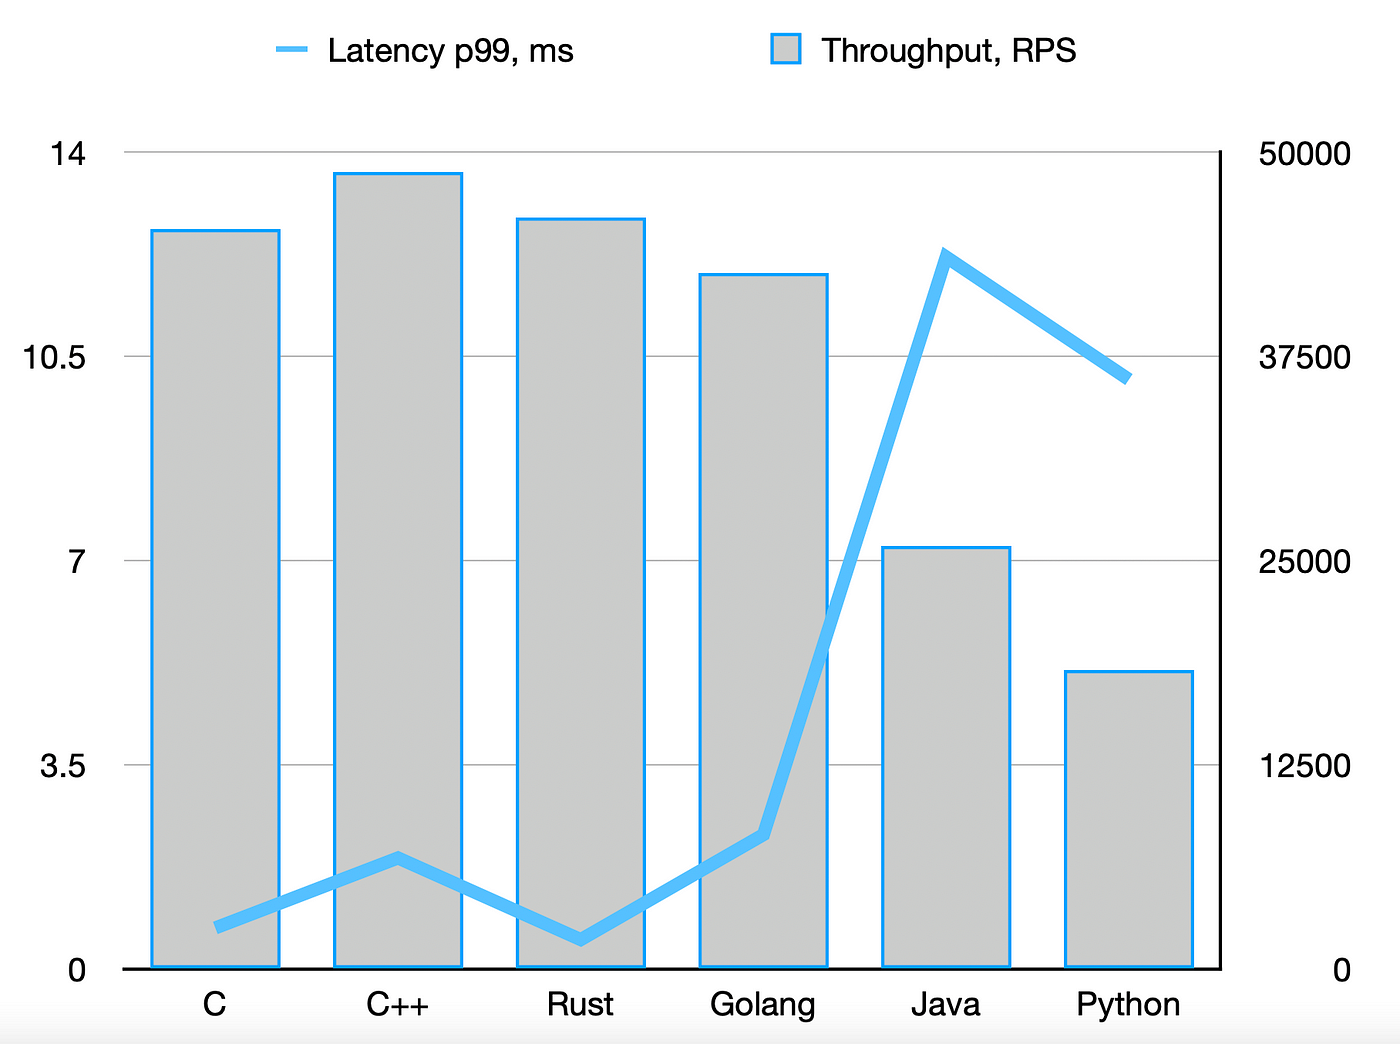
- The blue line is tail latency (Y-axis on the left) — the lower, the better.
- The grey bars are throughput (Y-axis on the right) — the higher, the better.
As you can see, Rust is indeed on par with C/C++, and Golang did well too. Java and Python are way behind. You can read more about the methodology and detailed results in the perf-gauge's wiki: Benchmarking low-level I/O: C, C++, Rust, Golang, Java, Python, in particular, measuring by these dimensions:
Closing Thoughts
In conclusion, understanding and accurately measuring the performance of network services is crucial for optimizing and maintaining the quality of your systems. As the software industry matures and performance becomes a key differentiator, it is essential to prioritize it alongside security and reliability.
Historically, performance improvements were easily achieved through hardware upgrades. However, as CPU frequency plateaus and harnessing the power of multiple cores or additional machines demands more sophisticated engineering, it is increasingly important to focus on performance within the software development process itself.
The evolution of performance prioritization is inevitable, and it is essential for software development teams to adapt and ensure that their systems can deliver secure, reliable, and high-performing services to their users. By emphasizing key metrics and statistics and applying accurate performance assessment methods, engineers can successfully navigate this shifting landscape and continue to create high-quality, competitive software.
Opinions expressed by DZone contributors are their own.
Comments