Mitigate the Risks of Poor Performing Cloud Apps
Have the right mix of tools to achieve the unified observability of the applications running in the cloud. Know your responsibilities while migrating to the cloud.
Join the DZone community and get the full member experience.
Join For FreeCloud technology is no longer novel. It has revolutionized the manner in which business services are provided to the end user. It has made it easier and faster for companies to access and share data, collaborate on projects, and access applications from anywhere in the world.
Is Cloud the 'One Medicine for All Diseases'?
Cloud technology has empowered businesses to become more flexible and responsive to customer needs. It has also facilitated customers to access and utilize services in a more secure and cost-effective manner.
It has gotten to a point where cloud is thought of as 'the cure for all ailments.' When talking with various Service Managers about their goal of transitioning to the cloud, most of them mentioned cost, elasticity, and improved uptime. Of course, these are undeniable 'book moves.' I would then ask them further, whose uptime are they referring to — the cloud's uptime or the business service's uptime?
I reside in a Housing and Development Board apartment. I no longer need to take responsibility for the upkeep of the building or the communal areas. However, can I expect the Housing Board to resolve the issue if I overload my home electrical circuit by plugging in too many devices and causing a fuse to blow?
Cloud is a partnership of shared responsibilities. Cloud providers are responsible for the services they offer. As an end user, it is expected that you maintain your services, including patching the operating system of your EC2 virtual machines, indexing your databases, and ensuring the uptime of your applications running on their Infrastructure-as-a-Service (IaaS) and Platform-as-a-Service (PaaS).
When someone migrates an application that is suffering from its own issues like SQL deadlocks, memory leaks, etc., can they trust the cloud to ensure the availability of their application?
IT Service Managers make decisions based on their experience and the advice given by their system integrators. They transition their disorganized apps to the cloud, expecting their system integrators to provide smooth delivery of apps; that isn't their responsibility. Ultimately, they become frustrated when their applications don't work correctly, even after moving to a "one size fits all" solution.
They initially thought that Azure Monitor/Cloud Watch would be helpful without realizing the scope of their capabilities. These tools are incredibly useful, as they provide the ability to monitor the resource utilization of the subscriptions from an infrastructure or capacity point of view. However, it's unrealistic to expect these tools to be able to cater to the needs of day-2 requirements of supporting an application running on the cloud.
A Strategic Approach Towards Observability
There is a pressing need for improved monitoring. The monitoring industry is like a library full of books of varying genres. Some specialize in databases, others in cloud computing, apps, Dev-ops, or unified solutions. What is the most effective strategy to adopt? According to Gartner's Magic Quadrant report for Application Performance Monitoring and Observability, the best approach is to analyze multiple forms of telemetry data, such as traces, metrics, and logs, in order to identify and address any potential problems.
- Metrics: These are real-time measurements like disk utilization, round trip time of the application, database growth rate, etc. They provide insights into the bottlenecks of the application.
- Traces: When we containerize the application, troubleshooting is no lesser than isolating a single thread from a Bee Hoon plate. It is important to visualize the flow of the application. In which server, in which app, in which class, and in which method the user request was executed? What were the other apps, databases, messaging queues, and third-party web services used to deliver my user request? So tracing the request flow path is also required.
- Logs: Analyzing logs like process logs, syslogs, event logs, and SQL error logs are some of the telemetry endpoints to be monitored for accurate problem isolation.
System Integrators are often faced with the challenge of ensuring that their customers get the observability they require while using cloud-native tools. Unfortunately, this can sometimes lead to situations where SIs are only able to deliver basic CPU/Memory monitoring, leaving customers unsatisfied. This can result in conflicts and additional costs for SIs since they must bring on board experts to provide app and database support.
Prevention With Shift-Left Monitoring Approach
I recently worked on a project to migrate an in-house application developed with LAMP architecture to Spring Boot in order to modernize it and run it on the cloud.
I was fortunate to be part of the conversation during the day-0 talks. Not many IT managers do this. Most of the meeting rooms for day-0 discussions don't provide a seat for observability engineering, as if it is something that will be dealt with on day-2.
We suggested the team onboard the monitoring platform on the day-1. The load testing application and observability solution revealed all the application bottlenecks during the stress testing phase. The load testing tools measured the response time, while the observability tools identified the root cause. This enabled them to identify and address any potential performance issues before production deployment.
Metrics
Capturing the right metrics for each layer is essential for improved visibility across the tiers. To that end, KPIs for web, app, and database servers were established, and performance dashboards were provided to both the Operations Team and the Applications Team. A solution that requires minimal effort in terms of auto-discovering servers and applications and monitoring KPIs without manual rules or configurations is recommended.
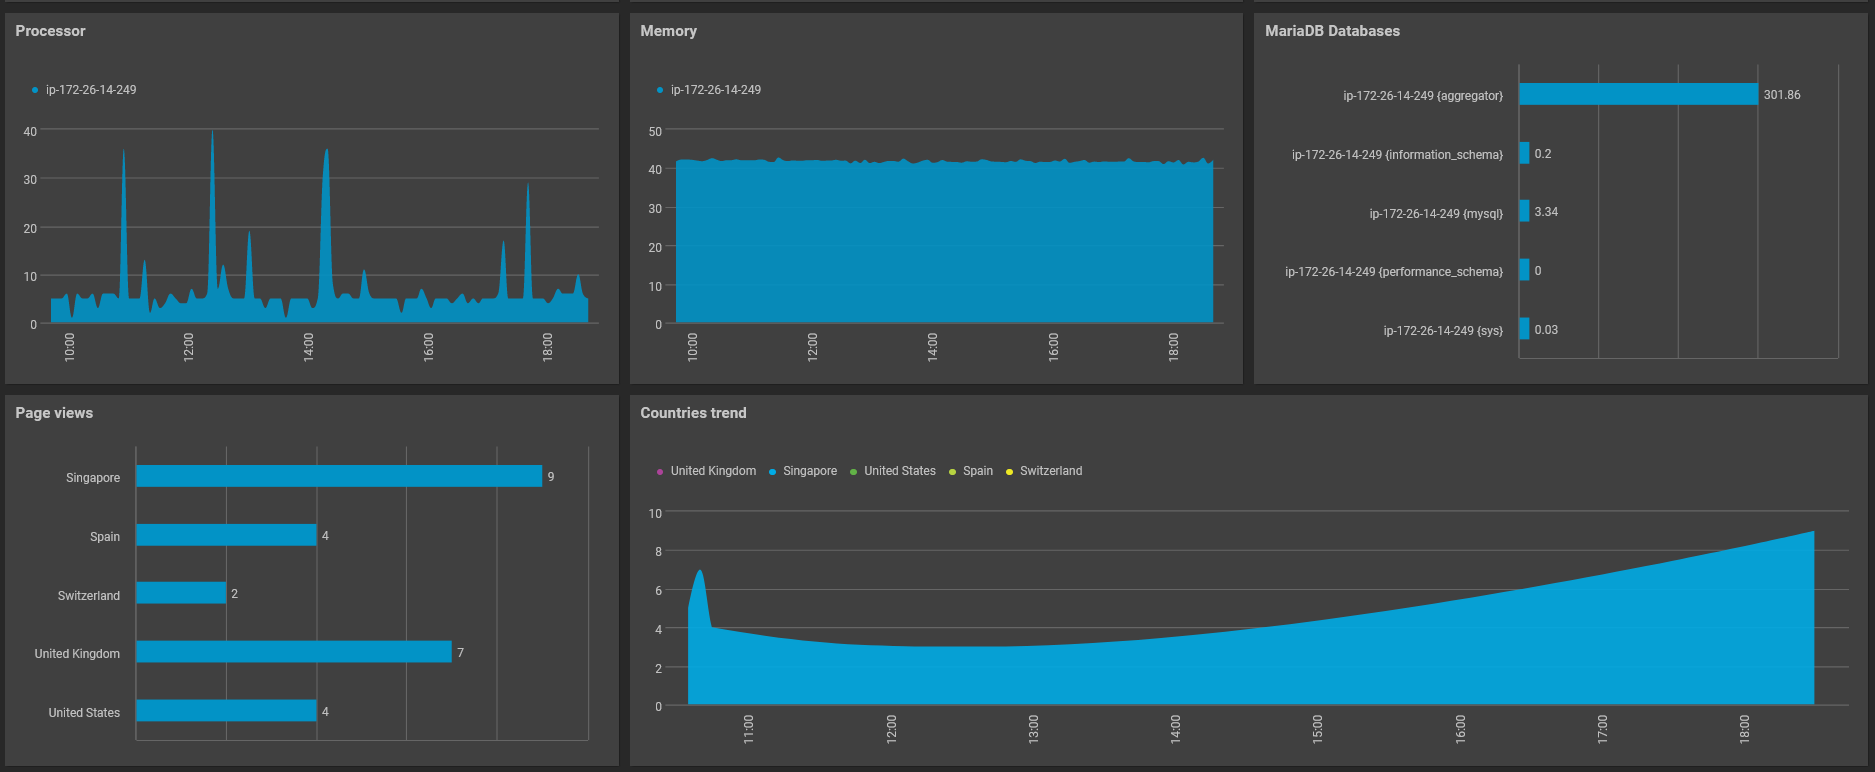
Consumption and Quality
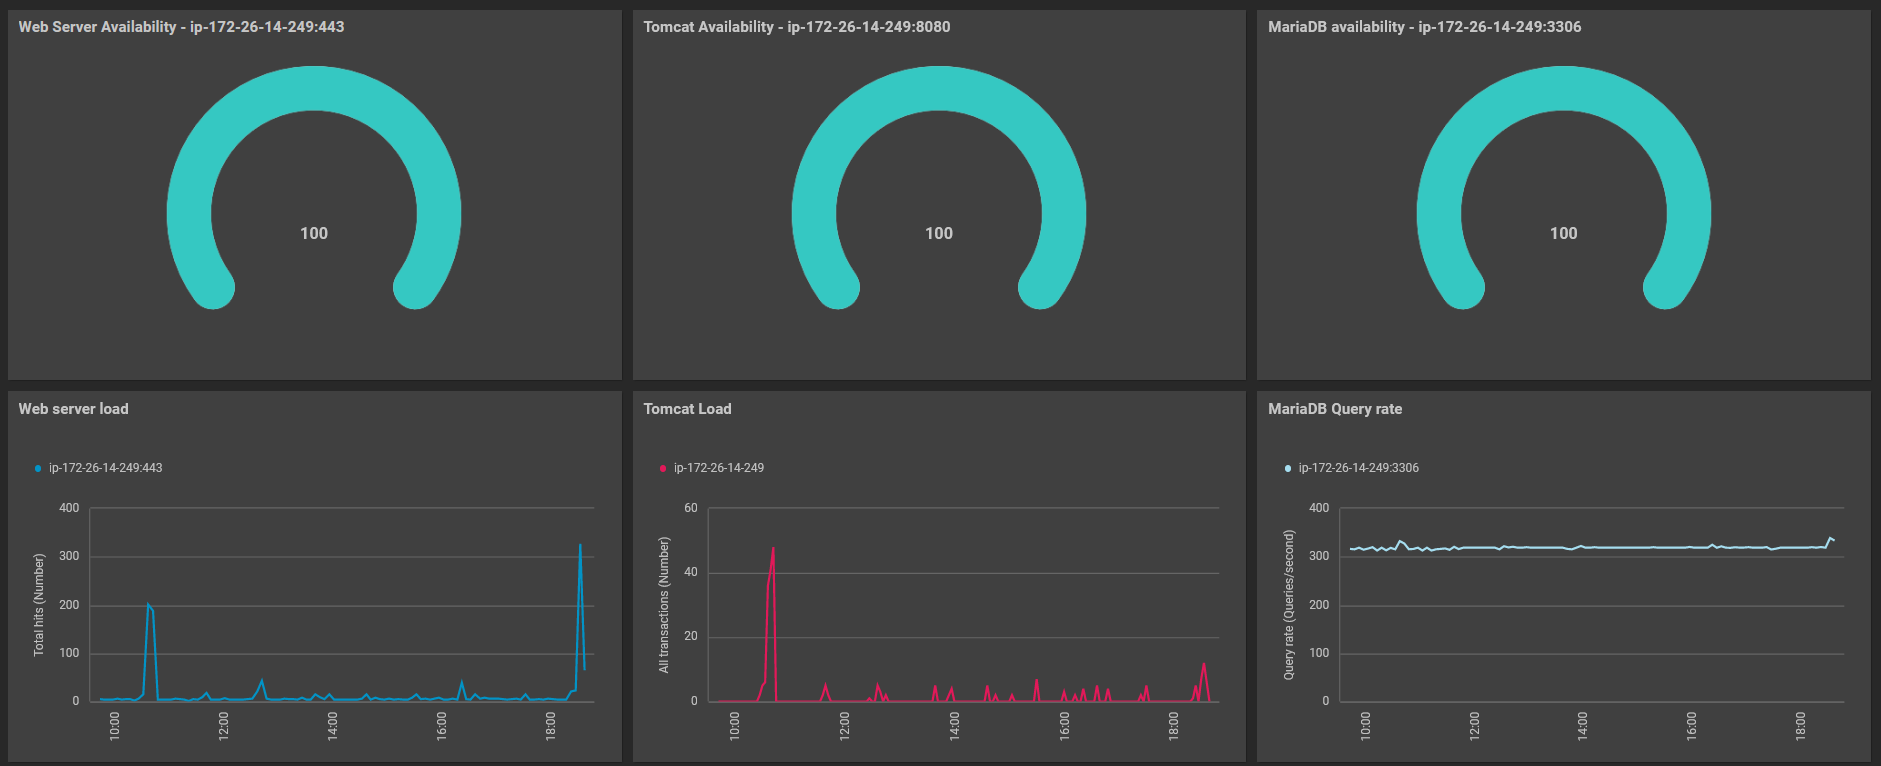
Availability and Demand
Traces
Traces are an essential component of our observability goals. At any given moment, the operations team has visibility into the user experience. They are able to answer questions such as:
- How many users are currently using the application?
- How many of these users are satisfied with their experience?
- What is the source of dissatisfaction for unhappy users?
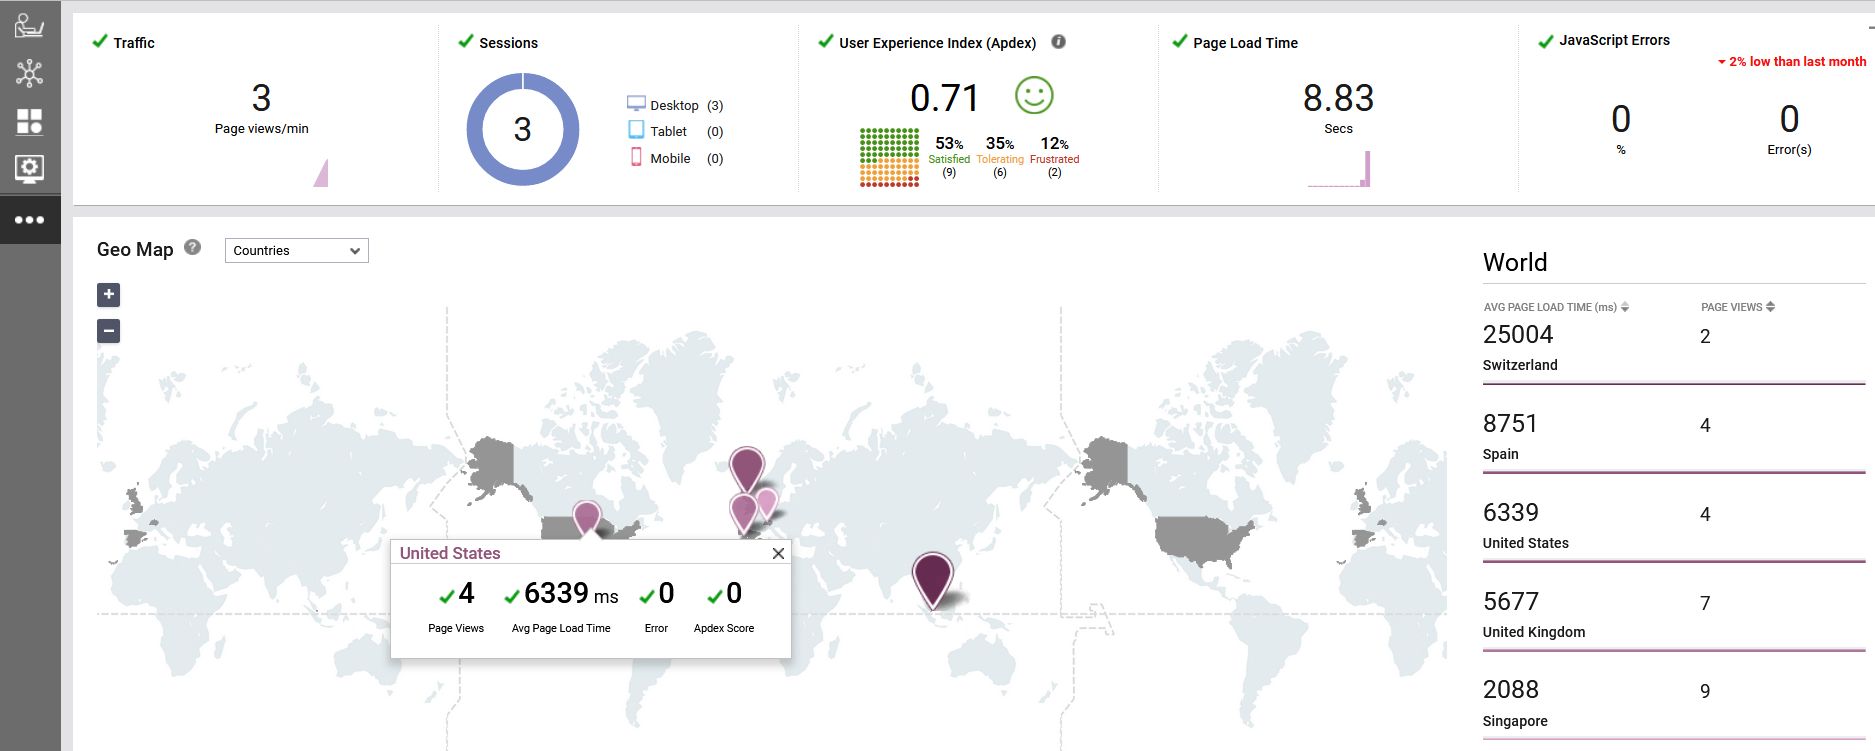
Real-time user experience monitoring
For example, one of the transactions was taking an excessive amount of time on the user side. The Real User Monitor identified the source of the delay; it was not on the server side but rather from third-party content that the site relies on. This saved the application team from wasting their valuable time reviewing various access logs or manually debugging to locate the source of the delay. Analyzing the user-side delays is not possible with process logs or access logs. Observability solutions play a crucial role here.
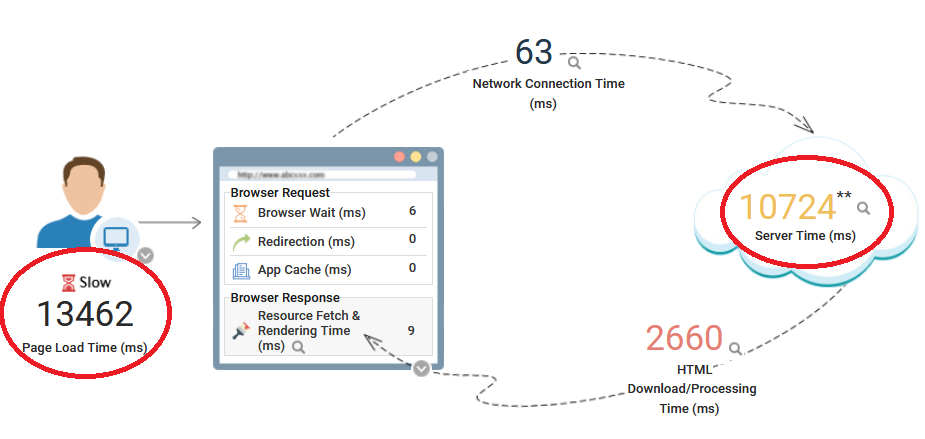
Analyzing a request slow down due to application-side delays
When requests were delayed due to long execution times on the application server, Real User Monitor provided the team with a single-click insight into the cross-application topology, allowing them to visualize how the slow requests were handled on the server side. It identified slow SQL queries and the Java method that caused the sluggishness. The application team is empowered with full visibility into each of the slow requests and the root cause.
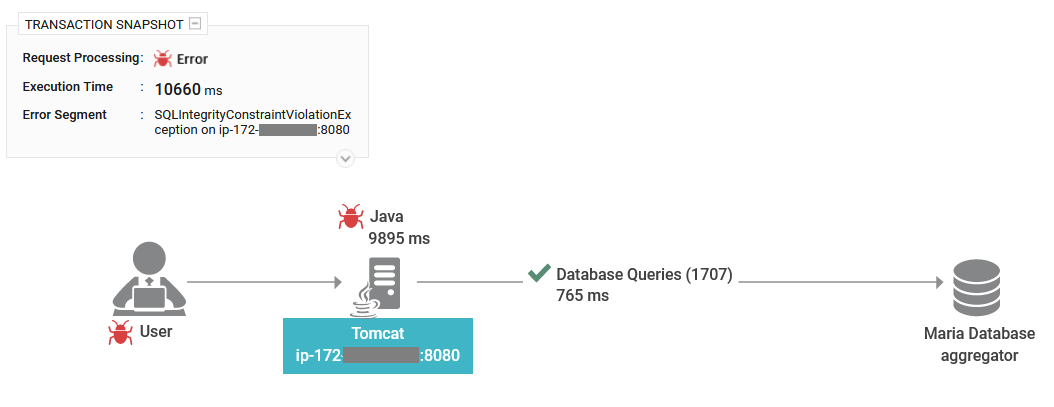
Tracing the request execution flow

Identify the slow methods for every slow request

Identify the slow-running database queries
Logs
Finally, it is about the logs — it ranked second highest in terms of the number of alerts. Whenever faults were detected in the logs, a notification was sent to the application team, which was resolved overnight, and the application was republished without any issues.
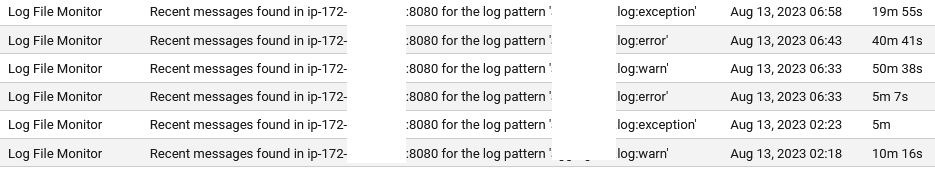
Real-time log monitoring
Conclusion and Best Practices
The collaborative effort between the development team, operations team, and us resulted in successful outcomes in a shorter time frame and smooth production migration.

Reducing the number of problems by collaboration between the teams
The key takeaway from this story is that none of the issues had anything to do with cloud computing. Rather, the problem stemmed from the bottleneck in the code caused by an unexpected surge in production data, reliance on external web calls, and a few bugs in the application code. Fortunately, these issues were addressed and effectively mitigated because of the monitoring strategy.

Ensuring the user calls are completed below the 10s service level
Given the current situation, it can be challenging for system integrators to offer support for cloud-hosted applications.
- Cloud providers monitoring is sufficient for capacity-related bottlenecks. They can tell you what happened. But you need to prepare yourself to answer why.
- Choose a unified observability tool to answer why.
- Define your support scope properly with your client. Ensure to leverage their development team to fix the application problems effectively. Provide them with enough justifications using the metrics/traces/logs using a unified observability console.
- Review the metrics/traces/logs on a regular basis using a unified console and advice customers on their painful areas.
Opinions expressed by DZone contributors are their own.
Comments