ML Metrics: Sensitivity vs. Specificity
In this post, you will learn about the concepts related to Sensitivity and Specificity and how are they used for measuring the Machine Learning model performance.
Join the DZone community and get the full member experience.
Join For FreeIn this post, we will try and understand the concepts behind evaluation metrics such as sensitivity and specificity, which is used to determine the performance of the Machine Learning models. The post also describes the differences between sensitivity and specificity. The concepts have been explained using the model for predicting whether a person is suffering from a disease or not.
What Is Sensitivity
Sensitivity is a measure of the proportion of actual positive cases that got predicted as positive (or true positive). Sensitivity is also termed as Recall. This implies that there will be another proportion of actual positive cases, which would get predicted incorrectly as negative (and, thus, could also be termed as the false negative). This can also be represented in the form of a false negative rate. The sum of sensitivity and false negative rate would be 1. Let's try and understand this with the model used for predicting whether a person is suffering from the disease. Sensitivity is a measure of the proportion of people suffering from the disease who got predicted correctly as the ones suffering from the disease. In other words, the person who is unhealthy actually got predicted as unhealthy.
Mathematically, sensitivity can be calculated as the following:
Sensitivity = (True Positive)/(True Positive + False Negative)
The following is the details in relation to True Positive and False Negative used in the above equation.
- True Positive = Persons predicted as suffering from the disease (or unhealthy) are actually suffering from the disease (unhealthy); In other words, the true positive represents the number of persons who are unhealthy and are predicted as unhealthy.
- False Negative = Persons who are actually suffering from the disease (or unhealthy) are actually predicted to be not suffering from the disease (healthy). In other words, the false negative represents the number of persons who are unhealthy and got predicted as healthy. Ideally, we would seek the model to have low false negatives as it might prove to be life-threatening or business threatening.
The higher value of sensitivity would mean higher value of true positive and lower value of false negative. The lower value of sensitivity would mean lower value of true positive and higher value of false negative. For healthcare and financial domain, models with high sensitivity will be desired.
What Is Specificity?
Specificity is defined as the proportion of actual negatives, which got predicted as the negative (or true negative). This implies that there will be another proportion of actual negative, which got predicted as positive and could be termed as false positives. This proportion could also be called a false positive rate. The sum of specificity and false positive rate would always be 1. Let's try and understand this with the model used for predicting whether a person is suffering from the disease. Specificity is a measure of the proportion of people not suffering from the disease who got predicted correctly as the ones who are not suffering from the disease. In other words, the person who is healthy actually got predicted as healthy is specificity.
Mathematically, specificity can be calculated as the following:
Specificity = (True Negative)/(True Negative + False Positive)
The following is the details in relation to True Negative and False Positive used in the above equation.
- True Negative = Persons predicted as not suffering from the disease (or healthy) are actually found to be not suffering from the disease (healthy); In other words, the true negative represents the number of persons who are healthy and are predicted as healthy.
- False Positive = Persons predicted as suffering from the disease (or unhealthy) are actually found to be not suffering from the disease (healthy). In other words, the false positive represents the number of persons who are healthy and got predicted as unhealthy.
The higher value of specificity would mean higher value of true negative and lower false positive rate. The lower value of specificity would mean lower value of true negative and higher value of false positive.
What Are the Differences Between Sensitivity and Specificity?
While Sensitivity measure is used to determine the proportion of actual positive cases, which got predicted correctly, Specificity measure is used to determine the proportion of actual negative cases, which got predicted correctly.
Where Are Sensitivity and Specificity Used?
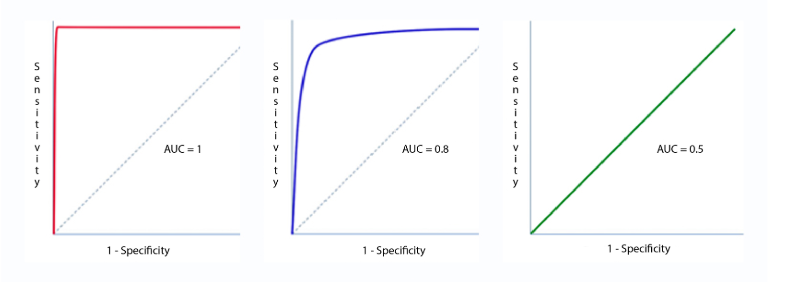
Sensitivity and Specificity measures are used to plot the ROC curve. And, Area under ROC curve (AUC) is used to determine the model performance. The following represents different ROC curves and related AOC values.
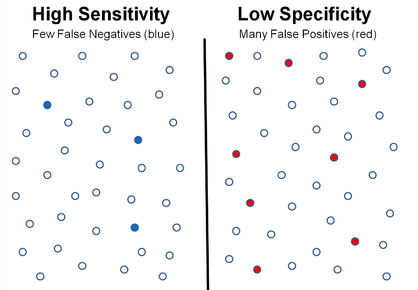
 The diagram below represents a scenario of high sensitivity (low false negatives) and low specificity (high false positives).
![high sensitivity vs low specificity]() References
References
 References
Summary
In this post, you learned about the concepts related to Sensitivity and Specificity and how are they used for measuring the Machine Learning model performance. You also learned about their differences and how they are used to build ROC and determine AUC for evaluating model performance.
Published at DZone with permission of Ajitesh Kumar. See the original article here.
Opinions expressed by DZone contributors are their own.
Comments