Monitor Apache Kafka with Telegraf and Grafana in Azure
This article talks about monitoring Apache Kafka on Azure using Telegraf and Grafana. I will guide you on installation, setup, and running monitoring solutions.
Join the DZone community and get the full member experience.
Join For FreeMonitoring helps to drive productivity and improves service availability. Apache Kafka is no exception to that. With Apache Kafka gaining popularity and becoming the de-facto standard for distributed messaging in Microservice architecture, it is important for DevOps engineers to understand some key metrics like - Consumer lag? Under-replicated partitions? Or is your Kafka cluster down? - to have a highly reliable and available Kafka cluster and stay on top of data and application health.
Tools to Monitor Apache Kafka
There are many tools available to monitor Apache Kafka including:
- LinkedIn Burrow
- Yahoo Kafka Manager
- KafDrop
- Confluent Control Centre - if you use Confluent Kafka and many other tools
We can also monitor Apache Kafka using Java Management Extensions (JMX) with popular JMX clients like Prometheus, Telegraf, etc.
In this article, I will walk through, monitoring Apache Kafka deployed on Azure Cloud using Telegraf and Grafana. Note that, Azure also provides managed Kafka using HDInsight Kafka. But if you want to build a cloud-agnostic Apache Kafka cluster, then it is important to have a monitoring solution for the cluster. In this article, I will guide you on installation, setup, and running monitoring solutions using the Telegraf agent, and Grafana, Jolokia agent, Azure Monitor. As a result, we’ll see the system, Kafka Broker, Kafka Consumer, and Kafka Producer metrics on our dashboard on the Grafana side.
Let's look into some of these components:
Jolokia Agent
Jolokia is a JMX-HTTP agent-based approach with support for many platforms. In addition to basic JMX operations, it enhances JMX remoting with unique features like bulk requests and fine-grained security policies.
Telegraf
Telegraf is a lightweight server process capable of collecting, processing, and aggregating metrics. Telegraf is a plugin-driven server agent for collecting and sending metrics and events from databases, systems, and IoT sensors.
Grafana
Grafana is a popular fully-featured open-source frontend dashboard solution. This is a visualization tool designed to work with a variety of data sources like Graphite, InfluxDB, Elasticsearch, etc. This solution allows the fast and easy development of dashboards for users.
Azure Monitor
Azure Monitor collects monitoring telemetry from a variety of on-premises and Azure sources. Azure Monitor allows collecting granular performance and utilization data, activity and diagnostics logs, and notifications from Azure resources.
Building Monitoring Solution
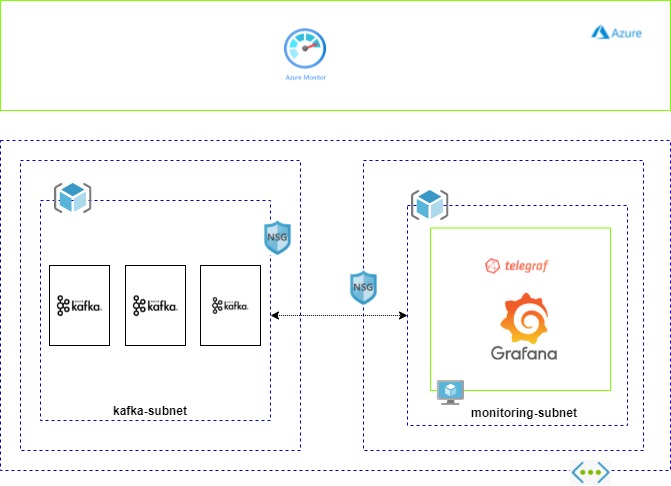
This is a high-level architecture diagram to build a monitoring solution for Apache Kafka hosted on Azure VM's.
Here I have created 2 subnets - one for the Kafka Cluster and another for the monitoring solutions set up, to segregate the access responsibility. When you set up a monitoring solution in a separate subnet, make sure you have updated the inbound/outbound rules in the respective NSG of the subnets to have proper communications. The monitoring subnet will have a VM to host the Grafana and Telegraf agents.
To handle HA, you need to create 2 VM's and use Azure Application Gateway to balance the load. Let's walk through the setup:
1. Install Jolokia
- Download the latest version of the Jolokia JVM-Agent from here. ( version jolokia-jvm-1.7.1-agent.jar is latest as of today)
- Save jolokia-jvm-1.7.1-agent.jar on the Kafka server in/opt/kafka/libs or any location.
- Configure Kafka to use Jolokia:
Add the following snippet to kafka-server-start.sh:
export JMX_PORT=9999 export RMI_HOSTNAME=<KAFKA_SERVER_IP_ADDRESS> export KAFKA_JMX_OPTS="-javaagent:/opt/kafka/libs/jolokia-agent.jar=port=8778,host=$RMI_HOSTNAME -Dcom.sun.management.jmxremote -Dcom.sun.management.jmxremote.authenticate=false -Dcom.sun.management.jmxremote.ssl=false -Djava.rmi.server.hostname=$RMI_HOSTNAME -Dcom.sun.management.jmxremote.rmi.port=$JMX_PORT"- Restart the Kafka service.
- Verify that you can access Jolokia on port 8778 by running:
Curl - http://KAFKA_SERVER_IP_ADDRESS:8778/jolokia/version
2. Install the Telegraf Agent
This integration uses the Jolokia input plugin for Telegraf to get the Kafka metrics via JMX.
You can download the latest Telegraf agent from here.
3. Configure Jolokia Input Plugin
Create a file called jolokia-kafka.conf in /etc/telegraf/telegraf.d and enter the following:
Note: Replace KAFKA_SERVER_IP_ADDRESS with Kafka server IP address:
## Read JMX metrics through Jolokia
 [[inputs.jolokia2_agent]]
   ## An array of Kafka servers URI to gather stats.
   urls = ["http://KAFKA_SERVER_IP_ADDRESS:8778/jolokia"]
   name_prefix = "kafka."

   ## List of metrics collected on above servers
   [[inputs.jolokia2_agent.metric]]
     name = "heap_memory_usage"
     mbean  = "java.lang:type=Memory"
     paths = ["HeapMemoryUsage"]

   ## This collects thread counts metrics.
   [[inputs.jolokia2_agent.metric]]
     name = "thread_count"
     mbean  = "java.lang:type=Threading"
     paths = ["TotalStartedThreadCount","ThreadCount","DaemonThreadCount","PeakThreadCount"]

   ## This collects garbage collection metrics.
   [[inputs.jolokia2_agent.metric]]
     name = "garbage_collector"
     mbean  = "java.lang:type=GarbageCollector,name=*"
     paths = ["CollectionCount","CollectionTime"]
     tag_keys = ["name"]

   # Kafka Server Broker Topic Metrics
   [[inputs.jolokia2_agent.metric]]
     name = "server_brokertopics_messagesinpersec"
     mbean  = "kafka.server:type=BrokerTopicMetrics,name=MessagesInPerSec"
   [[inputs.jolokia2_agent.metric]]
     name = "server_brokertopics_bytesinpersec"
     mbean  = "kafka.server:type=BrokerTopicMetrics,name=BytesInPerSec"
   [[inputs.jolokia2_agent.metric]]
     name = "server_brokertopics_bytesoutpersec"
     mbean  = "kafka.server:type=BrokerTopicMetrics,name=BytesOutPerSec"

   # Kafka Server Request Handler Metrics
   [[inputs.jolokia2_agent.metric]]
     name = "server_requesthandler_avgidlepct"
     mbean  = "kafka.server:name=RequestHandlerAvgIdlePercent,type=KafkaRequestHandlerPool"

   # Kafka Server Delayed Operation Purgatory Metrics
   [[inputs.jolokia2_agent.metric]]
     name = "server_delayedoperationpugatory_fetch"
     mbean  = "kafka.server:type=DelayedOperationPurgatory,name=PurgatorySize,delayedOperation=Fetch"
   [[inputs.jolokia2_agent.metric]]
     name = "server_delayedoperationpugatory_produce"
     mbean  = "kafka.server:type=DelayedOperationPurgatory,name=PurgatorySize,delayedOperation=Produce"

   # Kafka Server Replica Fetcher Manager Metrics
   [[inputs.jolokia2_agent.metric]]
     name = "server_replicafetchmanager.maxlag"
     mbean  = "kafka.server:type=ReplicaFetcherManager,name=MaxLag,clientId=Replica"

   # Kafka Server Replica Manager Metrics
   [[inputs.jolokia2_agent.metric]]
     name = "server_replicamanager_underreplicated"
     mbean  = "kafka.server:type=ReplicaManager,name=UnderReplicatedPartitions"
   [[inputs.jolokia2_agent.metric]]
     name = "server_replicamanager_partitioncount"
     mbean  = "kafka.server:type=ReplicaManager,name=PartitionCount"
   [[inputs.jolokia2_agent.metric]]
     name = "server_replicamanager_leadercount"
     mbean  = "kafka.server:type=ReplicaManager,name=LeaderCount"
   [[inputs.jolokia2_agent.metric]]
     name = "server_replicamanager_isrshrinkspersec"
     mbean  = "kafka.server:type=ReplicaManager,name=IsrShrinksPerSec"
   [[inputs.jolokia2_agent.metric]]
     name = "server_replicamanager_isrexpandspersec"
     mbean  = "kafka.server:type=ReplicaManager,name=IsrExpandsPerSec"

   # Kafka Network Request Metrics
   [[inputs.jolokia2_agent.metric]]
     name = "network_requestmetrics_requests_fetch_consumer"
     mbean  = "kafka.network:type=RequestMetrics,name=RequestsPerSec,request=FetchConsumer"
   [[inputs.jolokia2_agent.metric]]
     name = "network_requestmetrics_requests_fetch_follower"
     mbean  = "kafka.network:type=RequestMetrics,name=RequestsPerSec,request=FetchFollower"
   [[inputs.jolokia2_agent.metric]]
     name = "network_requestmetrics_requests_produce"
     mbean  = "kafka.network:type=RequestMetrics,name=RequestsPerSec,request=Produce"
   [[inputs.jolokia2_agent.metric]]
     name = "network_requestmetrics_totaltime_fetch_consumer"
     mbean  = "kafka.network:type=RequestMetrics,name=TotalTimeMs,request=FetchConsumer"
   [[inputs.jolokia2_agent.metric]]
     name = "network_requestmetrics_totaltime_fetch_follower"
     mbean  = "kafka.network:type=RequestMetrics,name=TotalTimeMs,request=FetchFollower"
   [[inputs.jolokia2_agent.metric]]
     name = "network_requestmetrics_totaltime_produce"
     mbean  = "kafka.network:type=RequestMetrics,name=TotalTimeMs,request=Produce"

   # Kafka Network Processor Metrics
   [[inputs.jolokia2_agent.metric]]
     name = "network_processor_avgidlepct"
     mbean  = "kafka.network:name=NetworkProcessorAvgIdlePercent,type=SocketServer"

   # Kafka Controller Metrics
   [[inputs.jolokia2_agent.metric]]
     name = "controller_activecontrollers"
     mbean  = "kafka.controller:type=KafkaController,name=ActiveControllerCount"
   [[inputs.jolokia2_agent.metric]]
     name = "controller_offlinepartitions"
     mbean  = "kafka.controller:type=KafkaController,name=OfflinePartitionsCount"
   [[inputs.jolokia2_agent.metric]]
     name = "controller_stats_leaderelectionrateandtime"
     mbean  = "kafka.controller:type=ControllerStats,name=LeaderElectionRateAndTimeMs"
   [[inputs.jolokia2_agent.metric]]
     name = "controller_stats_uncleanleaderelections"
     mbean  = "kafka.controller:type=ControllerStats,name=UncleanLeaderElectionsPerSec"

   # Zookeeper Metrics
   [[inputs.jolokia2_agent.metric]]
     name = "zookeeper_disconnects"
     mbean  = "kafka.server:type=SessionExpireListener,name=ZooKeeperDisconnectsPerSec"
     paths = ["Count","OneMinuteRate","FiveMinuteRate","FifteenMinuteRate","MeanRate"]
   [[inputs.jolokia2_agent.metric]]
     name = "zookeeper_sync_connects"
     mbean  = "kafka.server:type=SessionExpireListener,name=ZooKeeperSyncConnectsPerSec"
     paths = ["Count","OneMinuteRate","FiveMinuteRate","FifteenMinuteRate","MeanRate"]
   [[inputs.jolokia2_agent.metric]]
     name = "zookeeper_auth_failures"
     mbean  = "kafka.server:type=SessionExpireListener,name=ZooKeeperAuthFailuresPerSec"
     paths = ["Count","OneMinuteRate","FiveMinuteRate","FifteenMinuteRate","MeanRate"]
   [[inputs.jolokia2_agent.metric]]
     name = "zookeeper_readonly_connects"
     mbean  = "kafka.server:type=SessionExpireListener,name=ZooKeeperReadOnlyConnectsPerSec"
     paths = ["Count","OneMinuteRate","FiveMinuteRate","FifteenMinuteRate","MeanRate"]
   [[inputs.jolokia2_agent.metric]]
     name = "zookeeper_authentications"
     mbean  = "kafka.server:type=SessionExpireListener,name=ZooKeeperSaslAuthenticationsPerSec"
     paths = ["Count","OneMinuteRate","FiveMinuteRate","FifteenMinuteRate","MeanRate"]
   [[inputs.jolokia2_agent.metric]]
     name = "zookeeper_expires"
     mbean  = "kafka.server:type=SessionExpireListener,name=ZooKeeperExpiresPerSec"
     paths = ["Count","OneMinuteRate","FiveMinuteRate","FifteenMinuteRate","MeanRate"]
Extend the above metrics for all the JMX metrics to have a complete view of Apache Kafka. You can refer to the Apache Kafka documentation for JMX endpoints and metrics.
4. Configure Azure Monitor Output Plugin
[[outputs.azure_monitor]]
  ## Timeout for HTTP writes.
  # timeout = "20s"

  ## Set the namespace prefix, defaults to "Telegraf/<input-name>".
   namespace_prefix = "kafka/"

  ## Azure Monitor doesn't have a string value type, so convert string
  ## fields to dimensions (a.k.a. tags) if enabled. Azure Monitor allows
  ## a maximum of 10 dimensions so Telegraf will only send the first 10
  ## alphanumeric dimensions.
  # strings_as_dimensions = false

  ## Both region and resource_id must be set or be available via the
  ## Instance Metadata service on Azure Virtual Machines.
  #
  ## Azure Region to publish metrics against.
  ##   ex: region = "southcentralus"
  # region = ""
  #
  ## The Azure Resource ID against which metric will be logged, e.g.
  ##   ex: resource_id = "/subscriptions/<subscription_id>/resourceGroups/<resource_group>/providers/Microsoft.Compute/virtualMachines/<vm_name>"
  # resource_id = ""

  ## Optionally, if in Azure US Government, China, or other sovereign
  ## cloud environment, set the appropriate REST endpoint for receiving
  ## metrics. (Note: region may be  unused in this context)
  # endpoint_url = "https://monitoring.core.usgovcloudapi.net"
5. Restart Telegraf
Execute sudo service telegraf restart to restart the Telegraf agent.
6. Create Service Principal/Azure Managed Identity
To connect Azure Monitor from Grafana, we need to have managed identity enabled on the Grafana installed VM, use the managed identity to configure Azure Monitor in Grafana. This will simplify the data source configuration, requiring the data source to be securely authenticated without having to manually configure credentials via Azure AD App Registrations for each data source.
You can also create an app registration and service principal in Azure AD to authenticate the data source and configure the service principal in Grafana configuration. Make sure you provide the either Contributor role/ Viewer role to the service principal.
7. Install Grafana
Refer here for the various option to install Grafana on supported operating systems. Grafana is available as OSS or Enterprise Edition, choose based on your need.
8. Configure Azure Monitor as Datasource in Grafana
To enable managed identity for Grafana, set the managed_identity_enabled flag in the [azure] section of the Grafana server config.
[azure]
    managed_identity_enabled = true
Then, in the Azure Monitor data source configuration, set Authentication to Managed Identity. The data source will use managed identity for authenticating to Azure Monitor Metrics, Logs, and Azure Resource Graph. Refer to this document for the data source configuration either using the managed identity or using service principal.
9. Restart the Grafana
Restart the Grafana server after the configuration and now you should be able to access the Grafana UI. You can also restrict Grafana access to a set of users by integrating Grafana with Azure AD. You can refer to the documentation here.
10. Create a Monitoring Dashboard for Key Kafka Metrics
Create the Key metrics dashboards in Grafana like CPU Usage, JVM Usage, Time Spent in GC, Message In Per Topic, Consumer lag, etc.
Note: We can also use the above-mentioned solution in other cloud providers like AWS and GCP if you want to set up Apache Kafka Cluster on AWS or GCP. The Telegraf agent has output plugin support for AWS CloudWatch and GCP Cloud Monitoring ( formerly known as Stackdriver). So using this plugin, you can store the metrics data in native monitoring solutions provided by public cloud provides and use Grafana, which has native support for both GCP and AWS monitoring solutions.
Opinions expressed by DZone contributors are their own.
Comments