Monitoring Spring Boot Applications with Prometheus and Grafana
Demonstrates how to expose Spring Boot metrics with Prometheus and build Grafana dashboards to track memory usage and error rates for production-grade Java services.
Join the DZone community and get the full member experience.
Join For FreeMonitoring Spring Boot Applications with Prometheus and Grafana
Spring Boot’s Actuator and Micrometer provide rich metrics that can be scraped by Prometheus and visualized in Grafana. This guide covers configuring a Spring Boot application to expose Prometheus-formatted metrics, writing custom metrics, and setting up Prometheus and Grafana for monitoring.
We cover installing Prometheus, writing a configuration to scrape your application, importing Grafana dashboards, and crafting PromQL queries and alerting rules. We also discuss Prometheus best practices, including metric naming conventions, label cardinality, and retention settings. Security considerations, troubleshooting tips, and the performance impact of metrics collection are also included.
The diagram below illustrates a typical monitoring architecture.
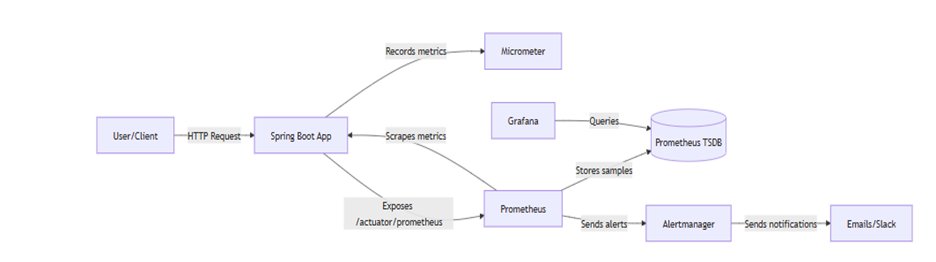
Figure: Data flow for Spring Boot monitoring. Prometheus scrapes metrics from the Spring Boot /actuator/prometheus endpoint and stores time-series data. Grafana queries Prometheus for visualization, while Alertmanager handles notifications.
Spring Boot Actuator and Micrometer Setup
Spring Boot auto-configures Micrometer when the micrometer-registry-prometheus dependency is on the classpath.
Include these dependencies in your build:
Maven (pom.xml)
<dependency>

  <groupId>org.springframework.boot</groupId>

  <artifactId>spring-boot-starter-actuator</artifactId>

</dependency>

<dependency>

  <groupId>io.micrometer</groupId>

  <artifactId>micrometer-registry-prometheus</artifactId>

</dependency>
Gradle (build.gradle)
implementation 'org.springframework.boot:spring-boot-starter-actuator'
implementation 'io.micrometer:micrometer-registry-prometheus'
These enable Actuator and the Prometheus registry.
Next, configure Actuator to expose the Prometheus endpoint. By default, only the health endpoint is exposed. To enable others:
Properties
management.endpoint.prometheus.enabled=true
management.endpoints.web.exposure.include=prometheus
The first property enables the /actuator/prometheus endpoint; the second exposes it over HTTP.
Be cautious: exposing all endpoints can leak sensitive information. For production:
Properties
management.endpoints.web.exposure.include=health,prometheus
management.endpoints.web.exposure.exclude=env,beans
Also secure /actuator via Spring Security or network ACLs.
Verify metrics by visiting:
http://<host>:<port>/actuator/prometheusYou should see Prometheus-formatted output like:
jvm_memory_used_bytes{area="heap",id="PS Eden Space"} 1.2345E7 http_server_requests_seconds_count{exception="None",method="GET",status="200",uri="/hello"} 42.0These include JVM and HTTP metrics.
Sample Spring Boot Metrics Code
Below is a simple Spring Boot application with a REST endpoint and custom Micrometer metrics:
@SpringBootApplication

public class DemoApplication {

    public static void main(String[] args) {

         SpringApplication.run(DemoApplication.class, args);

    }

}


@RestController

public class HelloController {


    private final Counter helloCounter;


    public HelloController(MeterRegistry registry) {

        // Define a custom counter with tags

        this.helloCounter = Counter.builder("custom_hello_requests_total")

             .description("Total number of /hello requests")

            .tags("env", "demo")

             .register(registry);

    }


    @GetMapping("/hello")

    public String hello() {

        // Increment counter on each request

         helloCounter.increment();

        return "Hello from Spring Boot!";

    }

}
Micrometer automatically exposes these metrics, along with built-in ones like jvm_memory_* and http_server_requests_*.
Prometheus Setup
Installing Prometheus
- Native: Download from the official site, extract, and run
./prometheus(default port: 9090). - Docker: Bash
docker pull prom/prometheus

docker run --name prometheus -d -p 9090:9090 prom/Prometheus
To use a custom configuration: Bash
docker run --name prometheus -d -p 9090:9090 \
  -v /path/to/prometheus.yml:/etc/prometheus/prometheus.yml \
  prom/prometheus
prometheus.yml Configuration
global:
  scrape_interval: 15s

scrape_configs:
  - job_name: 'springboot-app'
    metrics_path: '/actuator/prometheus'
    scrape_interval: 15s
    static_configs:
      - targets: ['localhost:8080']
In this example Prometheus scrapes the /actuator/prometheus endpoint on localhost:8080 every 15 seconds. Adjust targets for your actual hostnames/IPs. For containerized or Kubernetes environments Prometheus can use service discovery.
Grafana Setup
Grafana reads data from Prometheus and renders dashboards.
- Install Grafana: Download from grafana.com and run
- Add Prometheus Data Source: In Grafana UI go to Configuration -Data Sources-Add data source, choose Prometheus and set URL to http://localhost:9090 . Click Save & Test to confirm connection.
- Import a Dashboard: Grafana can import community dashboards. For Spring Boot, use the Spring Boot Statistics dashboard. In Grafana, go Dashboards- Import then paste the dashboard ID or JSON. The steps are click Dashboards – Import upload JSON or paste URL/ID. Choose your Prometheus data source when prompted.
- Create Custom Panels: we can also build your own dashboards. Common panels are
JVM memory: jvm_memory_used_bytes{area="heap"} / jvm_memory_max_bytes{area="heap"}
Threads: jvm_threads_live
GC Activity: rate(jvm_gc_pause_seconds)
Metric Naming and Label Best Practices
Prometheus and Micrometer follow a naming convention to ensure clarity. Metric names should:
- Use
snake_casedescribe one thing, and include a suffix for units. For example,http_request_duration_seconds,process_cpu_seconds_total,data_pipeline_last_record_processed_timestamp_seconds. - Include an application or domain prefix when useful though commonly used metrics (like JVM or process metrics) often lack a custom prefix.
Prometheus and Grafana Best Practices
- Cardinality: Reduce label explosion. For example avoid including full URLs with query strings or user specific labels on metrics. Keep label sets small and enumerable.
- Retention: Prometheus by default retains 15 days of data. You can change with flags: e.g.
storage.tsdb.retention.time=30d. Alternatively usestorage.tsdb.retention.sizeto cap disk usage.
Security Considerations
- Protect Actuator: Never expose
/actuator/prometheusor other management endpoints to the public internet without security. Restrict to a monitoring subnet or secure with Spring Security - HTTPS: Use TLS for Grafana and Prometheus web UIs if reachable over the network. For example run Grafana behind an HTTPS proxy or enable its built in TLS support.
- Authentication: Enable authentication on Grafana. For Prometheus you may run it behind an authenticated proxy or use basic auth
- Network: Consider placing monitoring tools in a VPN or private network segment. Do not open 9090/3000 publicly
- Alerting secrets: In Alertmanager configs, protect credentials.
Performance Implications
Instrumenting with micrometer has minimal overhead on the application side. Prometheus scraping and storage is where costs accrue
Summary of Key Information
- Dependencies & Config-Add spring boot starter actuator and micrometer registry prometheus enable management endpoint prometheus and expose it.
- Prometheus setup run prometheus and configure
prometheus.ymlto scrape your app at/actuator/prometheus - Grafana dashboards-Add Prometheus as a data source. Import or create dashboards
- Metric naming: Use descriptive names with units avoid redundant labels and avoid high cardinality labels.
- Metric types: Counters, Gauges, Histograms/Summaries. Prefer histograms for cluster quantiles.
- Alerts: Define Prometheus alerting rules for conditions like instance down or high error rate. Example expressions:
rate(http_server_requests_seconds_count{status=~"5.."}[5m])
Conclusion
By combining Spring Boot Actuator, Micrometer with Prometheus and Grafana. We will gain end to end monitoring of your Java applications. You expose rich application metrics via the /actuator/prometheus endpoint configure Prometheus to scrape them and build Grafana dashboards to visualize system health. This setup supports alerting so you can be notified of issues like high error rates or downtime. Careful attention to metric naming label cardinality and data retention ensures scalable high performance monitoring. Following best practices and using community dashboards will help your monitoring solution be effective and maintainable.
Opinions expressed by DZone contributors are their own.
Comments