Mule Integration With External Analytics Applications
A well-designed logging mechanism facilitates debugging, monitoring, reporting, and analytics. Learn how to integrate Mule with an external analytics app.
Join the DZone community and get the full member experience.
Join For FreeAs a MuleSoft Certified Architect, Designer and Developer, I recently worked on API implementations for one of our clients using MuleSoft’s CloudHub. One common feature that we use across APIs implementations is to have a well-designed logging mechanism.
Logging is a fundamental part of any applications. A well-designed logging mechanism for an application is a huge utility for debugging, monitoring, reporting and for many other analytics purposes.
Mule, by default, logs multiple messages like payloads, exceptions, and all other specific elements which we define using the logger component in our APIs. For logging, Mule uses the slf4j (Simple Logging Facade for Java) logging API to get the logging configurations like what messages to log, where to log, and the way messages will be logged (asynchronously or synchronously) from log4j2.xml.
The Mule server, by default, has a log4j2.xml in its conf directory, which controls the logging for all the APIs deployed on that server. Logging can be controlled at both the domain level and at an API level (by keeping log4j2.xml in the API project folder at src/main/resources). When an API is deployed, Mule will look for a log4j2.xml file in a child-first pattern (first at the API level), secondly at the Domain level, and lastly, the server level (default log4j2.xml under the server’s conf folder).
Mule’s default logging mechanism store logs on the server’s local file system for a limited period of time. Storing logs on server’s local file system may cause space issue which can be fixed by customizing the log4j2.xml file to keep application logs at any FTP, NTFS locations, or in database management systems. But again, easy access to logs and analytics become a problem to fetch the log form files or database tables.
The enterprise wants application logs to be stored for a longer period, and they also need an easy UI-based application for accessing the logs, searching logs with different criteria like date and time range, keywords, etc, and generating analytic reports as per their need.
In this article, we will see how we can store Mule APIs logs to external analytics application like Splunk which provide long-term data storage, UI interface for log search, and other analytics features.
Mule Instance Running On-Premise
Using Splunk Forwarder
We can use Splunk forwarders, which provide reliable, secure data collection from remote sources, and forward that data into Splunk software for indexing and consolidation. We can install the Splunk Forwarder on the same JVM where the Mule instance is running and point this Splunk forwarder to read from the Mule JVM log file to send the data to the Splunk indexer. This approach will send all the data from the Mule log file to the Splunk instance, however, this can impact the Mule instance performance, as the forwarder needs to be installed on the same JVM on which the Mule instance is running.
Customizing log4j2.xml
We can customize the log4j2.xml file by defining a socket appender with the host and port of the Splunk server and point it to the desired log4j AsyncLogger to send all the logs related to that AsyncLogger.
As we can see in the below code snippet, we defined a log4j socket appender named “Socket” with the Splunk server host and IP and using it with the AsyncLogger named splunk.logger. With this configuration, all the Mule API logs with category splunk.logger will be sent to the Splunk instance.
<Appenders>
<Socket name="socket" host="<Splunk server host>" port="<Splunk server IP>">
 <PatternLayout pattern="%p: %m^[END}" charset="UTF-8"/>
</Socket>
</Appenders>
<AsyncLogger name="splunk.logger" level="info">
<AppenderRef ref="socket"/>
</AsyncLogger>
In the Mule flow or in Anypoint Platform custom policies, we can define the API's log category as splunk.logger as mentioned below to send the log to Splunk using the log4j2.xml file defined above.
<logger message="#[message.payloadAs(java.lang.String)]}" level="INFO" category="splunk.logger" doc:name="LogIncomingRequest"/>

<mule:logger level="INFO" message="Payload=#[flowVars['maskedPayload']]" category="splunk.logger"/>
Mule Instance Running in CloudHub
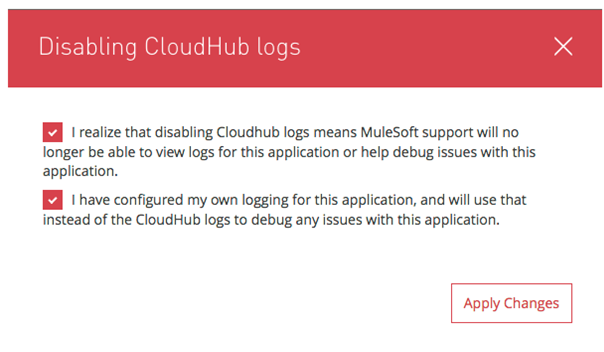
We can also customize the log4j2.xml file placed in the Mule API project under the src/main/resources folder and make it effective in CloudHub by disabling Mule CloudHub logs from Anypoint Platform runtime manager (see the below screen for details).
Disabling the CloudHub logs feature requires approval from MuleSoft, as MuleSoft will not be responsible for any issues with the logging once our custom log4j2.xml file starts working.
The best approach is to customize the log4j2.xml file with a socket and map it to both Splunk logging as well as default CloudHub logging. See the below code snippet for the configuration.
We have defined one socket appender named “SPLUNK” with the Splunk server host and port and one appender named "CLOUDHUB" to keep the log available in the runtime manager Mule CloudHub console as well. Both the appenders are mapped to an AsyncLogger named splunk.logger.
<Appenders>
        <RollingFile name="FILE"
                     fileName="/opt/mule/mule-CURRENT/logs/mule-${sys:domain}.log"
                     filePattern="/opt/mule/mule-CURRENT/logs/mule-${sys:domain}-%i.log">
            <PatternLayout pattern="[%d{MM-dd HH:mm:ss.SSS}] %-5p %c{1} [%t]: %m%n"/>
            <DefaultRolloverStrategy max="10"/>
            <Policies>
                <SizeBasedTriggeringPolicy size="10 MB" />
            </Policies>
        </RollingFile>
        <Log4J2CloudhubLogAppender name="CLOUDHUB"
                                   addressProvider="com.mulesoft.ch.logging.DefaultAggregatorAddressProvider"
                                   applicationContext="com.mulesoft.ch.logging.DefaultApplicationContext"
                                   appendRetryIntervalMs="${sys:logging.appendRetryInterval}"
                                   appendMaxAttempts="${sys:logging.appendMaxAttempts}"
                                   batchSendIntervalMs="${sys:logging.batchSendInterval}"
                                   batchMaxRecords="${sys:logging.batchMaxRecords}"
                                   memBufferMaxSize="${sys:logging.memBufferMaxSize}"
                                   journalMaxWriteBatchSize="${sys:logging.journalMaxBatchSize}"
                                   journalMaxFileSize="${sys:logging.journalMaxFileSize}"
                                   clientMaxPacketSize="${sys:logging.clientMaxPacketSize}"
                                   clientConnectTimeoutMs="${sys:logging.clientConnectTimeout}"
                                   clientSocketTimeoutMs="${sys:logging.clientSocketTimeout}"
                                   serverAddressPollIntervalMs="${sys:logging.serverAddressPollInterval}"
                                   serverHeartbeatSendIntervalMs="${sys:logging.serverHeartbeatSendIntervalMs}"
                                   statisticsPrintIntervalMs="${sys:logging.statisticsPrintIntervalMs}">
            <PatternLayout pattern="[%d{MM-dd HH:mm:ss}] %-5p %c{1} [%t] CUSTOM: %m%n"/>
        </Log4J2CloudhubLogAppender>
         <Socket name="SPLUNK" host="<splunk host>" port="<splunk port>">
               <PatternLayout pattern="%p: %m^[END}" charset="UTF-8"/>
       </Socket>
    </Appenders>
    <Loggers>
        <Root level="INFO">
            <AppenderRef ref="FILE"/>
            <AppenderRef ref="CLOUDHUB"/>
        </Root>
        <Logger name="com.gigaspaces" level="ERROR"/>
        <Logger name="com.j_spaces" level="ERROR"/>
        <Logger name="com.sun.jini" level="ERROR"/>
        <Logger name="net.jini" level="ERROR"/>
        <Logger name="org.apache" level="WARN"/>
        <Logger name="org.apache.cxf" level="WARN"/>
        <Logger name="org.springframework.beans.factory" level="WARN"/>
        <Logger name="org.mule" level="INFO"/>
       <Logger name="com.mulesoft" level="INFO"/>
        <Logger name="org.jetel" level="WARN"/>
        <Logger name="Tracking" level="WARN"/>
         <AsyncLogger name="splunk.logger" level="INFO" >
          <AppenderRef ref="SPLUNK" />
          <AppenderRef ref="CLOUDHUB"/>
        </AsyncLogger>
    </Loggers>
Once the API is deployed, we can disable the default CloudHub logging in the runtime manager screen to make this custom log42.xml file effective. See the below screens for details.

Let’s share our knowledge to expand our MuleSoft community.
Thank you!
Opinions expressed by DZone contributors are their own.
Comments