Analyzer WebDriver - NFR Automation Through Selenium
Analyze a Web Application through selenium automation, to achieve complete testing with a Shift-Left mindset.
Join the DZone community and get the full member experience.
Join For FreeToday's digital world demands more from all of us. The reality is that manual processes can't sustain a successful website. And without proper visibility into every aspect of your digital presence, errors slip through the cracks, prioritization is impossible, and measuring success is an uphill battle.
We need a foundation for us to improve our website every day.
Apart from functional changes we need to enhance content quality, work towards accessibility compliance, drive search engine traffic, meet data privacy requirements, and measure website performance and ROI.
In this below article, we will see how we could measure the NFR side of our application through functional automation with Lighthouse.
Lighthouse
Built by Google, Lighthouse is an open-source auditing tool for developers. It works over the chrome-dev-tools and runs a series of audits to measure the web application under test on the following
- Performance
- Accessibility
- SEO
- Best-Practices
- PWA (Progressive Web Application)
The Hinge
Lighthouse works as a Chrome/Firefox add-ons or in a CLI mode or as a node application. The hinge here is the "lighthouse launches its very own chrome-debug to test the application".
The question is "How do I control the browser been launched by the lighthouse with Selenium?"
Merging Selenium With Lighthouse
To create a solution out of this, one needs some fundamental understanding of how lighthouse works.
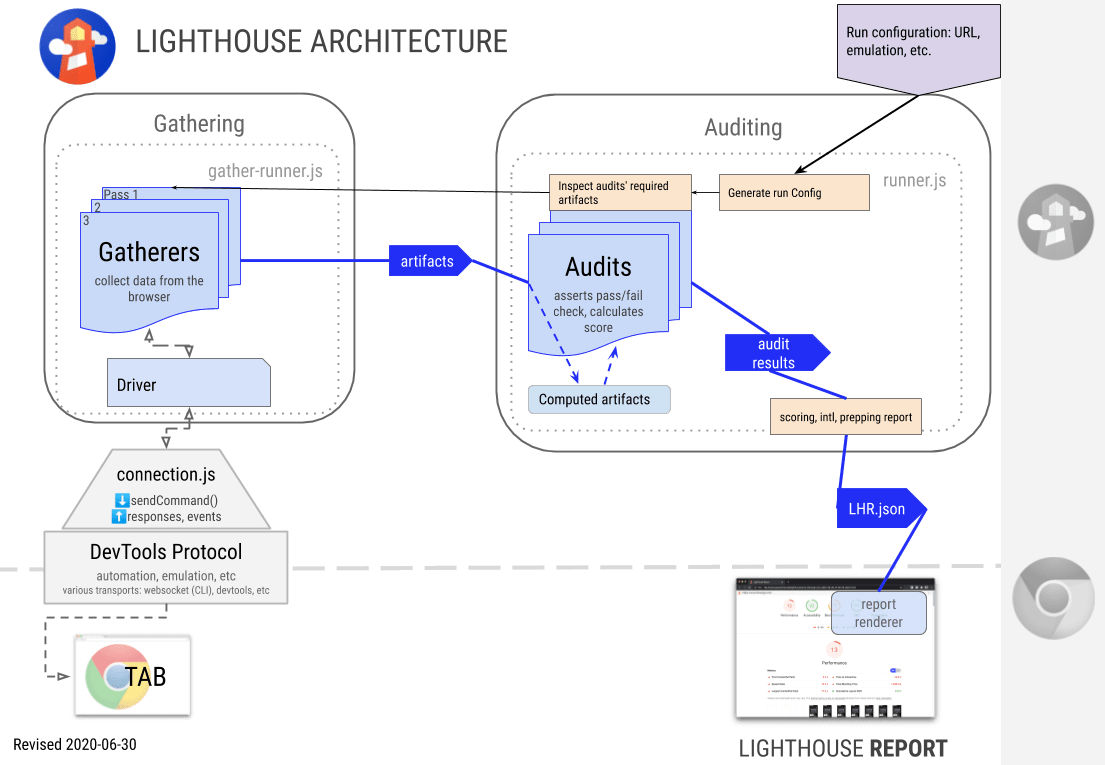
As could be seen from the diagram, the chrome dev-tools protocol enables us to run the audits, hence we understand the need for chrome debugs here. The later part of converting the audits into meaningful reporting by comparing the standards are done by the lighthouse itself.
So the bottom line is we need to do the following
- Launch Chrome-debug on the command line with specific port enabled.
- Attach the Selenium WebDriver on the specified port.
- Run Lighthouse on CLI to your driver URL.
Let's Code
As part of the pre-requisite, ensure the following are installed
- Node JS.
- npm, install -g lighthouse (Install Lighthouse as a node).
Launching Chrome-debug
chrome-debug --port=9222
Ensure using process builder we open a chrome-debug instance on the allowed port.
Attach Selenium WebDriver
xxxxxxxxxx
ChromeOptions options = new ChromeOptions();
options.setExperimentalOption("debuggerAddress", "127.0.0.1:9222");
driver = new ChromeDriver(options);
driver.manage().window().maximize();
driver.get("https://www.google.co.in/");
Run Lighthouse on the desired URL
x
lighthouse https://www.google.co.in/ --port=9222 --emulated-form-factor=desktop --output=html --output-path=./GoogleHome.html
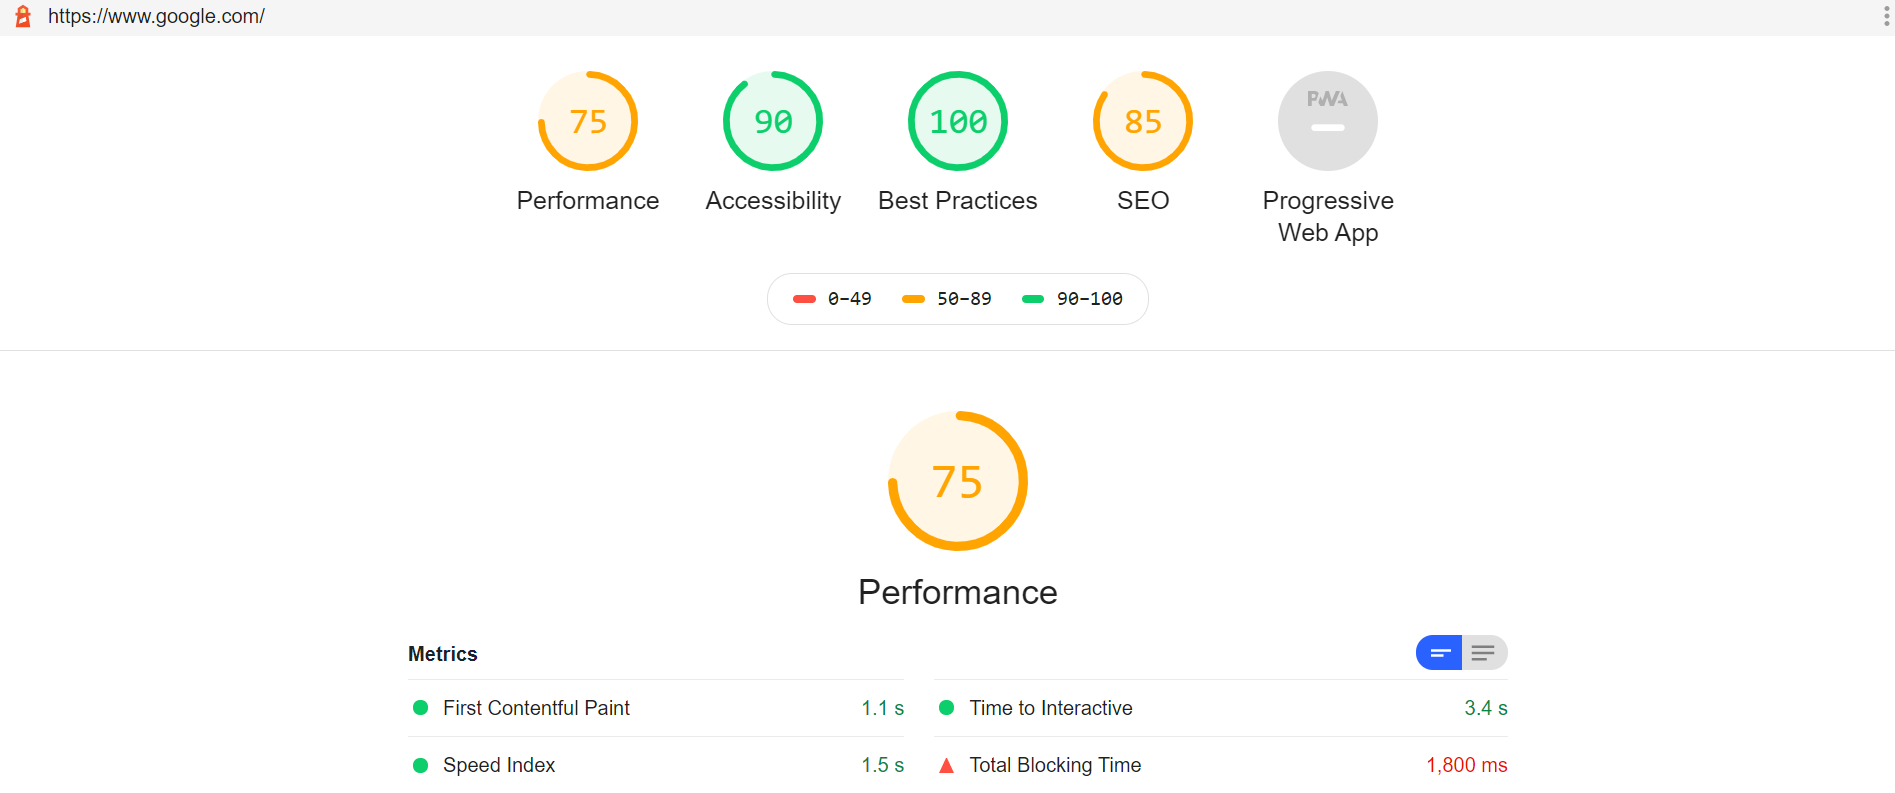
View Analyzed Page Reports
One could get the analyzed report as shown below
Summary
Create your own fully automated website checks, performance metrics, industry benchmarks, and automated reporting through functional automation scripts. Shift-Left with Quality Intelligence.
Opinions expressed by DZone contributors are their own.
Comments