

OpenSearch Heap Sizing: Swap, Page Cache, and the 50% Rule
The story has two parts. In Act 1, we trace elevated latency back to a JVM heap, showing how anonymous memory can still end up in swap even with vm.swappiness=1.
Join the DZone community and get the full member experience.
Join For FreeOpenSearch is an open-source, distributed search and analytics suite derived as a fork of Elasticsearch and maintained under the Apache 2.0 license. When it comes to memory configuration, the guidance is often reduced to a few rules of thumb: swapoff -a, vm.swappiness=1, or bootstrap.memory_lock, and allocating 50% of available memory to the JVM heap while leaving the rest for Lucene and the filesystem page cache, OpenSearch off-heap caches, network buffers, and other system needs.
These recommendations are repeated throughout documentation, blog posts, and operational guides, yet their origins and the mechanisms that justify these specific values are rarely examined. Undoubtedly, they provide a reasonable and safe starting point or a safe upper bound in most of the cases, but a safe default is not necessarily an optimal configuration.
All of this raises even more questions. How do these defaults affect cluster performance? What is the optimal JVM heap ratio? Does memory given up by the JVM actually become filesystem page cache, and at what point does that trade-off stop paying off? How do read/write latency correlate with the heap ratio?
These questions become particularly important in resource-constrained environments and in the cloud, where long-term contracts may make existing instances significantly cheaper, making horizontal or vertical scaling a difficult decision.
In this article, we'll try to answer these questions through benchmarking. This is Act 1 of a two-act series. Act 1 focuses on identifying the cause of the latency problems we observed with the current defaults. Act 2 will explore what other heap-ratio values might look like for read/write loads.
Along the way, I'll share the tools and commands used throughout the investigation, making this article a practical reference as well for you and for myself when I inevitably need to retrace the investigation months later.
Knowledge Context
The story also crosses several boundaries, such as the Kernel VM, the JVM, and Lucene. So, it’s important to outline the concepts mentioned in this part of the article beforehand, both for the context and, optionally, to enrich the AI context if you'd like to summarize everything.
| Area | Where memory lives | Why it matters here |
|---|---|---|
| Linux page cache | File-backed RAM | Lucene relies heavily on it for index data; under memory pressure, these pages can be reclaimed and read again later. |
| Linux swap | Disk-backed anonymous memory | Anonymous process memory can be swapped out under pressure. vm.swappiness influences this decision but does not prohibit it. |
| Linux PSI | Kernel pressure signal | Shows time tasks spend stalled due to CPU, memory, or I/O pressure. We'll use I/O PSI while investigating latency. |
| JVM heap | Anonymous memory | Controlled by Xms/Xmx; contains Java objects and several OpenSearch data structures. |
| JVM native memory | Anonymous/file-backed memory outside Xmx |
Includes code cache, metaspace, stacks, direct buffers, and native allocations. Heap metrics do not account for all of it. |
| OpenSearch caches | Heap/off-heap, depending on cache | Their sizes may depend on heap size, which becomes important when we change jvm_heap_ratio. |
| OpenSearch indexing buffer | Heap | Its size depends on heap and therefore becomes an important variable in Act 2. |
| Lucene mmap | File-backed/page cache | Lucene index files mapped into the process do not consume JVM heap; resident pages compete for physical RAM. |
Environment
I used Aiven for OpenSearch on Azure, with cluster metrics exported to Thanos. The OpenSearch Benchmark metrics don't provide everything we need to answer our questions, particularly host-level metrics such as Linux PSI and swap activity. Exporting the cluster metrics to Thanos allows us to use PromQL queries later to retrieve the additional metrics needed for the investigation.
The cluster consists of 3 nodes:
| CPU | AMD EPYC 7763v (Milan) |
| vCPU / RAM | 2 vCPU, 8 GiB |
| Disk Size | 175 GiB per node |
| Azure Region | azure-westeurope |
| Azure Disk | PremiumV2_LRS |
| Azure SKU | Standard_D2as_v5 |
| OpenSearch Version | 3.6.0 |
| JDK | java-21-openjdk-headless |
| GC | G1GC |
Act 1. The Latency and an Extra GB
The symptom: elevated query latency across the cluster, first reported by the customer after a kernel and Azure image upgrade. The load pattern on OpenSearch itself remained unchanged, as did the cluster configuration and settings.
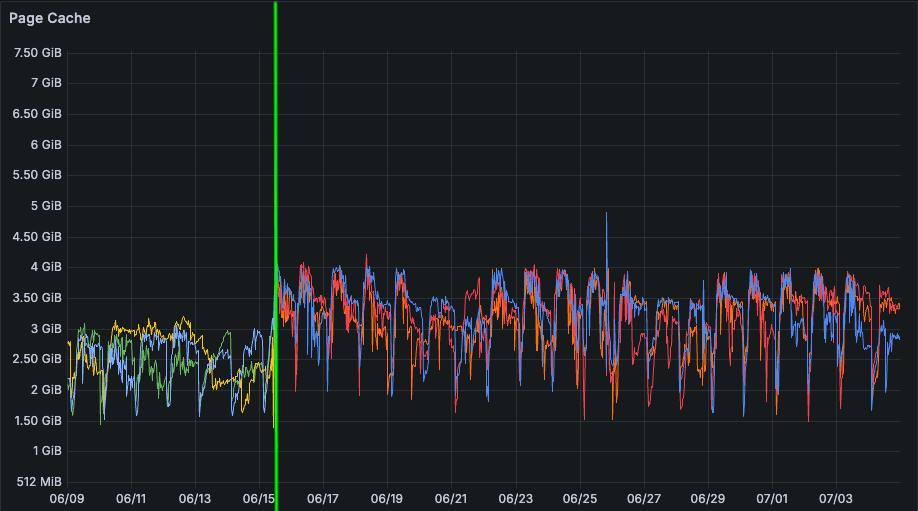
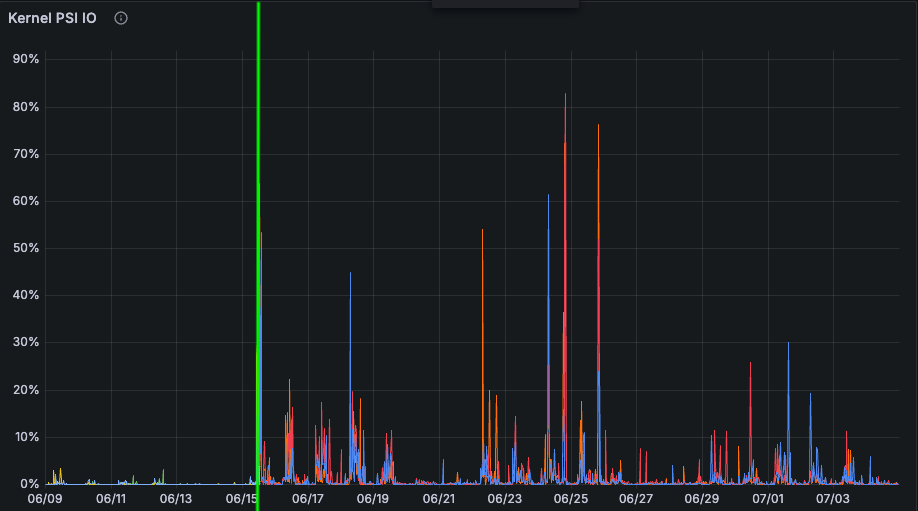
The monitoring panels give us the first clue. In the screenshots below, the green vertical line marks the moment of the upgrade. After that point, the page cache grows by roughly a gigabyte, while I/O PSI, previously close to zero, starts showing significant spikes. Nothing crashed, no alert fired, and from the JVM point of view everything looked normal.
So where did that extra gigabyte of page cache come from?
Nothing was actually freed. It moved. The interesting part isn't just that memory went to swap; it's which memory.
When you have thousands of running clusters, there is always a small fraction of them operating close to the edge: relatively stable, yet sensitive enough that even a small change can noticeably affect performance. Like a star nearing the end of its lifetime, they may look stable right up until something disturbs the balance.
The immediate cause of the page-cache change was identified fairly quickly: Azure applies tuning parameters that differ from the Linux kernel defaults, and those parameters were not applied by the older image. Once applied, the larger buffers and read_ahead increased the filesystem cache footprint, putting additional pressure on anonymous memory and eventually pushing some of it to swap. But rather than stopping there, let's use this incident as an opportunity to experiment with the heap ratio and make the behavior of OpenSearch instances explicit and less dependent on such environmental changes.
Evidence
It Is on Swap; None of It Locked
First, find what is going on on a node itself:
PID=$(pgrep -f 'org.opensearch.bootstrap.OpenSearch')
grep -E 'VmRSS|RssAnon|RssFile|RssShmem|VmSwap|VmLck' /proc/$PID/statusVmRSS: 4366408 kB # resident
RssAnon: 3329896 kB # heap + anonymous native
RssFile: 1036496 kB # resident mmap'd Lucene pages
RssShmem: 16 kB
VmSwap: 2679496 kB # on swap
VmLck: 0 kB # bootstrap.memory_lock=fasle, none lockedgrep -E 'MemFree|MemAvailable|Cached|SwapFree' /proc/meminfoMemFree: 258216 kB
MemAvailable: 3479264 kB
Cached: 3403196 kB
SwapCached: 854396 kB
SwapFree: 4745444 kBThe Swap Device Is dm-crypt
Then confirm there is somewhere for it to go, and on what kind of device:
swapon --showNAME TYPE SIZE USED PRIO
/dev/dm-4 partition 8G 3.5G -1The dm-* swap device is the interesting detail to catch and to keep in mind. This is an encrypted device, so once a page is requested it could drive more I/O -> more dm-crypt allocations -> more high-order pressure. A self-reinforcing loop and a good example of read amplification.
Paging Is Live, Not Historical
The next logical step is to check whether it is live paging or just a stale historical tail.
The vmstat 1 5 the Linux Virtual Memory Statistics Tool should give us an exact answer for this, where non-zero swap blocks in and out (marked as si, so):
vmstat 1 5procs -----------memory---------- ---swap-- -----io---- -system-- -------cpu-------
r b swpd free buff cache si so bi bo in cs us sy id wa st gu
1 0 3620928 159716 5864 3704212 113 80 3361 577 3147 12 8 7 84 1 0 0
0 0 3625240 189036 5860 3705260 0 5228 24268 5228 4841 4072 14 12 69 4 0 0
0 0 3625240 166196 5860 3710696 0 0 32 0 3572 2556 21 5 74 0 0 0
0 0 3625240 162668 5860 3716200 8 0 164 0 3729 2619 20 7 73 0 0 0
12 0 3625312 147692 5860 3724288 0 140 9207 524 3679 4024 22 14 63 1 0 0Non-zero si/so in 4 of 5 samples show the live paging process, swpd also climbing across five seconds, which is good proof.
The Swapped Pages Are Anonymous, Not File-Backed
Let's also check swap memory consumption for each of the process's mappings, to confirm that swap is heap-related:
PID=$(pgrep -f org.opensearch.bootstrap.OpenSearch)
awk '/^[0-9a-f]/{h=$0} /^Swap:/{if($2>0)print $2" kB "h}' /proc/$PID/smaps | sort -rn | head -201160380 kB 708400000-7ffe00000 rw-p 00000000 00:00 0
62296 kB 7f30c0000000-7f30c3f4b000 rw-p 00000000 00:00 0
61452 kB 7f1fc8000000-7f1fcbc03000 rw-p 00000000 00:00 0
61448 kB 7f1fa8000000-7f1fabc02000 rw-p 00000000 00:00 0
61444 kB 7f2f38000000-7f2f3bc01000 rw-p 00000000 00:00 0
61444 kB 7f24b4000000-7f24b7c01000 rw-p 00000000 00:00 0
61444 kB 7f22ac000000-7f22afc01000 rw-p 00000000 00:00 0
61444 kB 7f2238000000-7f223bc01000 rw-p 00000000 00:00 0
61444 kB 7f216c000000-7f216fc01000 rw-p 00000000 00:00 0
61444 kB 7f2168000000-7f216bc01000 rw-p 00000000 00:00 0
61444 kB 7f2148000000-7f214bc01000 rw-p 00000000 00:00 0
61444 kB 7f1fec000000-7f1fefc01000 rw-p 00000000 00:00 0
61444 kB 7f1fe8000000-7f1febc01000 rw-p 00000000 00:00 0
61444 kB 7f1fcc000000-7f1fcfc01000 rw-p 00000000 00:00 0
61444 kB 7f1fac000000-7f1fafc01000 rw-p 00000000 00:00 0
60772 kB 7f1fc0000000-7f1fc3c14000 rw-p 00000000 00:00 0
59952 kB 7f311e000000-7f3123f41000 rw-p 00000000 00:00 0
59340 kB 7f30b4000000-7f30b7c9b000 rw-p 00000000 00:00 0
57180 kB 7f3110000000-7f3113e3e000 rw-p 00000000 00:00 0
43084 kB 7f3130800000-7f3133d70000 rwxp 00000000 00:00 0The Largest Swapped Region Is
But why is what we are seeing above a heap-related area?
There are a few clues for that. The region size 0x708400000 - 0x7ffe00000 is exactly 4,154,458,112 bytes = 3,962 MiB as we use -Xms == -Xmx and the whole thing is committed at startup, and nothing else in a JVM process is a single contiguous ~4 GB anonymous rw-p mapping.
Second, It's the lowest mapping in the address space, smaps_rollup [rollup] line starts at exactly 708400000:
cat /proc/$PID/smaps_rollup708400000-7ffd3bb56000 ---p 00000000 00:00 0 [rollup]
Private_Dirty: 3213788 kB
Swap: 2680532 kB
SwapPss: 2679412 kB
Locked: 0 kBThe JIT Code Cache Is Swapped Too
Decoding the top swapped regions:
1160380 kBat708400000– is the JVM heap, the compressed‑oops heap base and matches the[rollup]start fromsmaps_rollup.- The dozens of
61444 kBregions – these areas are probably related to native/off‑heap: Netty, JNI, Lucene native, etc. 43084 kBmarkedrwxp– the JIT code cache, also swapped out, a bad sign.
Together, these regions account for almost exactly the ~2.5 GB of swapped memory we observed earlier: cold heap regions, native/off-heap allocations, code cache, and possibly thread stacks.
Practically, this means two consequences:
- GC can amplify swap latency. 1 GB of the JVM heap was swapped out. G1 does not necessarily touch all of those pages during a mixed collection, but any GC phase that accesses a swapped page incurs a major fault and has to bring it back through the dm-crypt device. Hence, short GC work can produce significantly longer pauses.
- A swapped page can also contain executable code. The next call into a swapped-out compiled method can trigger a major fault before the code can run. The resulting latency may land on an otherwise random request and be difficult to attribute directly to GC, index I/O, or the query itself.
Evidence of Sustained Anon Memory Churn
workingset_refault_anon counts anonymous memory refault events after reclaim; it does not count unique pages. Together with pswpin and pswpout, it shows how much anonymous memory paging has accumulated since boot.
grep -E 'workingset_(refault|activate)_anon|pswpin|pswpout' /proc/vmstatworkingset_refault_anon 89061837
workingset_activate_anon 1856069
pswpin 86690374
pswpout 61618603These counters are cumulative, so fetching them at 10-minute intervals clearly shows that this wasn't a one-time eviction. There was sustained process: nearly 89 million anonymous pages were repeatedly swapped out and faulted back in.
vm.swappiness = 1 and GC Amplification
In this story vm.swappiness=1 was set since the cluster's inception. It does what Linux defines it to do, but it doesn't provide the protection we wanted. I suspect this matters particularly in the most resource-constrained deployments. How do we know that? The entire result above is a counterexample.
swappiness biases the kernel's choice between reclaiming file-backed and anonymous pages. It does not prevent anonymous pages from being swapped out. Even at 1, this can still happen under sustained memory pressure. On a resource-constrained node whose index is several times larger than its RAM, pressure on the filesystem cache is not an exceptional condition; this is the normal operating state.
This has two important consequences:
- It is not self-healing. Nothing proactively pages anonymous memory back in on a schedule. A swapped-out page returns to RAM only when it is accessed again, and cold memory, as it's defined, may remain untouched for a long time. As a result, the cold JVM memory can remain in swap indefinitely.
- It may remain invisible until something touches it. At steady state, a cold tail of the heap can remain in swap without producing obvious symptoms. The problem becomes visible when those pages are touched again, causing major page faults and potentially amplifying GC and request latency.
Key Takeaways
So, the root cause of the latency problems is an oversized heap combined with page cache pressure (the cold heap tail has been swapped out).
vm.swappiness=1did not protect the heap. It biases what gets reclaimed; it does not prevent anonymous memory from being swapped out.vm.swappiness=1should not be relied on with the other defaults in production. An oversized heap can lead to GC amplification that is difficult to detect.- Most of the swapped-out memory wasn't heap at all, but malloc arenas and the JIT code cache, none of it inside
Xmx, so heap metrics didn't show it. - Swap on
dm-cryptexacerbates the issue, resulting in longer GC pauses and random request latency spikes.dm-cryptmay be unavoidable in production due to security requirements.
The fix isn't another swappiness tweak. It's two things: stop committing heap you don't use, and make the heap you do commit non-evictable.
Follow Up
In Act 2, we'll answer the remaining questions raised at the beginning of this article and look more closely at the trade-off introduced by bootstrap.memory_lock. This setting makes the heap resident and swap-immune, but it also turns jvm_heap_ratio from a soft default into a permanent memory commitment.
The question then becomes: what heap ratio best suits different read and write workloads?
There is one more complication to mention in advance: in a resource-constrained environment, merge storms can distort benchmark results, making an otherwise good heap ratio appear poor. See the screenshot below.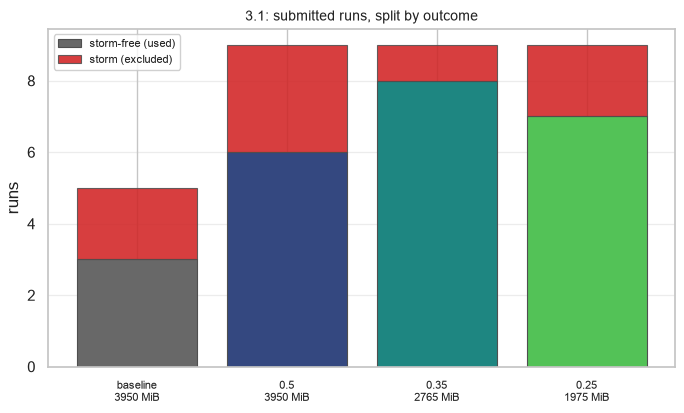
Opinions expressed by DZone contributors are their own.
Comments