OpenTelemetry Tracing on Spring Boot: Java Agent vs. Micrometer Tracing
In this post, compare three different ways to utilize OpenTelemtry Tracing and Spring Boot components: Java agent v1, Java agent v2, and Micrometer Tracing.
Join the DZone community and get the full member experience.
Join For FreeMy demo of OpenTelemetry Tracing features two Spring Boot components. One uses the Java agent, and I noticed a different behavior when I recently upgraded it from v1.x to v2.x. In the other one, I'm using Micrometer Tracing because I compile to GraalVM native, and it can't process Java agents.
I want to compare these three different ways in this post: Java agent v1, Java agent v2, and Micrometer Tracing.
The Base Application and Its Infrastructure
I'll use the same base application: a simple Spring Boot application, coded in Kotlin. It offers a single endpoint.
- The function beyond the endpoint is named
entry(). - It calls another function named
intermediate(). - The latter uses a
WebClientinstance, the replacement ofRestTemplate, to make a call to the above endpoint. - To avoid infinite looping, I pass a custom request header: if the
entry()function finds it, it doesn't proceed further.

It translates into the following code:
@SpringBootApplication
class Agent1xApplication

@RestController
class MicrometerController {

    private val logger = LoggerFactory.getLogger(MicrometerController::class.java)

    @GetMapping("/{message}")
    fun entry(@PathVariable message: String, @RequestHeader("X-done") done: String?) {
        logger.info("entry: $message")
        if (done == null) intermediate()
    }

    fun intermediate() {
        logger.info("intermediate")
        RestClient.builder()
            .baseUrl("http://localhost:8080/done")
            .build()
            .get()
            .header("X-done", "true")
            .retrieve()
            .toBodilessEntity()
    }
}
For every setup, I'll check two stages: the primary stage, with OpenTelemetry enabled, and a customization stage to create additional internal spans.
Micrometer Tracing
Micrometer Tracing stems from Micrometer, a "vendor-neutral application observability facade."
Micrometer Tracing provides a simple facade for the most popular tracer libraries, letting you instrument your JVM-based application code without vendor lock-in. It is designed to add little to no overhead to your tracing collection activity while maximizing the portability of your tracing effort.
To start with Micrometer Tracing, one needs to add a few dependencies:
- Spring Boot Actuator,
org.springframework.boot:spring-boot-starter-actuator - Micrometer Tracing itself,
io.micrometer:micrometer-tracing - A "bridge" to the target tracing backend API; In my case, it's OpenTelemetry, hence
io.micrometer:micrometer-tracing-bridge-otel - A concrete exporter to the backend,
io.opentelemetry:opentelemetry-exporter-otlp
We don't need a BOM because versions are already defined in the Spring Boot parent.
Yet, we need two runtime configuration parameters: where should the traces be sent, and what is the component's name. They are governed by the MANAGEMENT_OTLP_TRACING_ENDPOINT and SPRING_APPLICATION_NAME variables.
services:
  jaeger:
    image: jaegertracing/all-in-one:1.55
    environment:
      - COLLECTOR_OTLP_ENABLED=true                                     #1
    ports:
      - "16686:16686"
  micrometer-tracing:
    build:
      dockerfile: Dockerfile-micrometer
    environment:
      MANAGEMENT_OTLP_TRACING_ENDPOINT: http://jaeger:4318/v1/traces    #2
SPRING_APPLICATION_NAME: micrometer-tracing #3- Enable the OpenTelemetry collector for Jaeger.
- Full URL to the Jaeger OpenTelemetry gRPC endpoint.
- Set the OpenTelemetry's service name.
Here's the result:
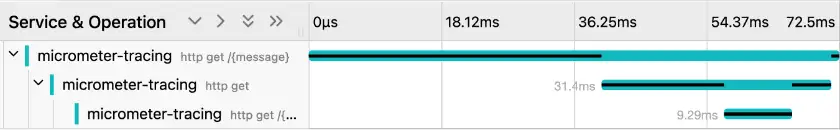
Without any customization, Micrometer creates spans when receiving and sending HTTP requests.
The framework needs to inject magic into the RestClient for sending. We must let the former instantiate the latter for that:
class MicrometerTracingApplication {
@Bean
fun restClient(builder: RestClient.Builder) =
builder.baseUrl("http://localhost:8080/done").build()
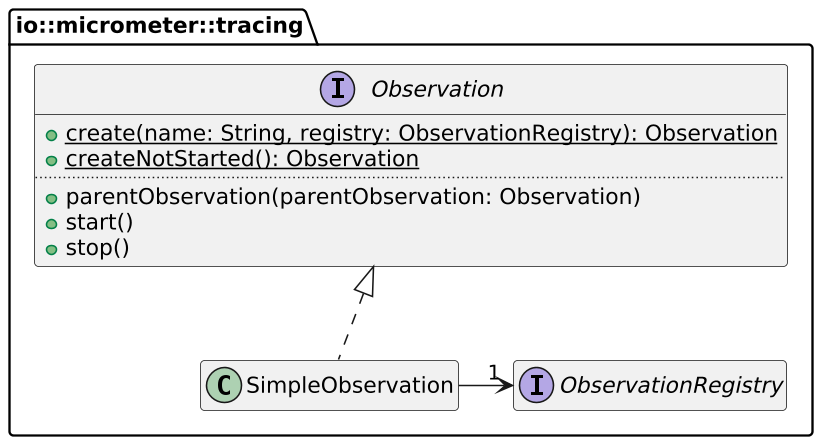
}We can create manual spans in several ways, one via the OpenTelemetry API itself. However, the setup requires a lot of boilerplate code. The most straightforward way is the Micrometer's Observation API. Its main benefit is to use a single API that manages both metrics and traces.
Here's the updated code:
class MicrometerController(
private val restClient: RestClient,
private val registry: ObservationRegistry
) {
@GetMapping("/{message}")
fun entry(@PathVariable message: String, @RequestHeader("X-done") done: String?) {
logger.info("entry: $message")
val observation = Observation.start("entry", registry)
if (done == null) intermediate(observation)
observation.stop()
}
fun intermediate(parent: Observation) {
logger.info("intermediate")
val observation = Observation.createNotStarted("intermediate", registry)
.parentObservation(parent)
.start()
restClient.get()
.header("X-done", "true")
.retrieve()
.toBodilessEntity()
observation.stop()
}
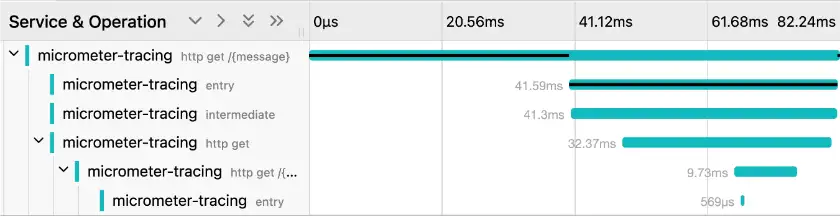
}The added observation calls reflect upon the generated traces:
OpenTelemetry Agent v1
An alternative to Micrometer Tracing is the generic OpenTelemetry Java Agent. Its main benefit is that it impacts neither the code nor the developers; the agent is a pure runtime-scoped concern.
java -javaagent:opentelemetry-javaagent.jar agent-one-1.0-SNAPSHOT.jarThe agent abides by OpenTelemetry's configuration with environment variables:
services:
  agent-1x:
    build:
      dockerfile: Dockerfile-agent1
    environment:
      OTEL_EXPORTER_OTLP_ENDPOINT: http://jaeger:4317                   #1
      OTEL_RESOURCE_ATTRIBUTES: service.name=agent-1x                   #2
      OTEL_METRICS_EXPORTER: none                                       #3
      OTEL_LOGS_EXPORTER: none                                          #4
    ports:
- "8081:8080"- Set the protocol, the domain, and the port. The library appends
/v1/traces. - Set the OpenTelemetry's service name.
- Export neither the metrics nor the logs.
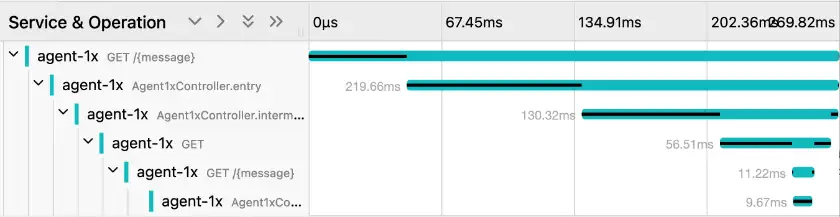
With no more configuration, we get the following traces:
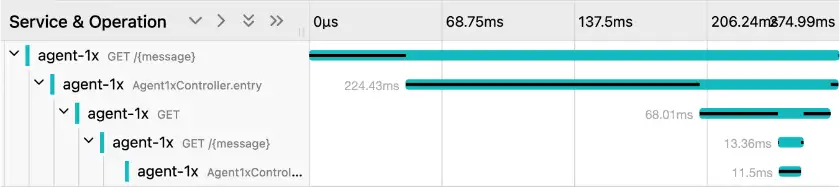
The agent automatically tracks requests, both received and sent, as well as functions marked with Spring-related annotations. Traces are correctly nested inside each other, according to the call stack. To trace additional functions, we need to add a dependency to our codebase, io.opentelemetry.instrumentation:opentelemetry-instrumentation-annotations. We can now annotate previously untraced functions with the @WithSpan annotation.
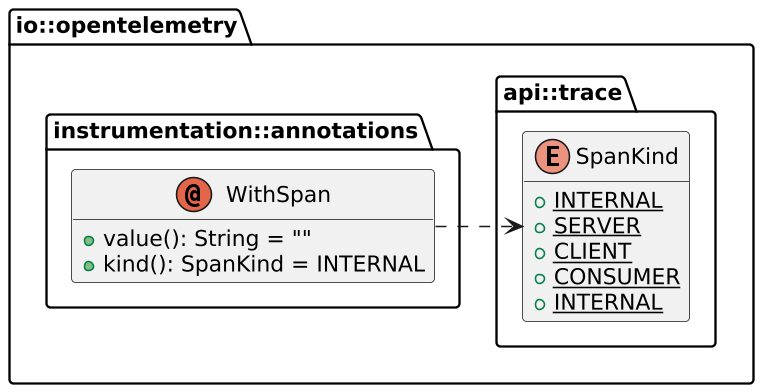
The value() part governs the trace's label, while the kind translates as a span.kind attribute. If the value is set to an empty string, which is the default, it outputs the function's name. For my purposes, default values are good enough.
@WithSpan
fun intermediate() {
    logger.info("intermediate")
    RestClient.builder()
        .baseUrl("http://localhost:8080/done")
        .build()
        .get()
        .header("X-done", "true")
        .retrieve()
        .toBodilessEntity()
}
It yields the expected new intermediate() trace:
OpenTelemetry Agent v2
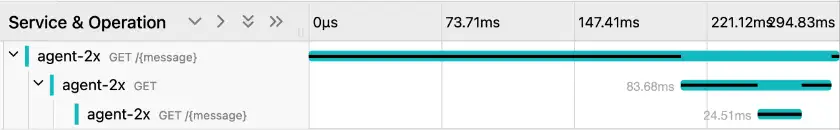
OpenTelemetry released a new major version of the agent in January of this year. I updated my demo with it. Traces are now only created when the app receives and sends requests.
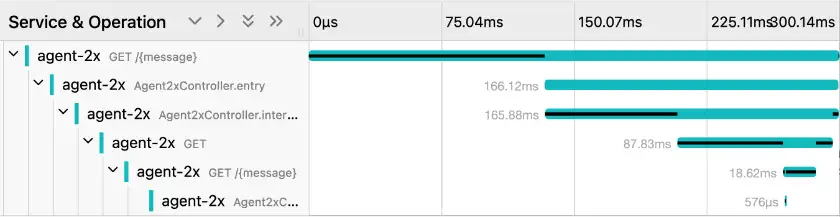
As for the previous version, we can add traces with the @WithSpan annotation. The only difference is that we must also annotate the entry() function. It's not traced by default.
Discussion
Spring became successful for two reasons: it simplified complex solutions, i.e., EJBs 2, and provided an abstraction layer over competing libraries. Micrometer Tracing started as an abstraction layer over Zipkin and Jaeger, and it made total sense. This argument becomes moot with OpenTelemetry being supported by most libraries across programming languages and trace collectors. The Observation API is still a considerable benefit of Micrometer Tracing, as it uses a single API over Metrics and Traces.
On the Java Agent side, OpenTelemetry configuration is similar across all tech stacks and libraries - environment variables. I was a bit disappointed when I upgraded from v1 to v2, as the new agent is not Spring-aware: Spring-annotated functions are not traced by default. In the end, it's a wise decision. It's much better to be explicit about the spans you want than remove some you don't want to see.
- Thanks to Jonatan Ivanov for his help and his review.
- The complete source code for this post can be found on GitHub.
To Go Further
Published at DZone with permission of Nicolas Fränkel. See the original article here.
Opinions expressed by DZone contributors are their own.
Comments