Optimizing Robotics Application’s Performance
In this post, we would like to share our real-world experience in optimizing a Java application that was controlling the robots in a warehouse.
Join the DZone community and get the full member experience.
Join For FreeIn this post, we would like to share our real-world experience in optimizing a Java application that was controlling the robots in a warehouse. This application would give instructions to the robots in the warehouse on what actions to perform. Based on those instructions, robots carry out their job in the warehouse. Occasionally, this application was slowing down and not giving instructions to the robots. If robots didn't receive instructions from the application, they would start to make autonomous decisions causing degenerated behavior in them, which in turn was affecting the delivery and shipments in the warehouse.
Long Garbage Collection Pause
The best way to start troubleshooting the Java application’s performance is to study its Garbage Collection performance. This is even more true when the application suffers from a slowdown. We took this application’s Garbage Collection log file and uploaded it to the GCeasy tool. (Note: Garbage Collection log contains vital statistics that are not reported by most monitoring tools, and they add almost no overhead to your application. Thus, it’s a best practice to enable the Garbage Collection log on all your production instances). The tool analyzed the Garbage Collection log and instantly generated this insightful GC log analysis report.
The tool reported various interesting metrics and graphs. The Garbage Collection Pause time graph in the report is of most interest to our discussion. Below is that graph:
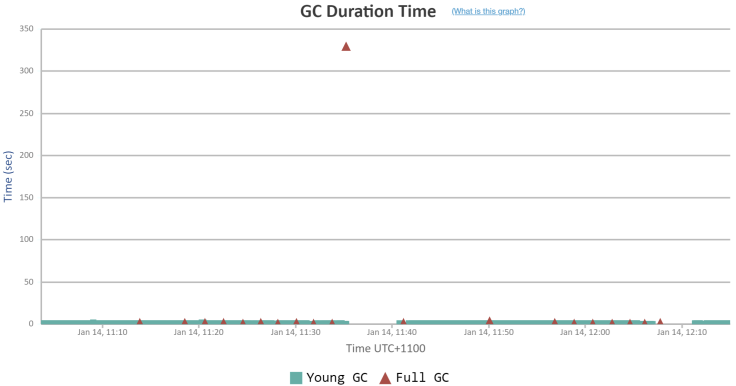
Whenever the Garbage Collection event runs, it pauses the entire application. During that pause period, none of the customer transactions will be processed. All the transactions that are in flight will be halted. From the above graph you can notice that at 11:35 am, during the peak traffic time, a Garbage Collection event paused the entire application for 329 seconds (i.e. 5 minutes and 29 seconds). It means during that entire 5+ minutes window all the robots wouldn’t have gotten any instructions from this application. They would have taken the decisions autonomously, causing disruption to the business.
What Is Causing the Long GC Pause?
There were two primary reasons causing such a long Garbage Collection Pause:
- Large heap size: The application is configured to run with a 126GB heap size. Typically, when the heap size is large, garbage collection time will also be longer. Because a lot of objects would have been accumulated and it would take a long time to be evicted from the memory.
- CMS (Concurrent Mark and Sweep) algorithm: The CMS GC algorithm runs well and is an apt fit for several applications, however, its major drawback is its occasional long GC pause. CMS GC algorithm doesn’t always cause long GC Pauses, most of its GC pauses are in the acceptable range, however occasionally it causes long GC pauses due to heap fragmentation, which can last for several seconds (sometimes even minutes) like in this situation.
Potential Solutions To Reduce Long GC Pauses
Here is a blog post that highlights potential solutions to reduce long Garbage Collection pauses. We were contemplating a couple of solutions to address this long GC pause.
1. Reducing Heap Size
Reducing the application’s heap size is a potential solution. However, the object creation rate of this monolith application was very high, and reducing the heap size has the potential to affect the application’s responsiveness. Heap size can be reduced only if the application’s memory consumption can be reduced, which warrants the refactoring of the application code. Already this monolith application’s re-architecture was underway. This monolith application was getting broken down and re-written as microservices with much lesser heap size. However, this application re-architecture was slated to go live in 6 – 9 months later. Thus, the customer was hesitant to reduce the heap size until then.
2. Switching From CMS to G1 GC Algorithm
The other solution was to migrate away from the CMS GC algorithm. Irrespective of this GC performance, this CMS GC algorithm has been deprecated since Java 9 and it will be permanently removed from Java 14. If we want to move away from the CMS GC algorithm, what are the alternatives we have? Below are the alternate GC algorithms that are available in OpenJDK:
- Serial GC
- Parallel GC
- G1 GC
- ZGC
- Shenandoah GC
The serial GC algorithm is useful only for single-threaded, desktop type of applications. Since this application has multiple concurrent threads with a very heavy object creation rate, we eliminated the Serial GC algorithm. Since this application was running on Java 8, we ruled out ZGC and Shenandoah GC because they are all stable only from Java 17+. Thus, we were left with the choice of either using Parallel GC or G1 GC.
We simulated production traffic volume in the performance lab and experimented with Parallel GC and G1 GC algorithm settings based on the best GC tuning practices. We found out that Parallel GC pause time was not as bad as CMS GC, but it was not better than G1 GC. Thus, we ended up switching from the CMS GC algorithm to the G1 GC algorithm. Here is the GC log analysis report of this robotics application in the performance lab when using the G1 GC algorithm. Below is the GC Pause duration graph when using the G1 GC algorithm:
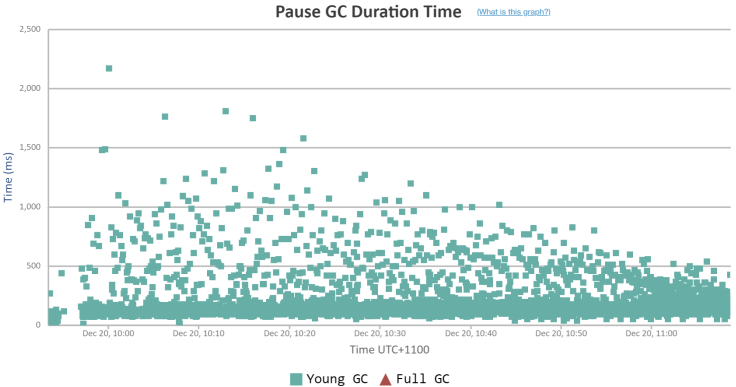
From the graph, you can notice that the maximum GC pause time was 2.17 seconds. This is a phenomenal improvement from 5 minutes and 29 seconds. Also, the average GC pause time was only 198ms; way better than the CMS GC algorithm for this application.
Conclusion
After switching to the G1 GC algorithm, the application’s random slowdowns completely stopped. Thus, without major architectural changes, without code refactoring, without any JDK/infrastructural upgrades, just by tweaking the GC arguments in the JVM, we were able to bring this significant optimization to this robotics application’s performance.
Published at DZone with permission of Ram Lakshmanan. See the original article here.
Opinions expressed by DZone contributors are their own.
Comments