Predict Customer Churn Using R and Tableau
An in-depth tutorial exploring how you can combine Tableau and R together to predict your rate of customer turnover.
Join the DZone community and get the full member experience.
Join For FreeBusiness Analytics is all about finding relevant information from loads of data, and predictive analytics and data visualization form its principal ingredients. Predictive analytics, the hot thing in today's market, is about predicting certain information from historical data, and data visualization is about presenting the data in a form that can be easily interpreted by people.
In this article, we'll see how we can bring the best out of our data and present it to our audience. It is about integrating Tableau and R together. When we study leaders in data visualization platforms, Tableau ranks high. When we decide to do predictive analytics, we will come across R. The best of the best analytics are now possible through the integration of these two technologies to give our clients a pleasant experience. We will demonstrate this integration using a historical Customer Churn Data set.
Why Tableau and R for Customer Churn Analytics?
Tableau, being a great visualization tool, will help to better visualize and analyze the customer journey for an Organization. It can help create beautiful dashboards and visualizations on the fly to analyze customer data. What it lacks is the ability to create predictions out of the data. With the help of R, Tableau can now utilize R's machine learning capabilities to churn out the predictions from the data. Tableau and R complement each other, with Tableau providing great data inference capabilities and R providing its most sought-after Machine Learning capabilities.
Why Do We Need to Worry About Customer Churn?
Customers are the revenue creation entities for an organization. This calls for an organization to be customer-centric. Happy customers help an organization's brand build and become a part of its growth story. If any customer discontinues using your product or ceases a relationship with your organization, it is a potential loss of revenue. Besides the loss of profitability that results from a customer abandoning an organization, there is a loss of reputation in the market. Customer Churn prediction is a most important tool for an organization’s CRM (customer relationship management) toolkit. Doing it correctly helps an organization retain customers who are at a high risk of churning. Organizations can design marketing actions and campaigns to retain these customers proactively, which contributes to eliminating the risk of customer churn.
Using a Telco Customer Churn data set, we will demonstrate the way to get started with bringing the results from R to Tableau.
What Do You Need to Get Started?
R —R is a free software environment for statistical computing and graphics.To download R, please choose your preferred CRAN mirror.
- RServe — Rserve is a TCP/IP server which allows other programs to use facilities of R from various languages without the need to initialize R or link against an R library.
install.packages("Rserve")
library(Rserve)
Rserve()
Tableau 10.1 — Tableau can help anyone see and understand their data. Connect to almost any database, drag and drop to create visualizations, and share with a click.
To start, import the data into Tableau using its data upload options. I have detailed this process in my previous article, Analyze DZone's Write to Win Contest Using Tableau 10, which you can refer to. Once uploaded, navigate to Sheet 1 as shown in the below figure.
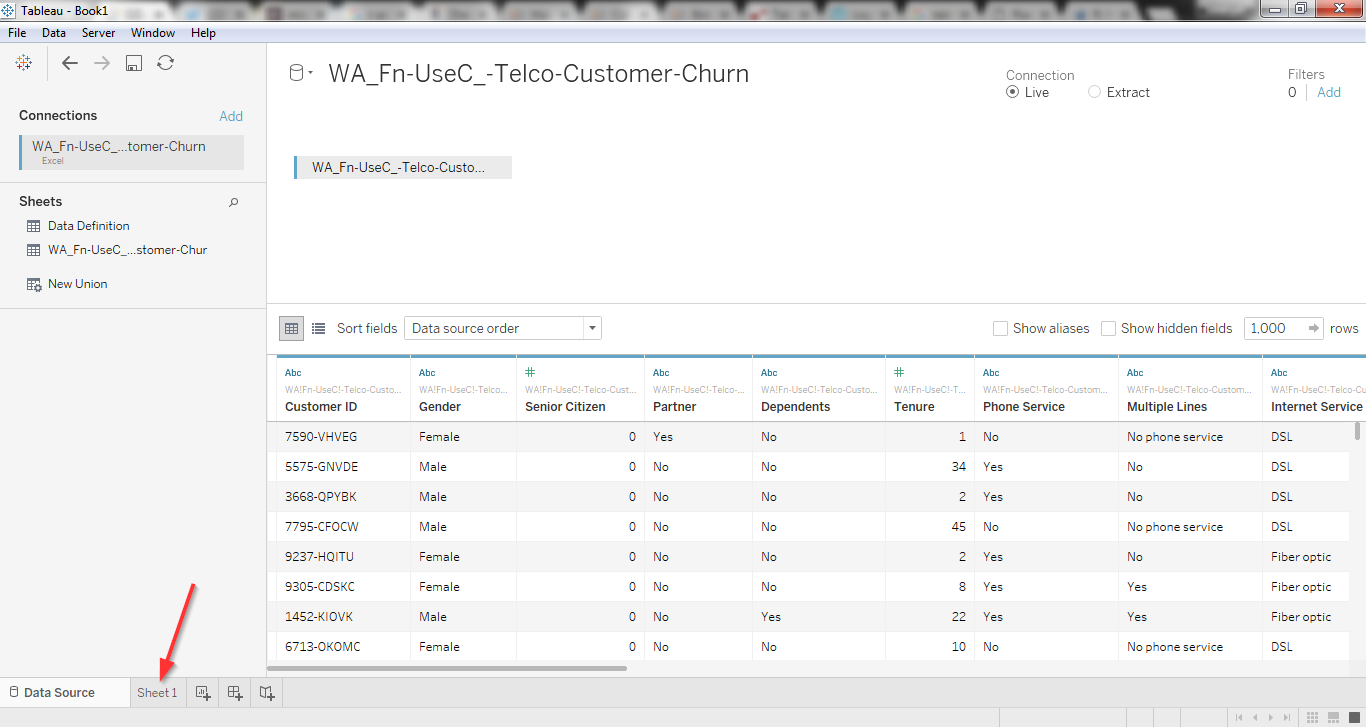
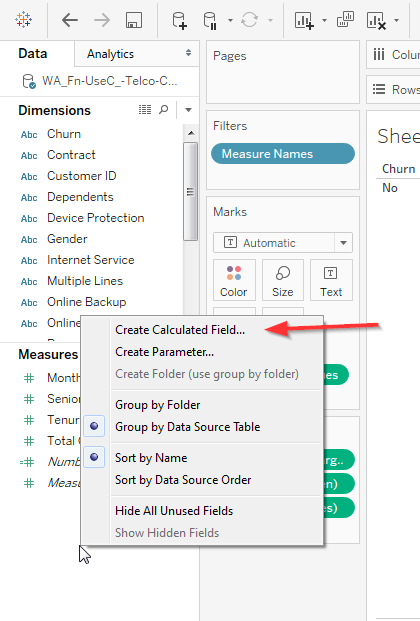
The field "Churn" is a boolean field with "Yes/No" values. We can also transform it into values such as 0/1. The reason I brought up this simple transformation here is to demonstrate the use of calculated field option in Tableau. This option helps to create new fields and is useful for cases where we want to do some data transformations, calculations such as aggregations, or if we want to create new data using a formula based on already existing data. Right click and select 'Create Calculated Field' in the Measures tab as shown in the following figure.
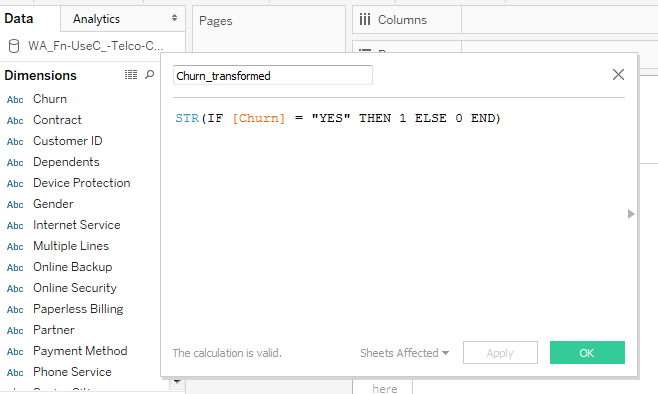
This pops up an editing dialog box. The calculated values are defined by entering a formula into Tableau's formula box. For this exercise, enter the calculated field's name to be "Churn_transformed". Use the below function in the formula section of the dialog box and click OK to create the field:
STR(IF [Churn] = "YES" THEN 1 ELSE 0 END)
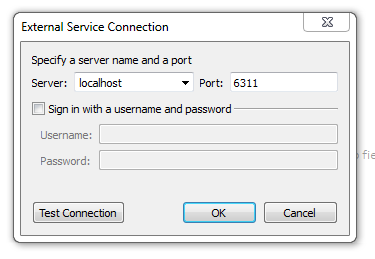
Now, we know how to create a calculated field. Let's move on to create the Churn[predicted] field. This will store the result of the customer churn prediction returned from R. Before we move on creating the field, we first need to connect Tableau to R using the 'Manage External Service Connection' option, available in the Help section of Tableau as illustrated in the below figure.
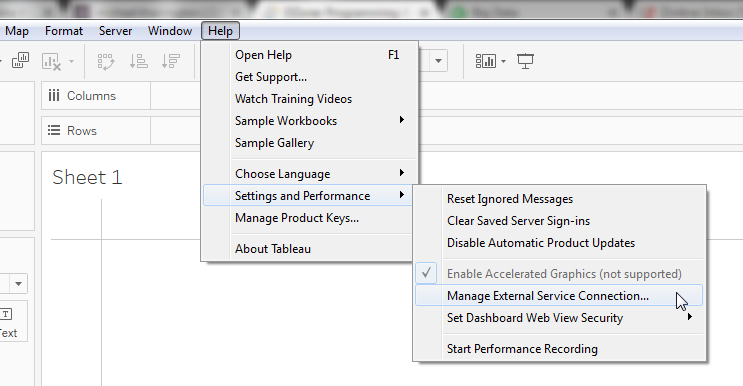
If your R services and Rserve are running at the same place, set the connection's server to localhost. The default port is 6311. You can leave it as is, if the port is not changed. Click OK to connect R and Tableau.
Now, create the Churn[Predicted] field in the same manner we created the Churn_transformed field. However, for this exercise, we will be using an R script in the formula section. There are various ways to call an R script from Tableau as discussed below. Mostly they are identified by the type of values they return from R:
SCRIPT_INT returns an integer.
SCRIPT_REAL returns float values.
SCRIPT_STR returns string.
SCRIPT_BOOL returns T|F values.
The syntax of the function is represented like this:
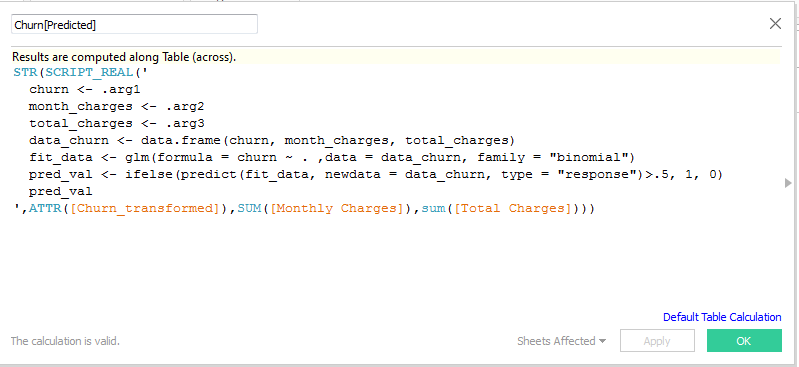
SCRIPT_REAL('<R Script>', <Parameters to be passed to the script>)The below script reads that the first parameter .arg1 for R script references Tableau's field ATTR([Churn_transformed]). The other parameters follow the same pattern.
STR(SCRIPT_REAL('
  churn <- .arg1
  month_charges <- .arg2
  total_charges <- .arg3
  data_churn <- data.frame(churn, month_charges, total_charges)
  fit_data <- glm(formula = churn ~ . ,data = data_churn, family = "binomial")
  pred_val <- ifelse(predict(fit_data, newdata = data_churn, type = "response")>.5, 1, 0)
  pred_val
',ATTR([Churn_transformed]),SUM([Monthly Charges]),sum([Total Charges])))
Once you have the script ready, hit OK to create the field Churn[Predicted].
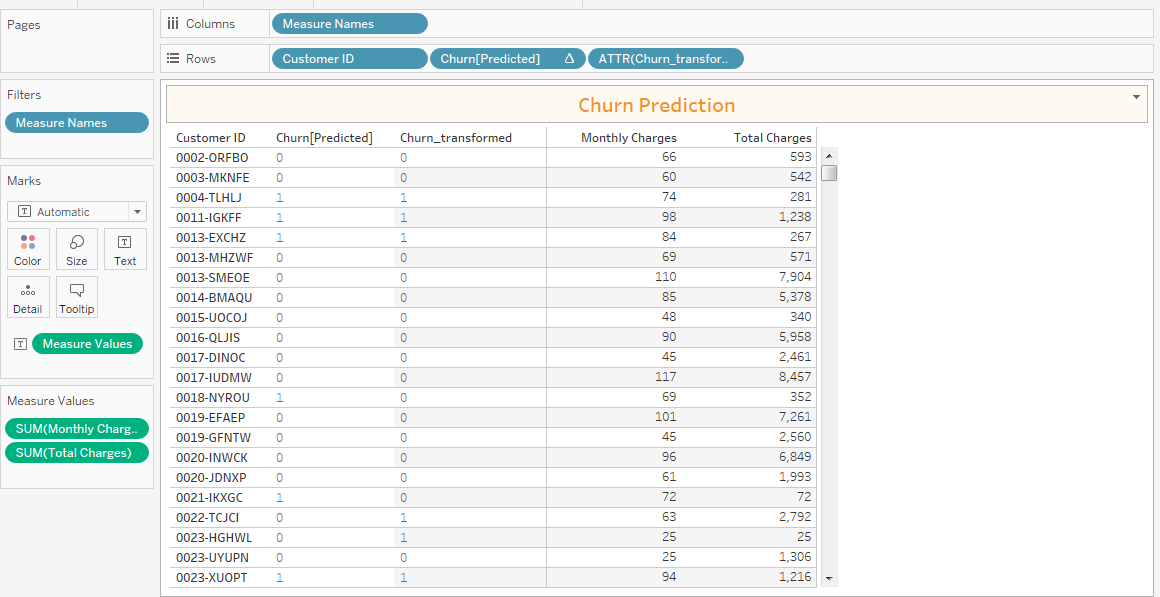
With this, you are now ready to use the predictions from R along with other attributes of your data set. Now with this field, you can do a lot more on Tableau to get great eye-catching visualization and dashboard with your historical and predicted data. You can download this workbook from my GitHub.
Opinions expressed by DZone contributors are their own.
Comments