From Data to Decisions: Visualizing SAP Insights With Python
SAP data insights simplified with Python: A versatile tool for advanced analytics, automation, and managing large datasets.
Join the DZone community and get the full member experience.
Join For FreeSAP has always enjoyed the position of being the most trusted enterprise resource planning software where it brings in all the departments in an organization like sales, inventory, production, quality, human resources, and more. Data that resides in SAP ERP data is the bedrock for all decision-making as it provides a single source of truth to the entire organization. Visualizing this data can uncover market trends and patterns and provide actionable insights to the leadership team.
While SAP itself has business objects as its flagship visualization tool, as developers, we are going to explore how Python, with its robust ecosystem of libraries, can be as powerful and can be consumed freely by any developer.
Why Is Data Visualization Important?
Data visualization is the science of combining data from different sources to form a cube where one can slice and dice to uncover hidden information. It usually involves using visual representations to convey data through elements like charts, graphs, and maps, which can be readily understood by an executive.
There are plenty of tools available in the market, like Microsoft Excel, QlikView, PowerBI, Tableau, SAP Lumira, and SAP Visual Analytics. Each of these tools has its own advantages and limitations. In this article we are not going to discuss their features but rather focus on the libraries that are available in Python.
Visualization is naturally easy within the SAP ecosystem, provided the consultant understands SAP data models and tools. However, as a core developer, I prefer to write codes rather than drag and drop, where I don’t know the engine that runs behind and creates the graph.
Why Visualize SAP Data?
SAP has transaction data that has too much information, which sometimes masks critical information that an executive needs to quickly identify patterns and anomalies. Such pulse and anomaly must be identified in real-time so that an organization can respond to them before they become a burden. Hence, such visualization supports the top management by highlighting critical key purpose indicators (KPIs), triggering alerts, and enabling swift responses to challenges.
- Enhance KPIs for better decision-making
- Recognize trends and anomalies for course correction
- Track and keep the organization competitive
- Formulate strategic plans and take proactive measures instead of being reactive
Why Python?
While SAP has its family of visualization tools, Python has been popular among data scientists as a favorite tool for scientific computing tasks, including the analysis and visualization of large datasets. Python provides various libraries that come with different features for visualizing data. All these libraries come with different features and can support various types of graphs.
Popular Python Libraries for SAP Data Visualization
|
Library |
Usage |
Pros |
|
pandas |
Data manipulation |
Easy to use, integrates with most libraries. |
|
matplotlib |
Basic visualization |
Highly customizable but static. |
|
seaborn |
Statistical visualization |
Built on Matplotlib, simpler syntax. |
|
plotly |
Interactive plots |
Interactive, supports web exports. |
|
dash |
Web-based dashboards |
Scalable, interactive applications. |
|
streamlit |
Rapid app development |
Easy-to-build dashboards. |
How Python Fits in SAP Data Visualization
Python comfortably bridges the gap between raw SAP data and actionable insights with:
- Connectivity. Access SAP data through direct connections (e.g., RFC, OData, or APIs).
- Data manipulation. Use libraries like
pandasfor cleaning and transforming data. - Visualization. Leverage visualization libraries (e.g.,
matplotlib,seaborn,plotly) for creating insightful charts and dashboards. - Automation. Schedule and automate data processing and visualization tasks.
Let us see step by step how we can achieve this.
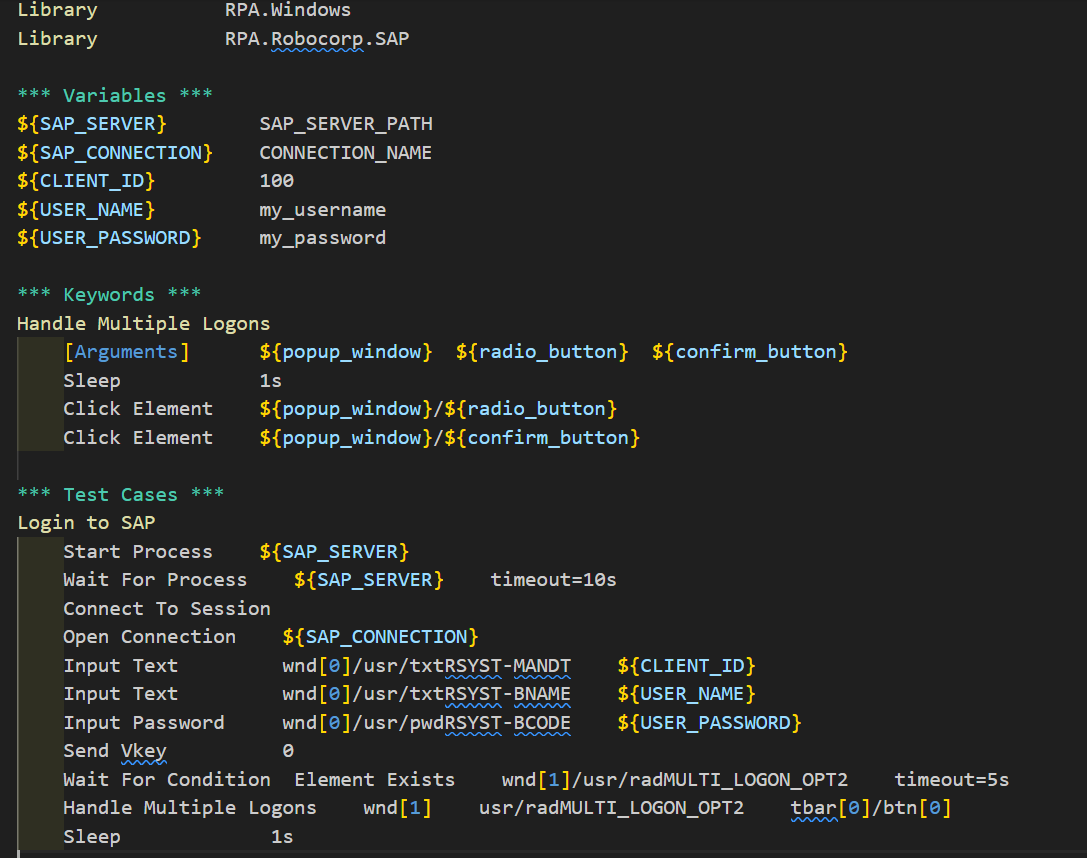
Connection to SAP
There are various ways to connect to SAP. Here, we are going to make a connection through the SAP Logon Pad. Make sure that the SAP Logon Pad is started.
Steps to Connect to an SAP Session
- Start the SAP Logon Pad.
- Use the keyword "connect to session."
- If the connection is successful, you can use Open Connection to open a new connection.
- You can also use Connect To Existing Connection to connect to an existing connection.
Using the OpenConnection Method
- Set the sync parameter to
True. - Use the
OpenConnectionByConnectionStringmethod. - Pass the connection string for the SAP server as the
ConnectStringparameter.
Selecting a Specific Session
You can select a specific session using criteria such as the system ID (SID), a transaction code (TAC), or a program name.
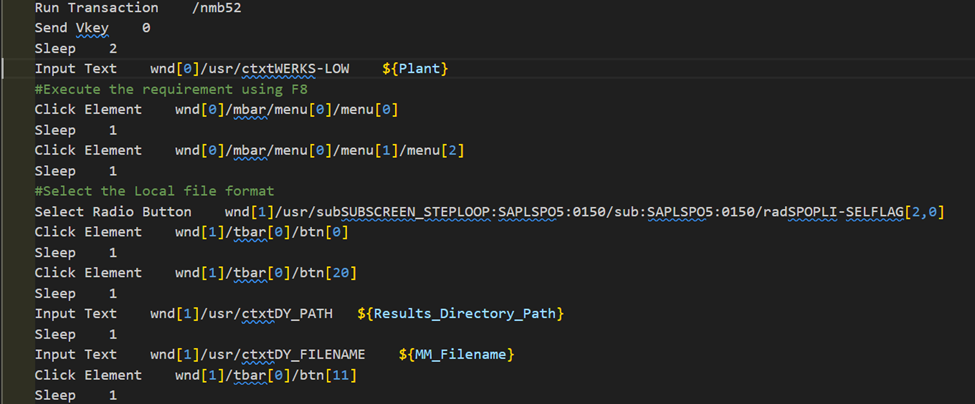
Data Extraction
Once the connection to SAP system is established, retrieve data from SAP using:
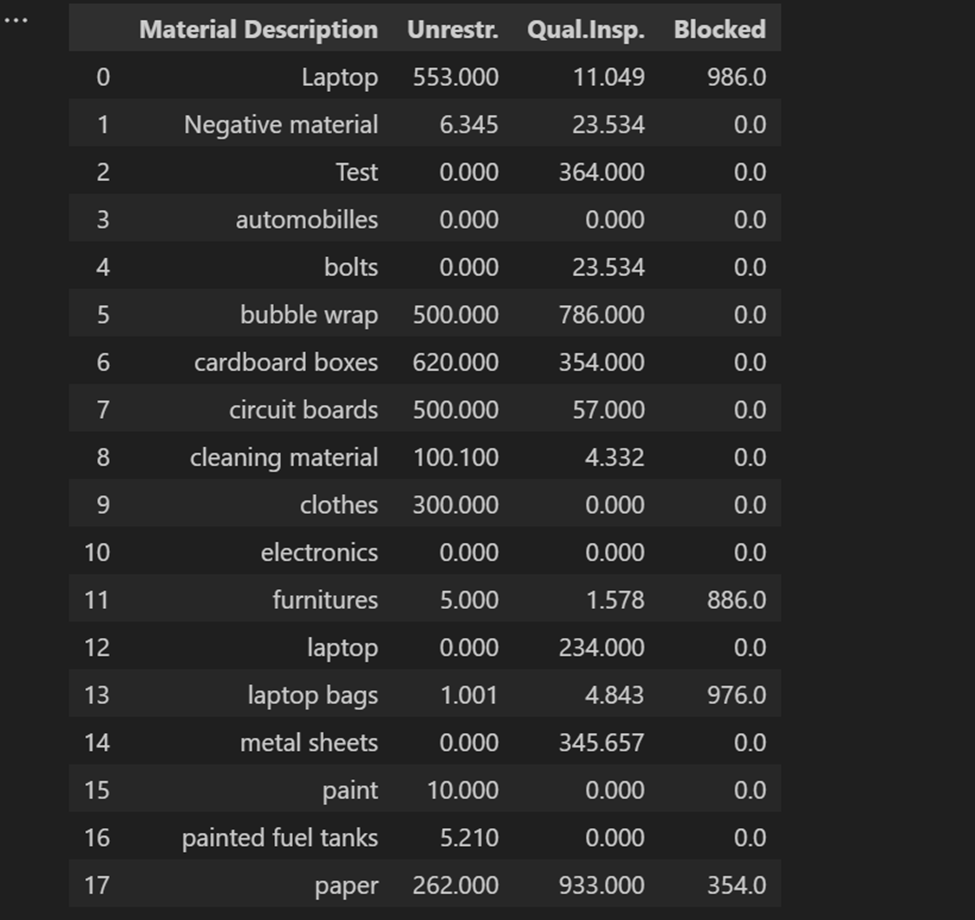
- File exports. CSV or Excel exports from SAP transactions or reports. To find the material availability, use the transaction code
mb52and save the data as an Excel file.
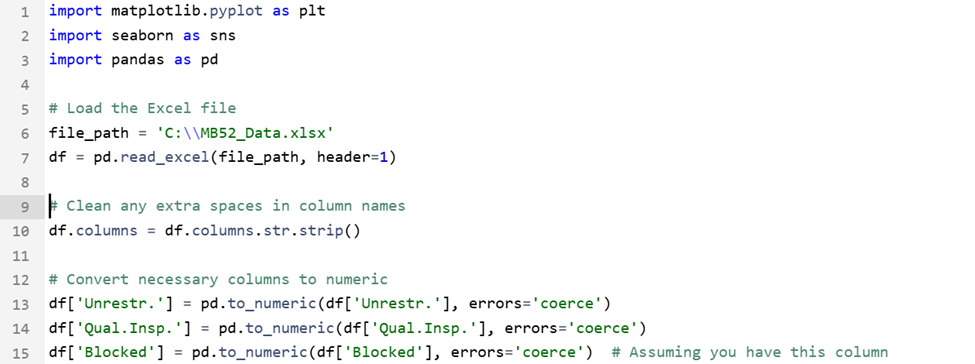
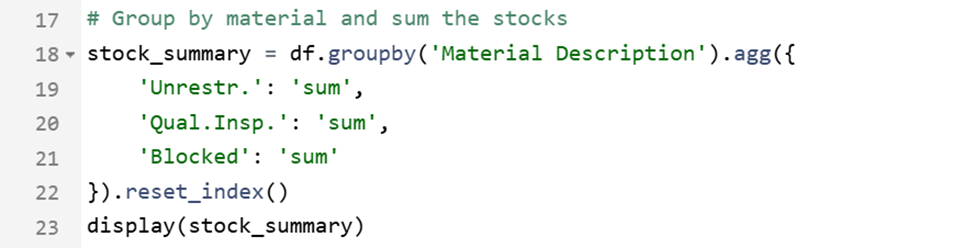
Data Transformation
Process and prepare the data using Python's data libraries:
pandas: For cleaning, filtering, and aggregating data.
Data Visualization
Create visuals using Python libraries once we have the cleaned data.
matplotlib: Basic static charts.seaborn: Advanced statistical plots.
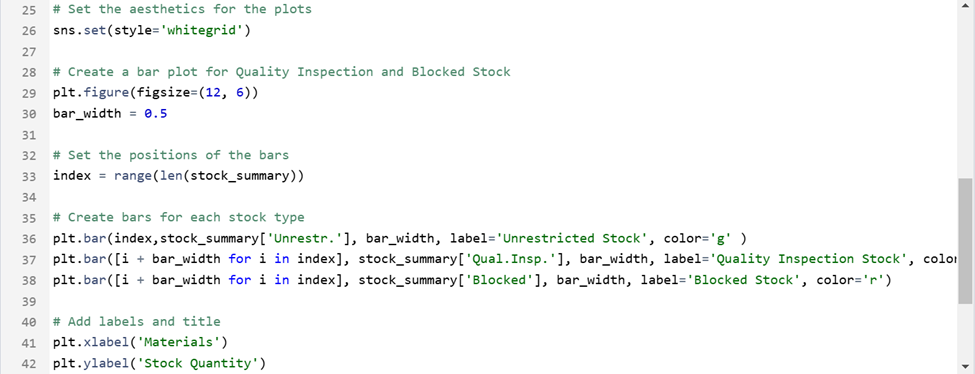
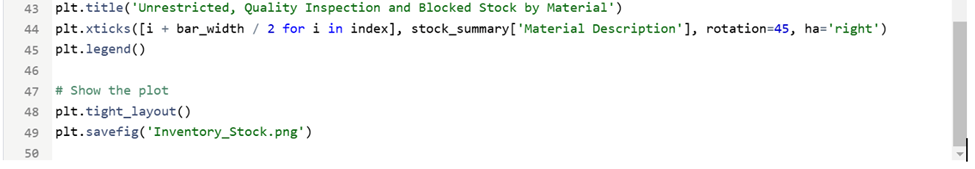
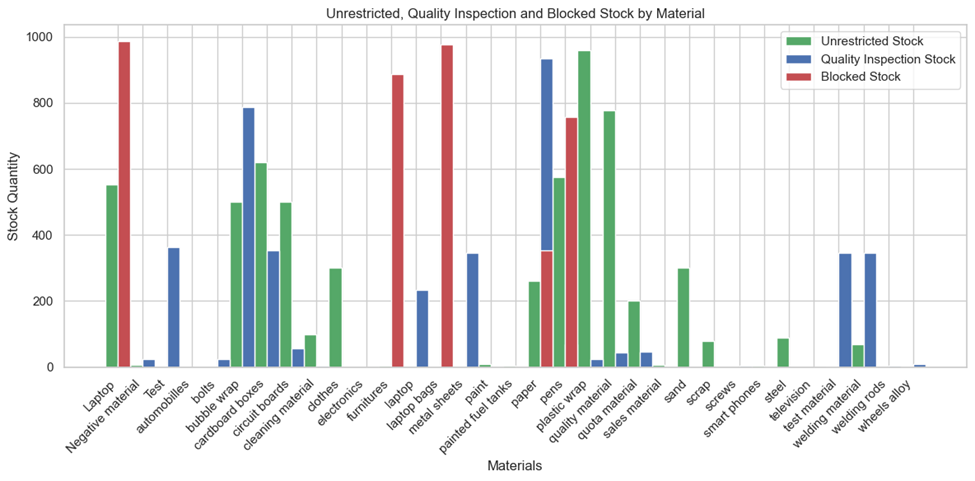
A bar chart showing the stocks of various materials:
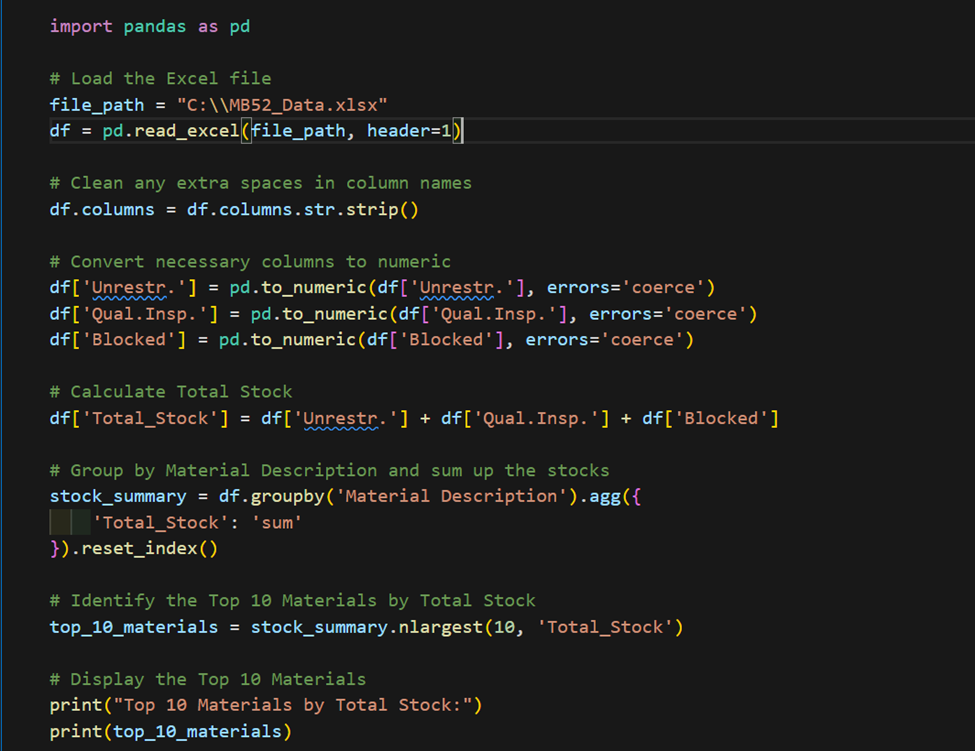
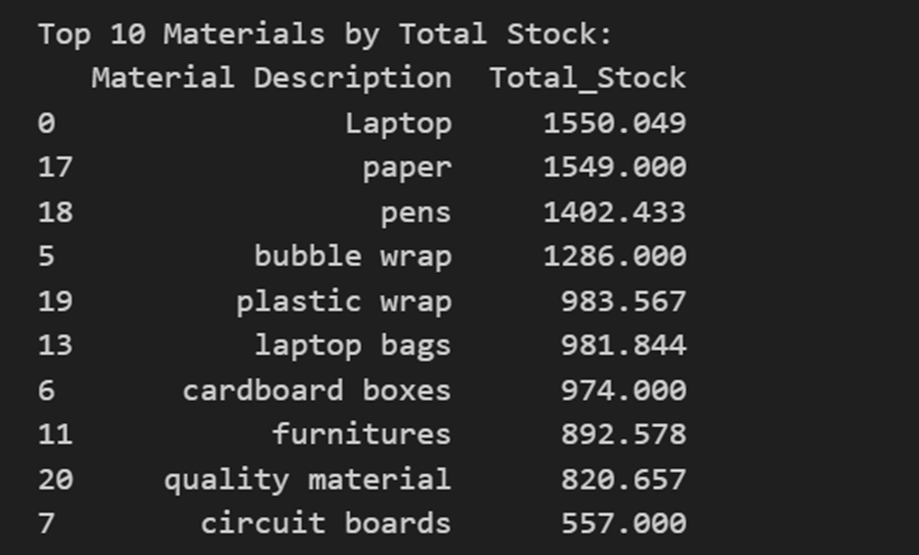
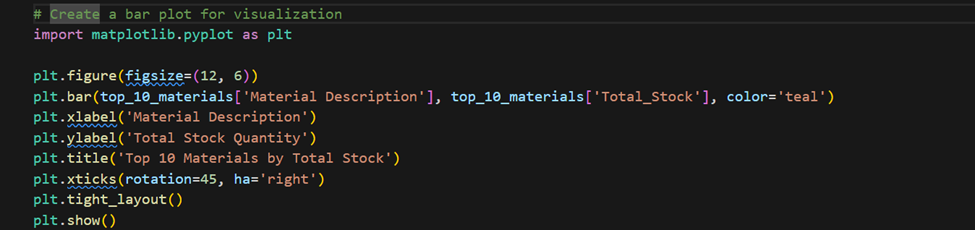
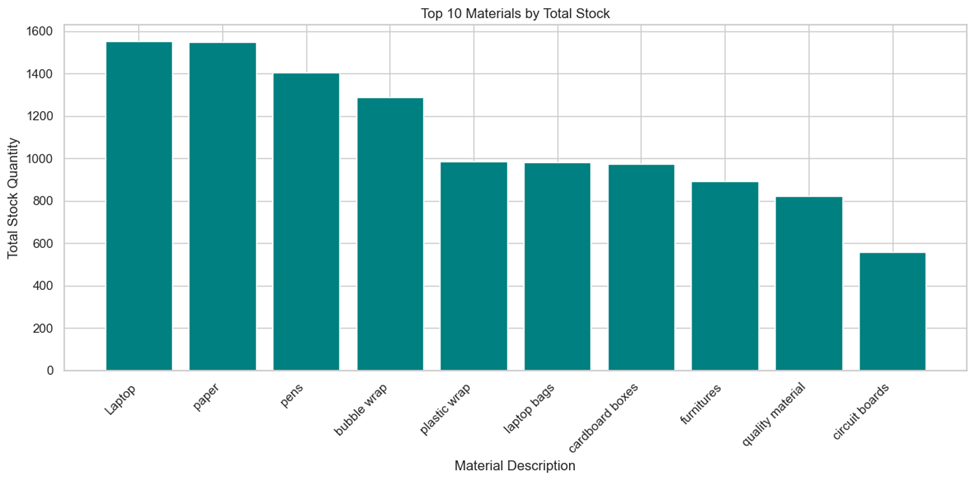
A bar chart showing the top 10 materials based on total stock:
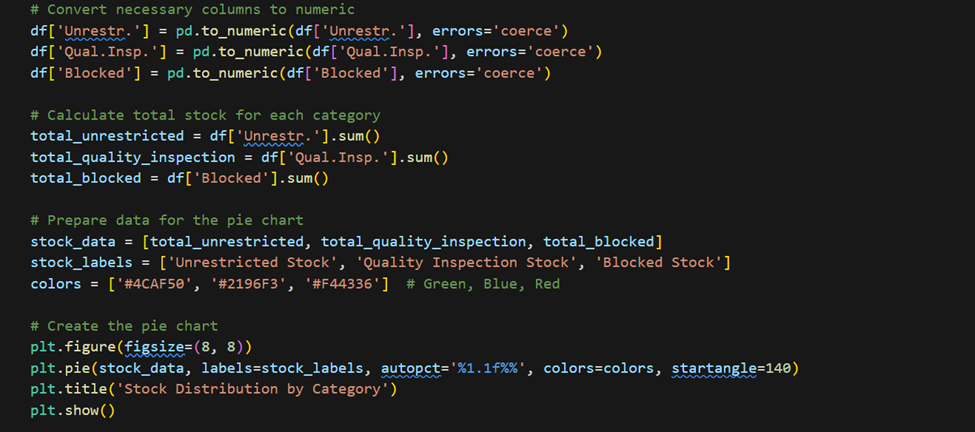
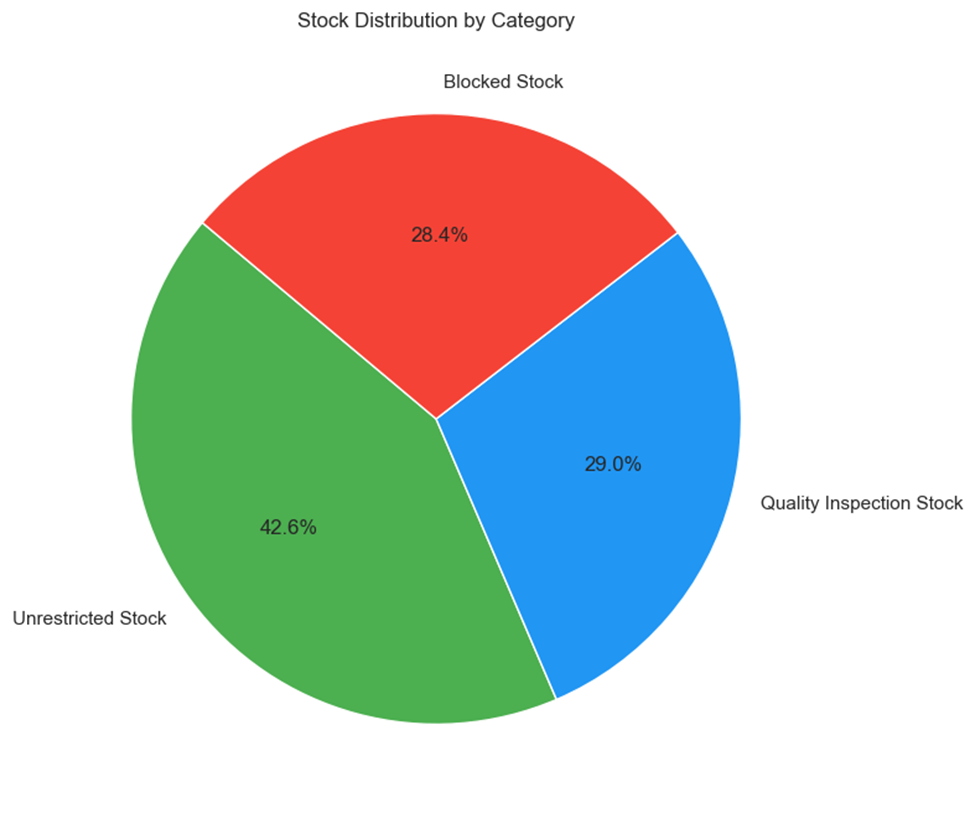
A pie chart showing the stock distribution percentages:
Conclusion
SAP offers great visual tools that work like a charm within their ecosystems, but in the practical world, when data must be pulled from other sources, Python is preferred. Also, notwithstanding the licensing costs, developers love Python for its flexibility, cost-efficiency, and advanced capabilities. Python offers easy and unparalleled customization through its vast ecosystem of libraries like Matplotlib, Seaborn, and Plotly. It quite easily integrates with machine learning libraries like TensorFlow and scikit-learn, making it ideal for predictive analytics and advanced modeling.
Unlike SAP tools, which are often restricted to predefined templates and require licenses, Python is open-source, free to use, and easily integrates with any ERP, including non-SAP systems, allowing developers to merge SAP data with external sources effortlessly. Python's scripting capabilities and scalability further make it ideal for automating tasks and handling large datasets efficiently.
Another reason why preference is given for Python is how it aligns with AI, data science, and future-focused applications. By leveraging Python, developers can build machine learning models to forecast trends, automate decision-making, and uncover insights that SAP tools cannot provide out of the box.
The thriving open-source community for Python ensures constant innovation, often not having to wait for a quarterly cycle or expensive SAP enhancement package update, which would cost millions. This innovation offers futuristic capabilities like natural language processing, computer vision, and scalable big data solutions. Hence, Python remains the go-to choice for developers aiming to push the boundaries of data visualization, analytics, and automation.
Opinions expressed by DZone contributors are their own.
Comments