Prometheus Monitoring for Microservices Using TIBCO
A tutorial for using Prometheus for monitoring microservices.
Join the DZone community and get the full member experience.
Join For FreeWe’re living a world with constant changes and this is even more true in the Enterprise Application world. I’ll not spend much time talking about things you already know, but just say that the microservices architecture approach and the PaaS solutions have been a game-changer for all enterprise integration technologies.
This time I’d like to talk about monitoring and the integration capabilities we have of using Prometheus to monitor our microservices developed under TIBCO technology. I don’t like to spend too much time either talking about what Prometheus is, as you probably already know, but in a summary, this is an open-source distributed monitoring platform that has been the second project released by the Cloud Native Computing Foundation (after Kubernetes itself) and that has been established as a de-facto industry standard for monitoring K8S clusters (alongside with other options in the Market like InfluxDB and so on).
Prometheus has a lot of great features, but one of them is that it has connectors for almost everything and that’s very important today because it is so complicated/unwanted/unusual to define a platform with a single product for the PaaS layer. So today, I want to show you how to monitor your TIBCO BusinessWorks Container Edition applications using Prometheus.
Most of the info I’m going to share is available in the bw-tooling GitHub repo, so you can get there if you need to validate any specific statement.
TIBCOSoftware/bw-tooling
Ok, are we ready? Let’s start!!
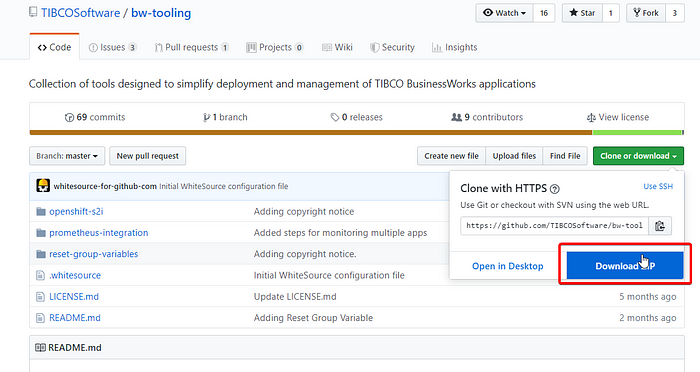
I’m going to assume that we already have a Kubernetes cluster in place and Prometheus installed as well. So, the first step is to enhance the BusinessWorks Container Edition base image to include the Prometheus capabilities integration. To do that we need to go to the GitHub repo page and follow these instructions:
- Download and unzip the Prometheus-integration.zip folder.
- Open TIBCO BusinessWorks Studio and point it to a new workspace.
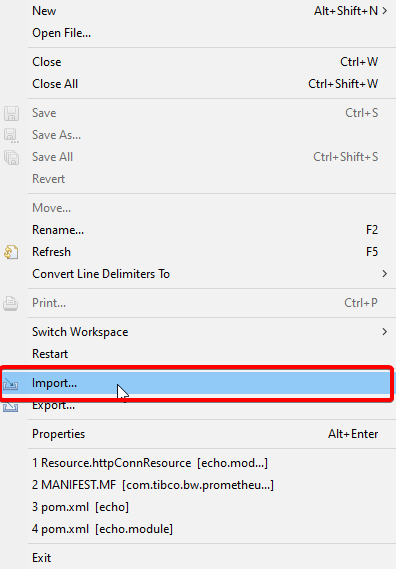
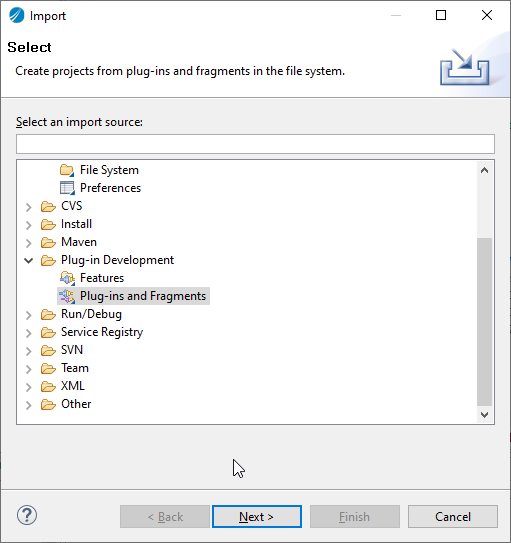
- Right-click in Project Explorer → Import… → select Plug-ins and Fragments → select Import from the directory radio button
- Browse it to prometheus-integration folder (unzipped in step 1)
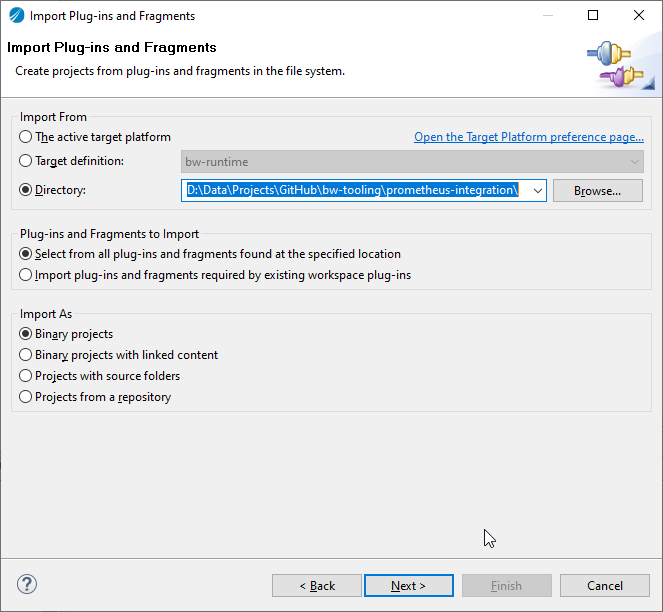
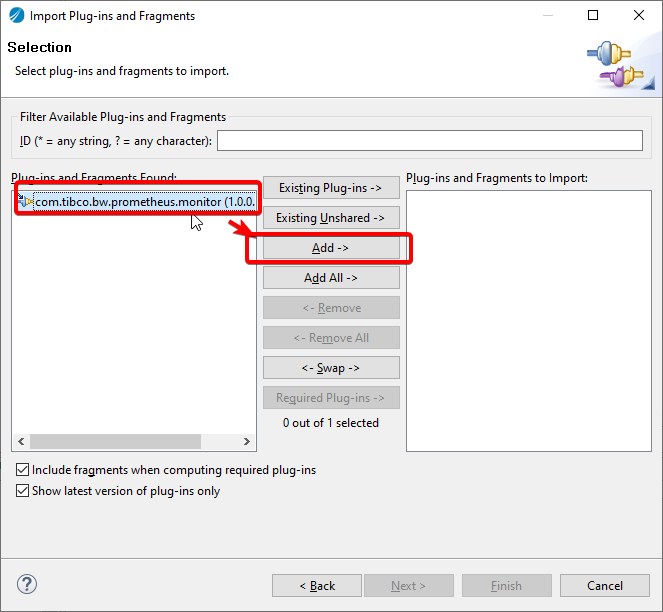
- Now click Next → Select Prometheus plugin → click Add button → click Finish. This will import the plugin into the studio.
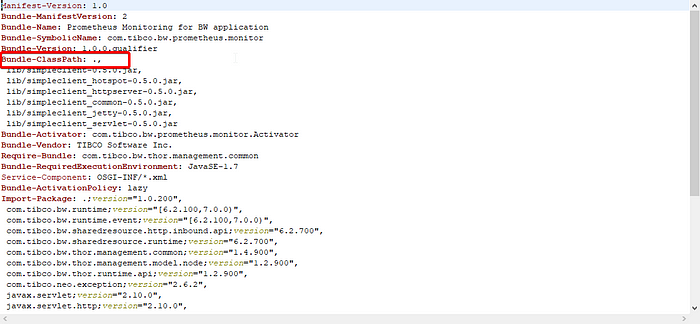
- Now, to create JAR of this plugin so first, we need to make sure to update com.tibco.bw.prometheus.monitor with ‘.’ (dot) in the Bundle-Classpath field as given below in META-INF/MANIFEST.MF file
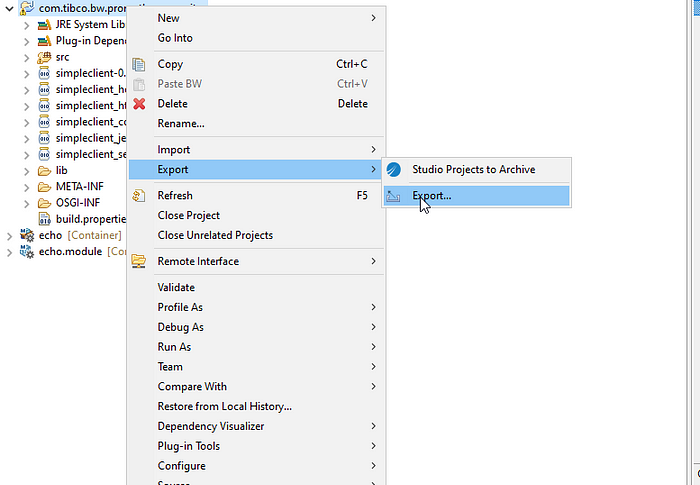
- Right-click on Plugin → Export → Export…
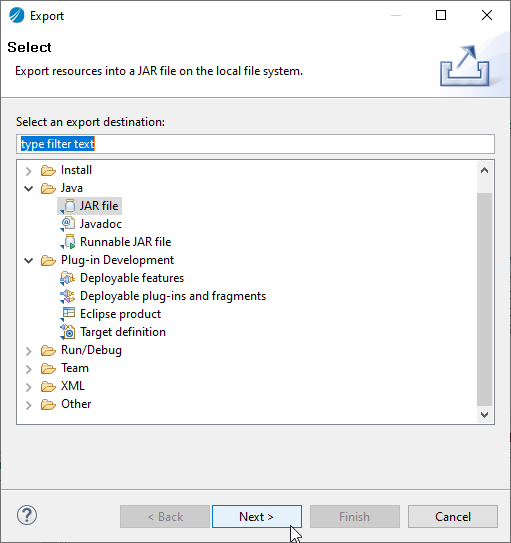
- Select type as JAR file click Next
- Now Click Next → Next → select radio button to use existing MANIFEST.MF file and browse the manifest file
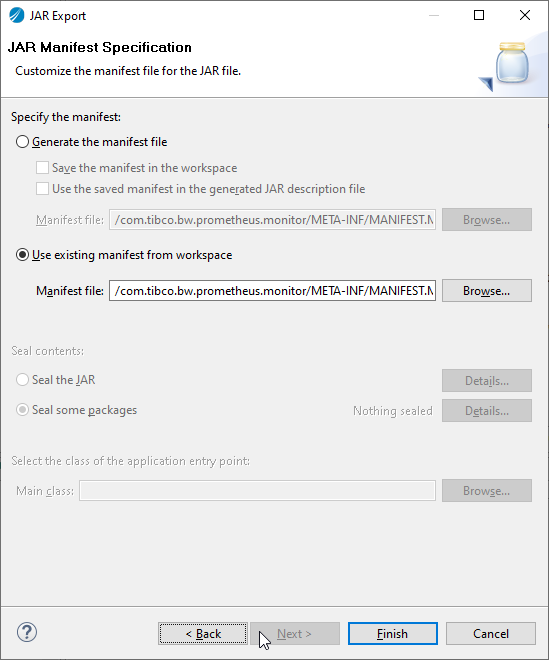
- Click Finish. This will generate Prometheus-integration.jar
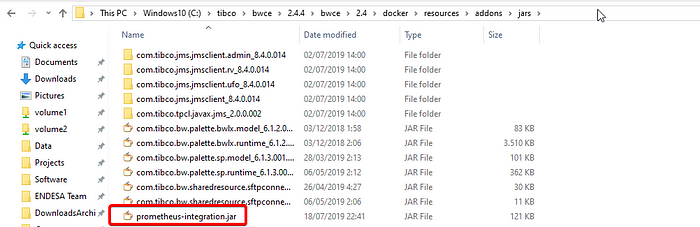
Now, with the JAR already created what we need to do is include it in your base image. To do that we place the JAR file in the <TIBCO_HOME>/bwce/2.4/docker/resources/addons/jar
And we launch the building image command again from the <TIBCO_HOME>/bwce/2.4/docker folder to update the image using the following command (use the version you’re using at the moment)
docker build -t bwce_base:2.4.4 .So, now we have an image with Prometheus support! Great! We’re close to the finish, we just create an image for our Container Application, in my case, this is going to be a very simple echo service that you can see here.
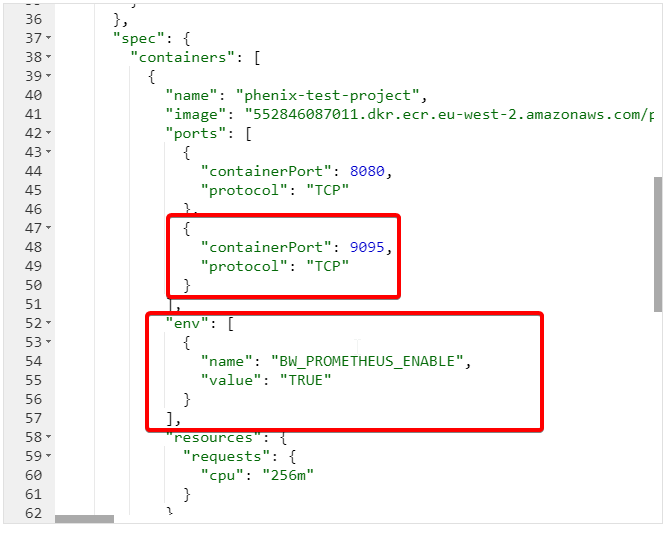
And we only need to keep these things in particular when we deploy to our Kubernetes cluster:
- We should set an environment variable with the BW_PROMETHEUS_ENABLE to “TRUE”
- We should expose the port 9095 from the container to be used by Prometheus to integrate.
Now, we only need to provide this endpoint to the Prometheus scrapper system. There are several ways to do that, but we’re going to focus on the simple one.
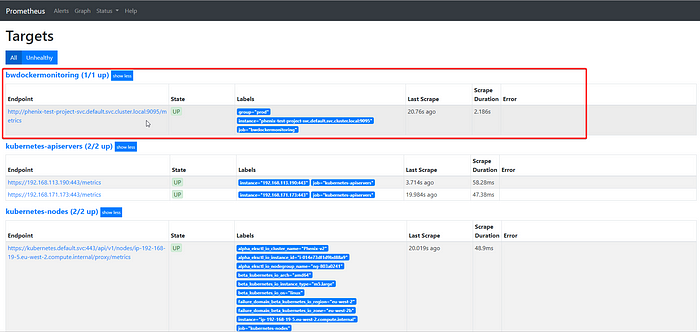
We need to change the prometheus.yml to add the following job data:
- job_name: 'bwdockermonitoring'
  honor_labels: true
    static_configs:
- targets: ['phenix-test-project-svc.default.svc.cluster.local:9095']
labels:
group: 'prod'
After restarting Prometheus we have all the data indexed in the Prometheus database to be used for any dashboard system.
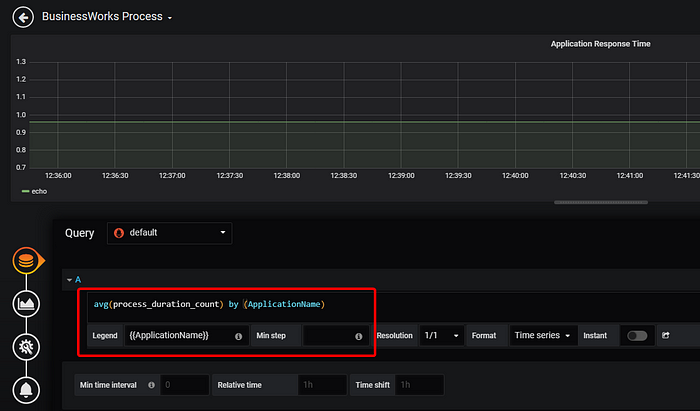
In this case, I’m going to use Grafana to do a quick dashboard.
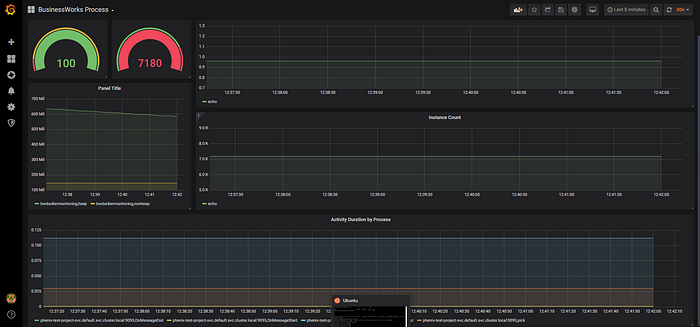
Each of these graph components is configured based on the metrics that are being scraped by Prometheus from the BusinessWork application
Published at DZone with permission of Alexandre Vazquez. See the original article here.
Opinions expressed by DZone contributors are their own.
Comments