Uber's Success With Apache Pinot: Cost Savings and Performance Boost
Uber migrated from Elasticsearch to Apache Pinot and saw a 70% reduction in costs, an 80% reduction in CPU cores, and a decrease in page load times and query timeouts.
Join the DZone community and get the full member experience.
Join For FreeFor a company like Uber, real-time data is the lifeblood of both their customer-facing and internal services. Customers rely on real-time data to get rides and grab food at their convenience. Internal teams also depend on up-to-date data to power the infrastructure behind their customer-facing applications, such as for their in-house tool that monitors mobile app crash analytics.
Uber migrated to Apache Pinot to power this in-house tool and experienced significant improvements compared to their previous analytics engine (Elasticsearch). By moving to Pinot, a true real-time analytics platform, Uber saw benefits including:
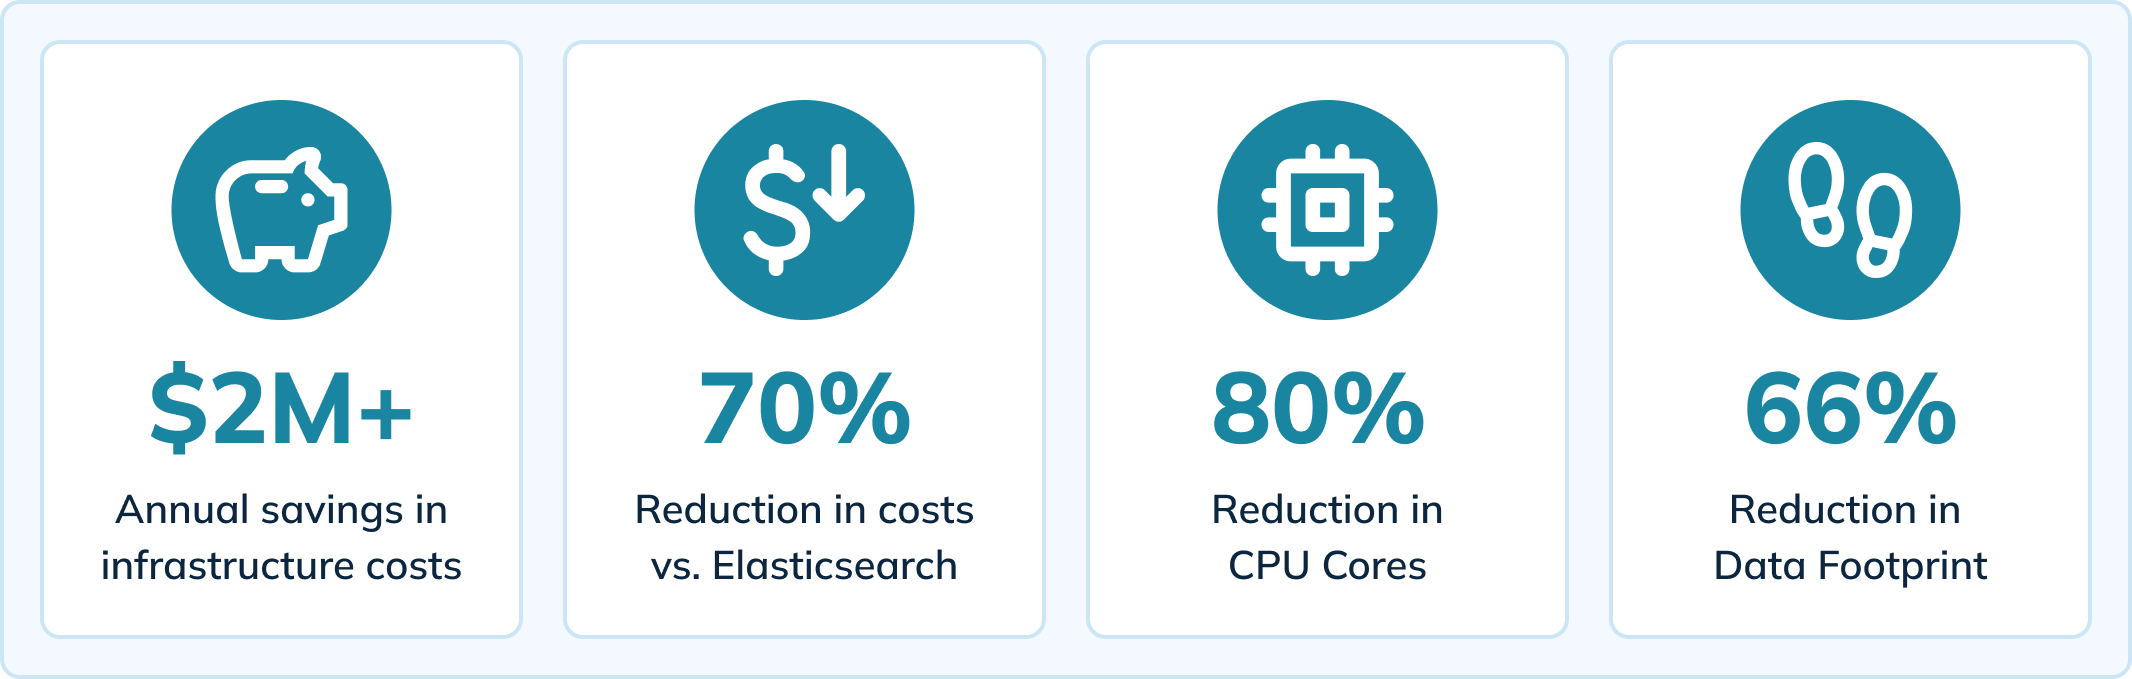
- 70% reduction in infrastructure costs (a savings of $2M+ yearly)
- 80% reduction in CPU cores
- 66% reduction in data footprint
- 64% reduction in page load times (from 14 seconds to under 5 seconds)
- Reduced ingestion lag to <10 milliseconds
- Decline in query timeouts and elimination of data loss issue

Watch Now
The content of this blog is based on an in-person meetup that featured Apache Pinot user stories. We also reference a blog from Uber’s engineering team that covers how they use Pinot to serve real-time analytics for mobile app crashes. Watch the meetup here:
Or continue reading to learn how Uber achieved these results with Apache Pinot.
How Uber Delivers Real-Time Analytics on Mobile App Crashes
Uber has an automated ingestion pipeline that tracks app crashes and collects investigative data. Some of this data is ingested into Apache Flink for transformations, which is then put back into Kafka topics for downstream consumption. These raw and processed events in Kafka are then consumed by Apache Pinot, which then runs analytical queries whose results are delivered to internal users via Grafana and internal visualization tools. Their pipeline ingests both real-time and offline data (not depicted) to create a complete view of users, known as hybrid tables in Apache Pinot.
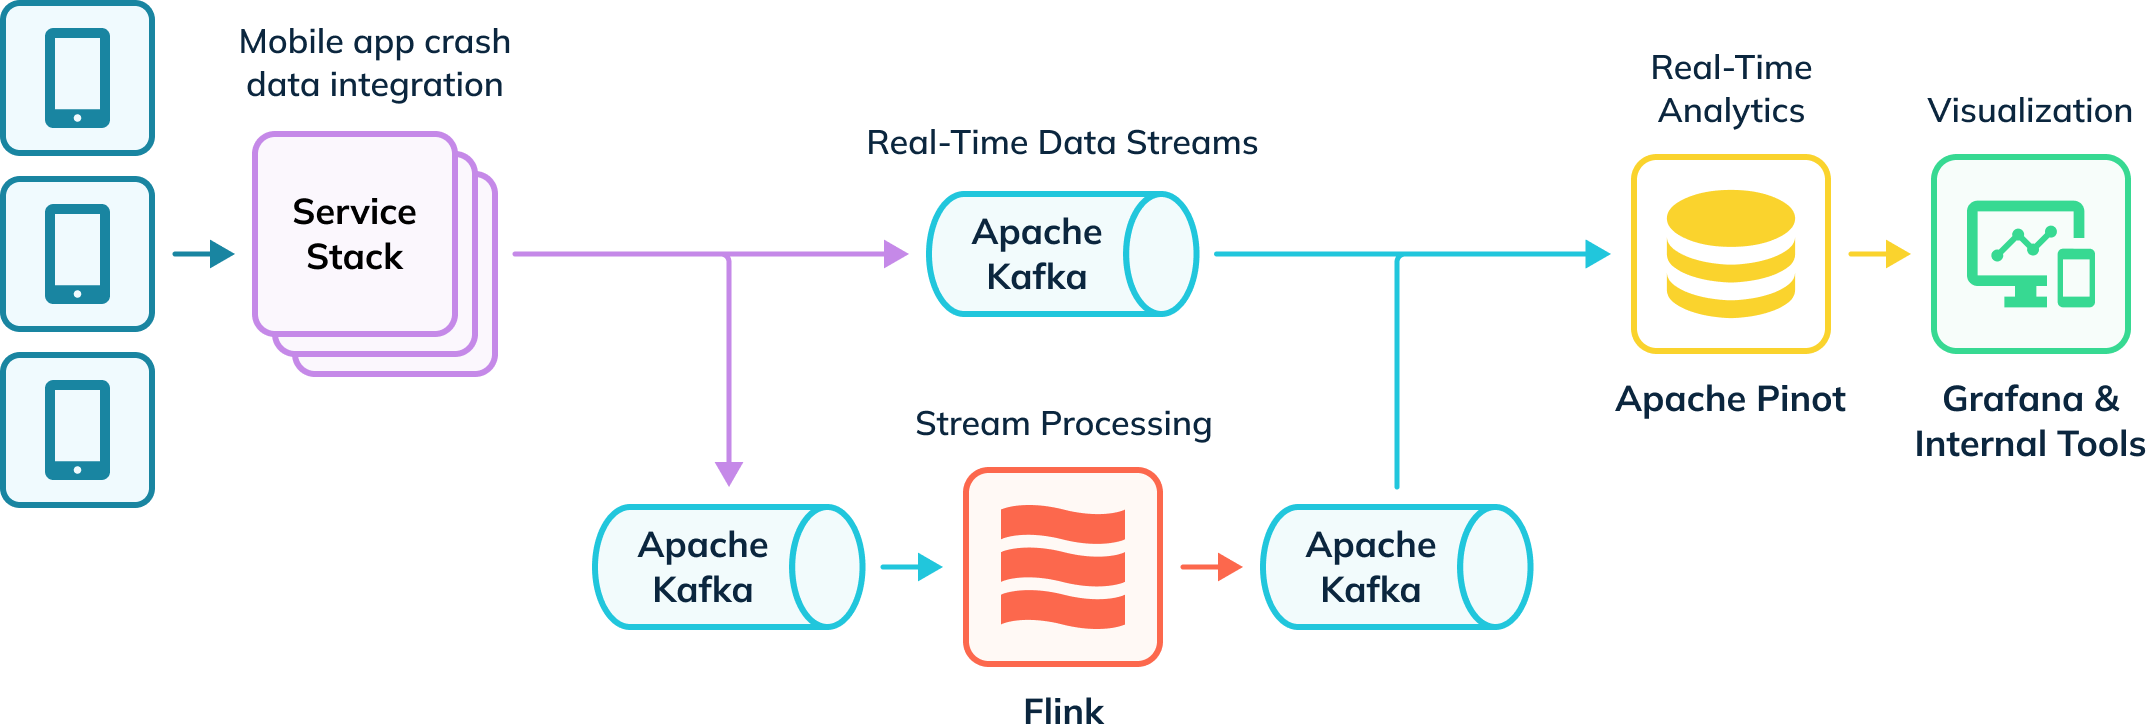
Real-Time App Crash Analytics With Apache Pinot
Uber releases ~11,000 new code and infrastructure changes every week, and they rely on an in-house tool (Healthline) to help detect and solve crash issues. Healthline enables Uber to better measure and meet its Mean Time To Detect (MTTD). For example, they might roll out a new feature that causes unexpected app crashes and must be able to quickly target the source of the crashes by digging into crash data.
The dashboard below shows a week’s worth of crash data for one mobile app and one version of the operating system. In this example, session events occur up to hundreds of thousands of times per second, and crashes measure between 15,000 to 20,000 events per second. Uber combines these metrics to calculate the fatal-free rate, which indicates the health of the application (the goal is to be as close to 100% as possible).
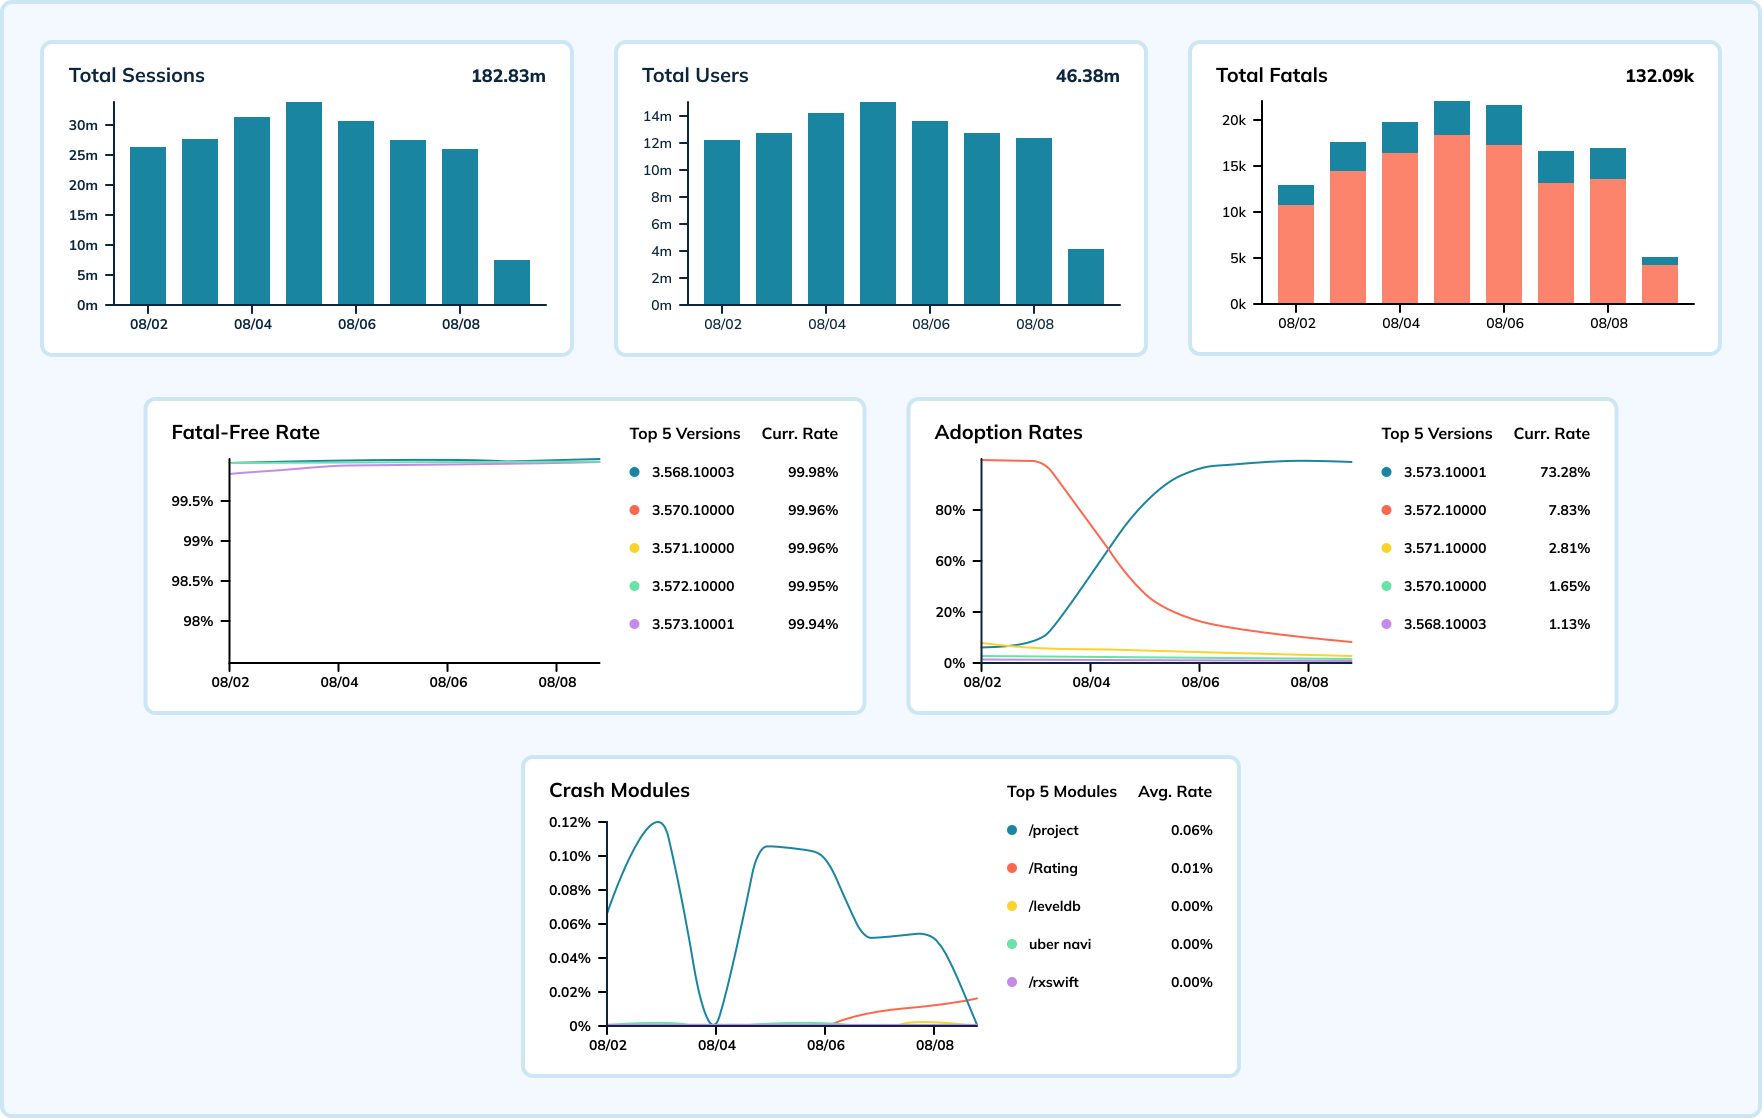
With Elasticsearch, a general-purpose search engine, spikes in crash rates would cause ingestion lag and delay the team’s response to identifying issues. By moving to Apache Pinot, which is designed specifically for real-time analytics at a massive scale, the team has seen a decline in the number and severity of ingestion lags.
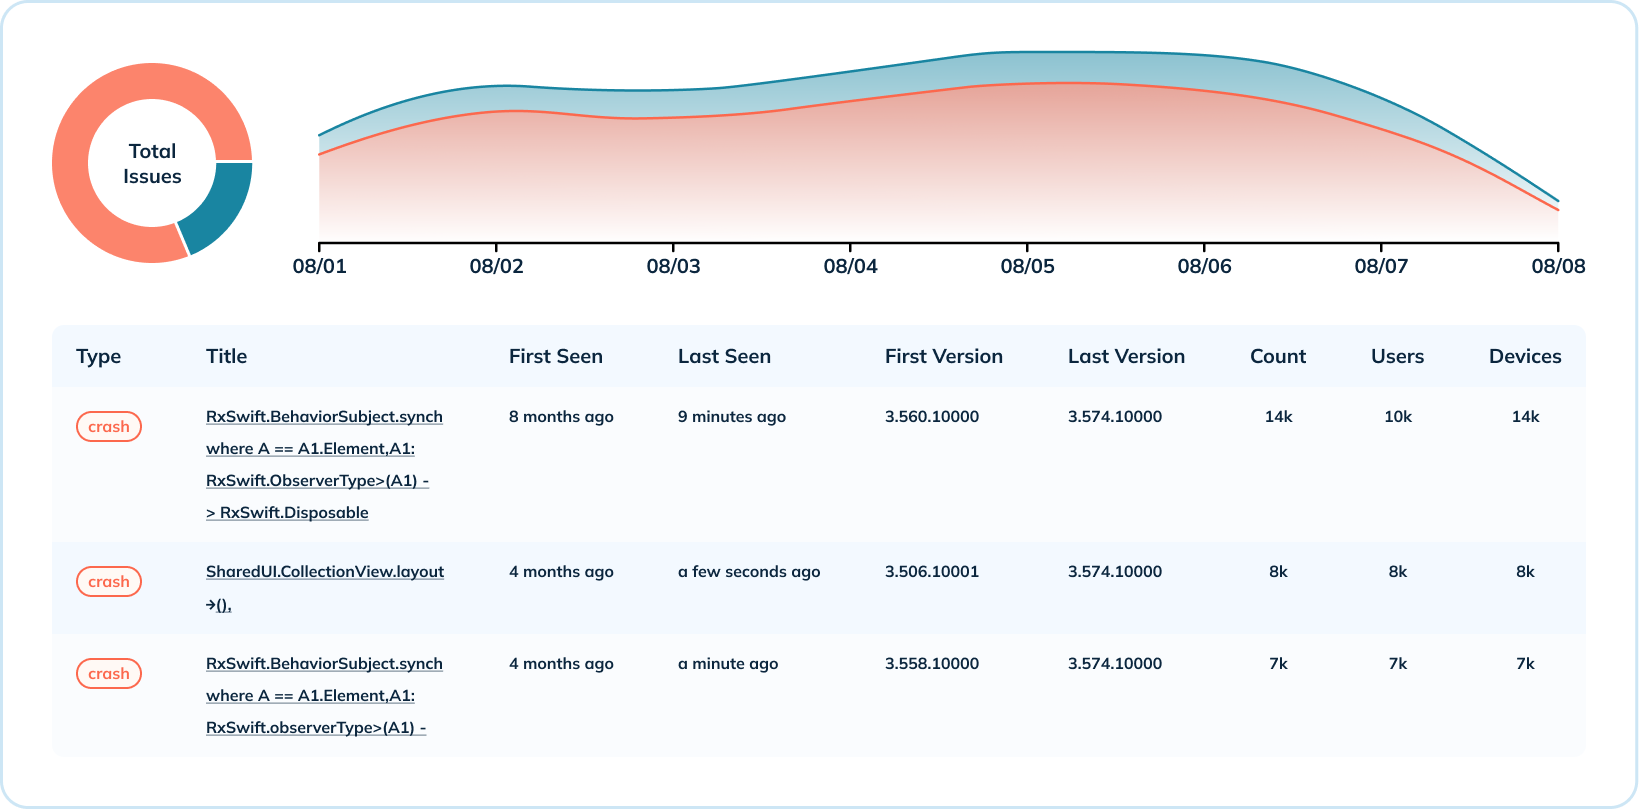
Analyzing In-Depth Crash Data
In addition to the high-level overview of crash data, Uber also provides in-depth crash-level analytics. They aggregate crash metrics across various dimensions such as the number of crashes per operating system and per version, and the distribution of crashes per version. This use case leverages several Pinot indexes (range, inverted, and text) to share when a type of crash has occurred, which versions are impacted, the number of occurrences, and the number of users and devices affected.
For the in-depth analysis, it was critical that Uber have text search capabilities to read crash error messages. Pinot’s text index is built on top of Lucene and gives them the ability to search crashes by crash message, class name, stacktrace, and more.
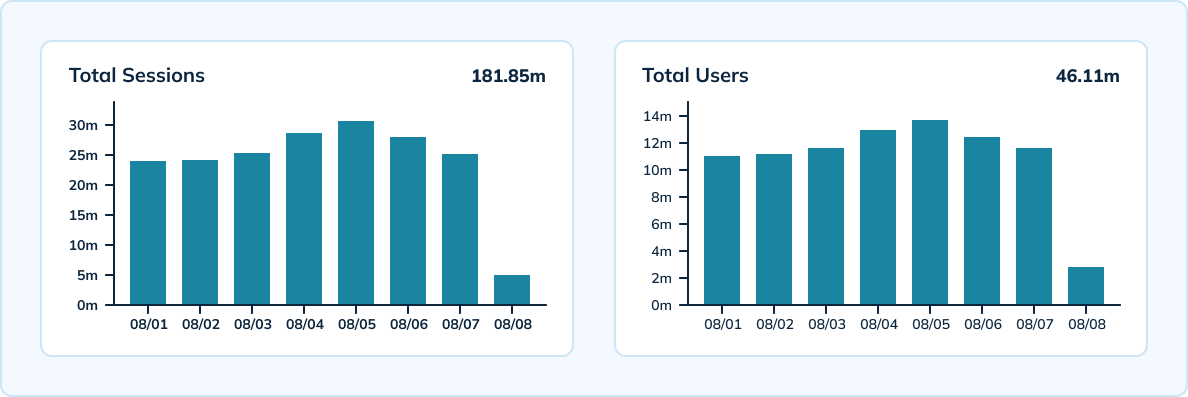
Measuring Sessions at Scale
Uber also uses Pinot to measure unique sessions by device, version, operating system, and hour at scale. Pinot offers real-time processing with high-scale throughput capable of ingesting Uber’s 300,000 analytic events per second. The team has a hybrid setup that includes a real-time table with 10-minute granularity and 3-day data retention, as well as an offline table with hourly and daily granularity and 45-day data retention.
Leveraging Apache Pinot’s HyperLogLog allowed the team to reduce the number of events being stored and perform fewer unique aggregations across events. Pinot also provided very low latencies — under 100 milliseconds for p99.5 latency.
Infrastructure Cost Savings
By Uber’s calculations, they’ve saved more than $2 million in annual infrastructure costs by migrating to Pinot. Their Pinot setup led to a 70% decrease in infrastructure costs compared to Elasticsearch. They also saw an 80% reduction in CPU cores and a 66% decrease in their data footprint.
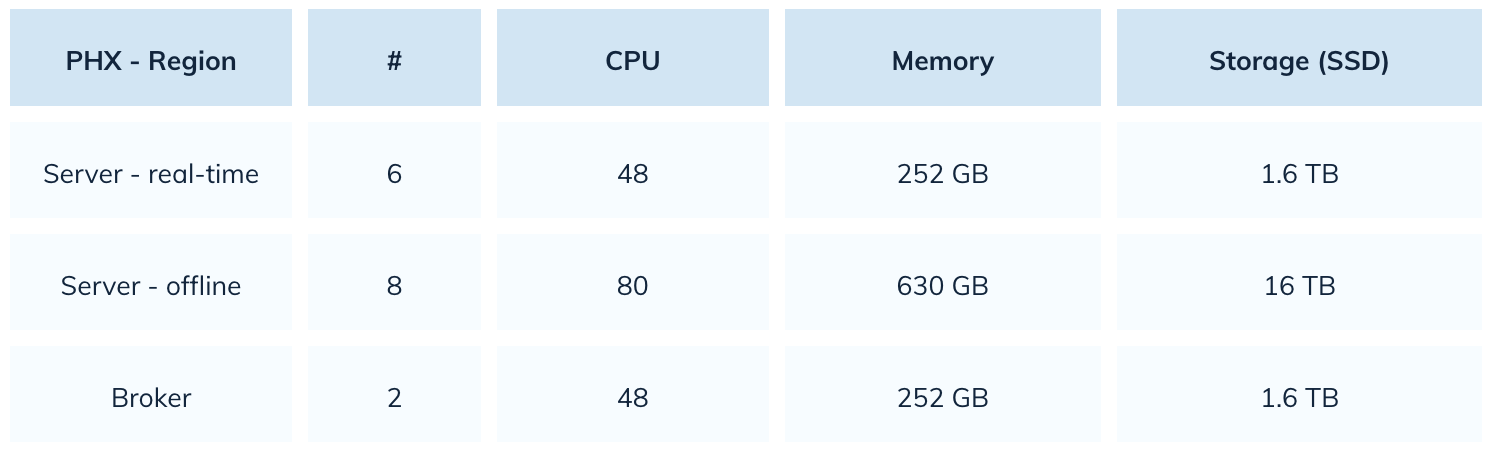
With Elasticsearch, Uber was using 22,000 cores of CPU. With Pinot, they’ve reduced that number by 80%. Here’s a snapshot of their Pinot setup:
Improved Query Performance and User Experience
With Apache Pinot, Uber is able to deliver a better user experience with faster page loading and improved reliability. Migrating to Pinot reduced page load times by 64%, from 14 seconds to under 5 seconds. Pinot also has a better tolerance for spikes in load, leading to quicker lag recovery. Even if the team sees an ingestion lag, Pinot is able to recover quickly within a few minutes.
Compared to Elasticsearch, Pinot has also shown significant improvements across query timeouts and data loss. If a disaster in a mobile application occurred while using Elasticsearch, queries pertaining to that index would time out. Uber solved this issue with Pinot by controlling for segment size. The team also has no data loss issues with Pinot, compared to frequent data issues when Elasticsearch dealt with increased ingestion throughput.
The Next Iteration of Uber’s Pinot Setup
Next up, Uber plans to migrate to native text indexing for their mobile crash data. Their mobile crash data contains a lot of structured data, making it feasible for the team to migrate all of their use cases to native text indexes. This transition will provide cost savings from data storage and reduce the time spent on querying data.
Uber Isn’t the Only Organization Seeing Success by Migrating From Elasticsearch to Pinot
Uniqode (formerly Beaconstac) saw a 10x improvement in overall query performance by switching from Elasticsearch to Pinot. Cisco Webex also migrated their real-time analytics and observability to Pinot after facing high latencies. The Webex team found that Apache Pinot provided 5x to 150x lower latencies than Elasticsearch.
Published at DZone with permission of Kristin Crosier. See the original article here.
Opinions expressed by DZone contributors are their own.
Comments