Simulating and Troubleshooting OOMError in Kotlin
As we look at simulating and troubleshooting performance problems in Kotlin, learn how to simulate the java.lang.OutOfMemoryError: Java Heap space problem.
Join the DZone community and get the full member experience.
Join For FreeContinuing in this troubleshooting series of simulating and troubleshooting performance problems in Kotlin, let’s now discuss how to simulate the java.lang.OutOfMemoryError: Java Heap space problem. java.lang.OutOfMemoryError: Java Heap space will be thrown by the application when it generates more objects than the maximum configured heap size.
Kotlin OutOfMemoryError Program
Here is a sample Kotlin program, which generates the java.lang.OutOfMemoryError: Java Heap space problem.
package com.buggyappclass OOMDemo {var myMap = HashMap<Any, Any>() @Throws(Exception::class)fun start() {while (true) {var counter = 1000000;myMap["key$counter"] = ("Large stringgggggggggggggggggggggggggggg"+ "ggggggggggggggggggggggggggggggggggggggggggggggggggggg"+ "ggggggggggggggggggggggggggggggggggggggggggggggggggggg"+ "ggggggggggggggggggggggggggggggggggggggggggggggggggggg"+ "ggggggggggggggggggggggggggggggggggggggggggggggggggggg"+ "ggggggggggggggggggggggggggggggggggggggggggggggggggggg"+ "ggggggggggggggggggggggggggggggggggggggggggggggggggggg"+ "ggggggggggggggggggggggggggggggggggggggggggggggggggggg"+ "ggggggggggggggggggggggggggggggggggggggggggggggggggggg"+ "ggggggggggggggggggggggggggggggggggggggggggggggggggggg"+ "ggggggggggggggggggggggggggggggggggggggggggggggggggggg"+ "ggggggggggggggggggggggggggggggggggggggggggggggggggggg"+ counter)++counter}}}
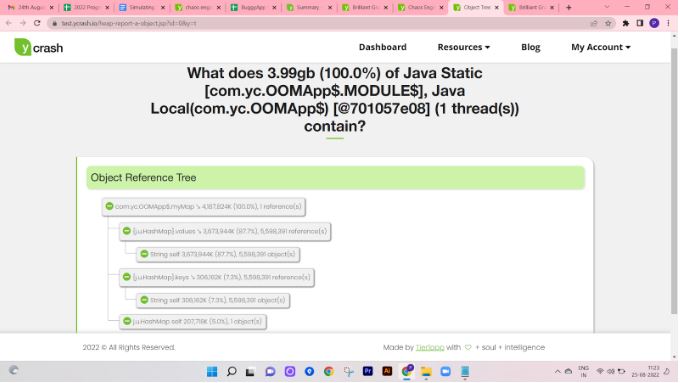
This Sample Kotlin program contains an OOMDemo class. This class contains the start() method. This method keeps inserting records into the HashMap infinitely. When HashMap grows beyond the maximum heap size (i.e., -Xmx), the java.lang.OutOfMemoryError: Java Heap space will be thrown. The below diagram illustrates the records present in the HashMap.

HashMap causing OutOfMemoryError
When we executed the above program, as expected, java.lang.OutOfMemoryError: Java heap space was thrown in a few seconds.
Even though this is a hypothetical example that simulates java.lang.OutOfMemoryError, this is how a typical memory leak happens in enterprise applications. When records get inserted into a data structure (like HashMap, ArrayList, Set, etc.) and never get removed, java.lang.OutOfMemoryError will be thrown.
How to Troubleshoot OutOfMemoryError
You can diagnose OutOfMemoryError either through a manual or automated approach.
Manual Approach
In the manual approach, you will need to capture a heap dump as the first step. A heap dump is a snapshot of memory and it shows all the objects in memory, the values contained by those objects, and their references. You can capture heap dump using one of the 7 approaches given here. But an important criterion is that you need to capture the heap dump right before OutOfMemoryError is thrown. If you are going to capture a heap dump after OutOfMemoryError has occurred, then leaking objects can get garbage collected, and it will become hard (or even impossible) to diagnose the problem. Once heap dumps are captured, you need to import the heap dumps from your production servers to your local machine. From your local machine, you can use heap dump analysis tools like jHat or HeapHero to analyze the heap dumps.
Automated Approach
You can also use the yCrash open source script, which would capture 360-degree data (GC log, 3 snapshots of thread dump, heap dump, netstat, iostat, vmstat, top, top -H, etc.) from your application stack within a minute and generate a bundle zip file. You can then either manually analyze these artifacts or upload them to the yCrash server for automated analysis.
We used the automated approach. Once the captured artifacts were uploaded to the yCrash server, it instantly generated the below root cause analysis report highlighting the source of the problem.
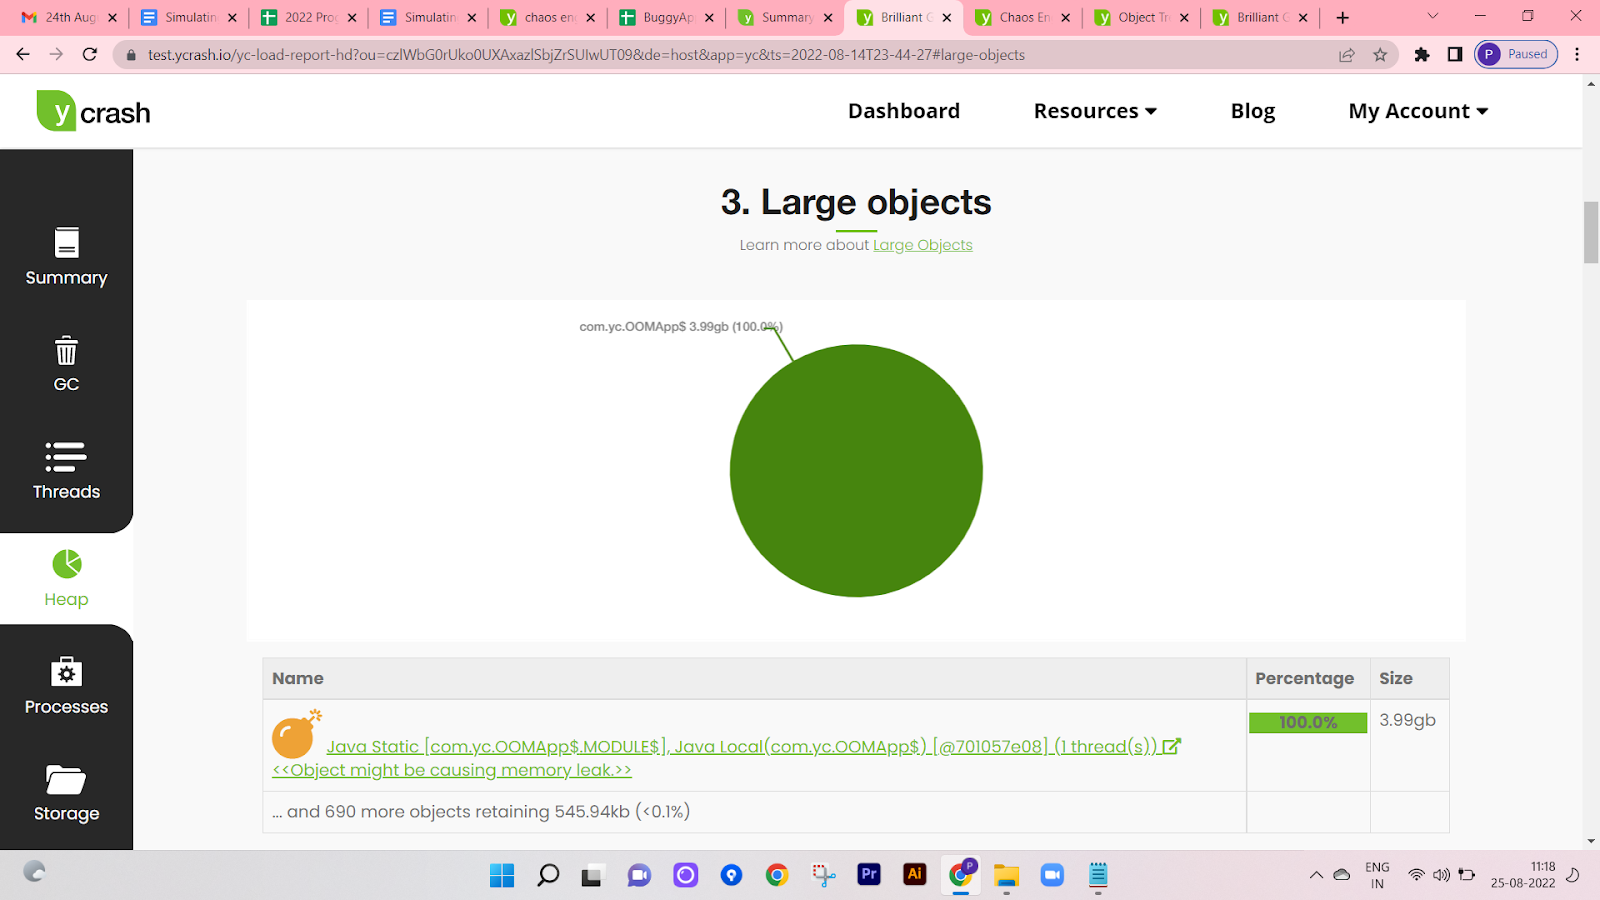
yCrash tool pointing out the root cause of OutOfMemoryError
Above is the heap dump analysis report from the tool which precisely points out that the HashMap (i.e., myMap) data structure present in the com.yc.OOMApp to be the root cause of the memory leak. Also, the tool is reporting that this HashMap is holding 100% of memory. Equipped with this information, one can easily go ahead and fix the problematic code.
Video
To see the visual walk-through of this post, click below:
Published at DZone with permission of Ram Lakshmanan. See the original article here.
Opinions expressed by DZone contributors are their own.
Comments