

From Symptoms to Solutions: Troubleshooting Java Memory Leaks and OutOfMemoryError
Learn to detect, isolate, and fix Java memory leaks and OutOfMemoryError with practical tips, tools, and heap dump analysis for better performance.
 CORE
·
CORE
·
Join the DZone community and get the full member experience.
Join For FreeTroubleshooting memory problems, such as memory leaks and OutOfMemoryError, can be an intimidating task even for experienced engineers. In this post, we would like to share simple tips, tools, and tricks so that even a novice engineer can isolate memory problems and resolve them quickly.
What Are Common Signs of a Java Memory Leak That Might Lead to OutOfMemoryError?
Before your application throws an OutOfMemoryError, it usually gives you a few warning signs. If you catch them early, you can prevent downtime and customer impact. Here’s what you should keep an eye on:
1. Gradual Memory Increase Over Time
Have you noticed your application’s heap memory slowly creeping up, even after garbage collection? In a healthy setup, memory usage goes up and down in a “saw-tooth” pattern. But if your memory keeps growing and doesn’t drop back down after GC, it could be a sign of a memory leak. Eventually, full GCs might run more often but free up very little memory, meaning objects are being held when they shouldn’t be.
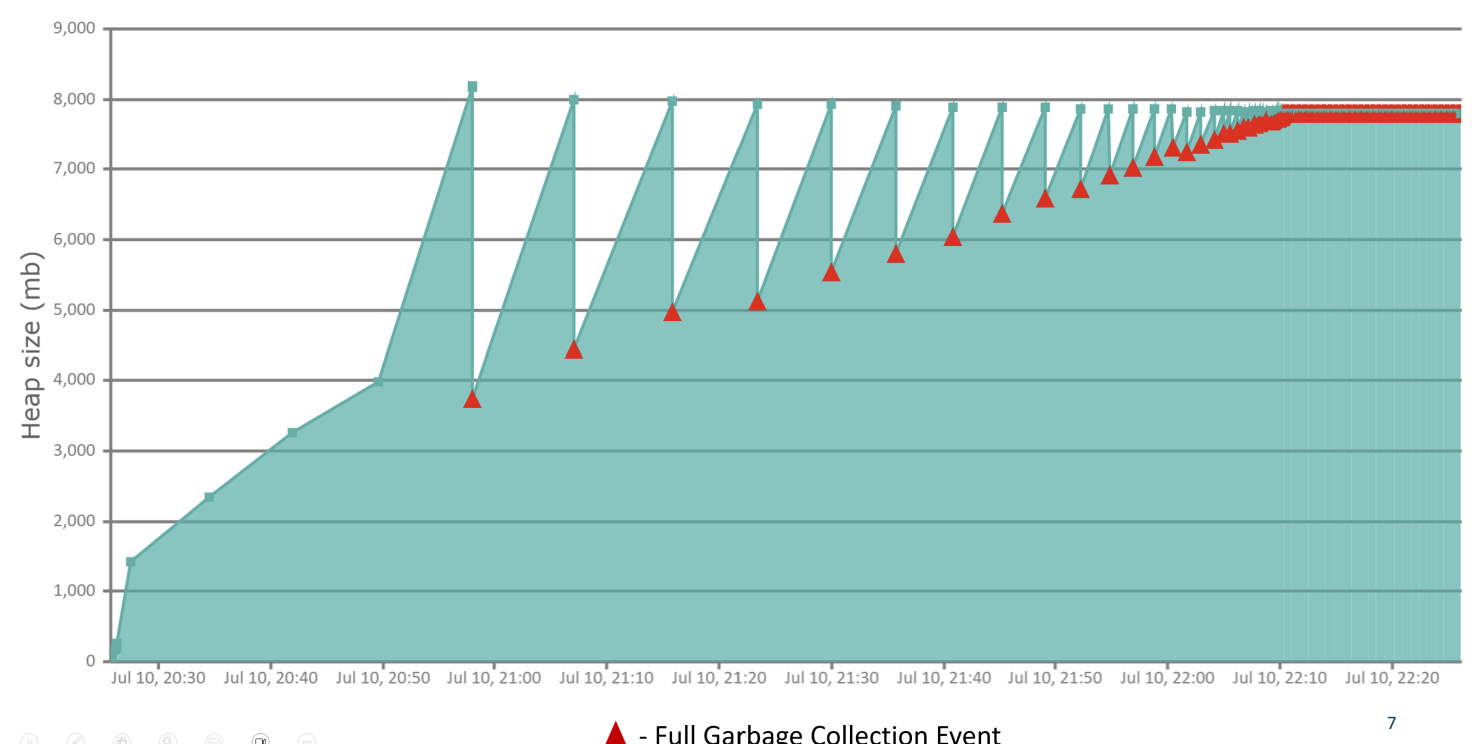
Fig: GC behavior of an application suffering from a memory leak
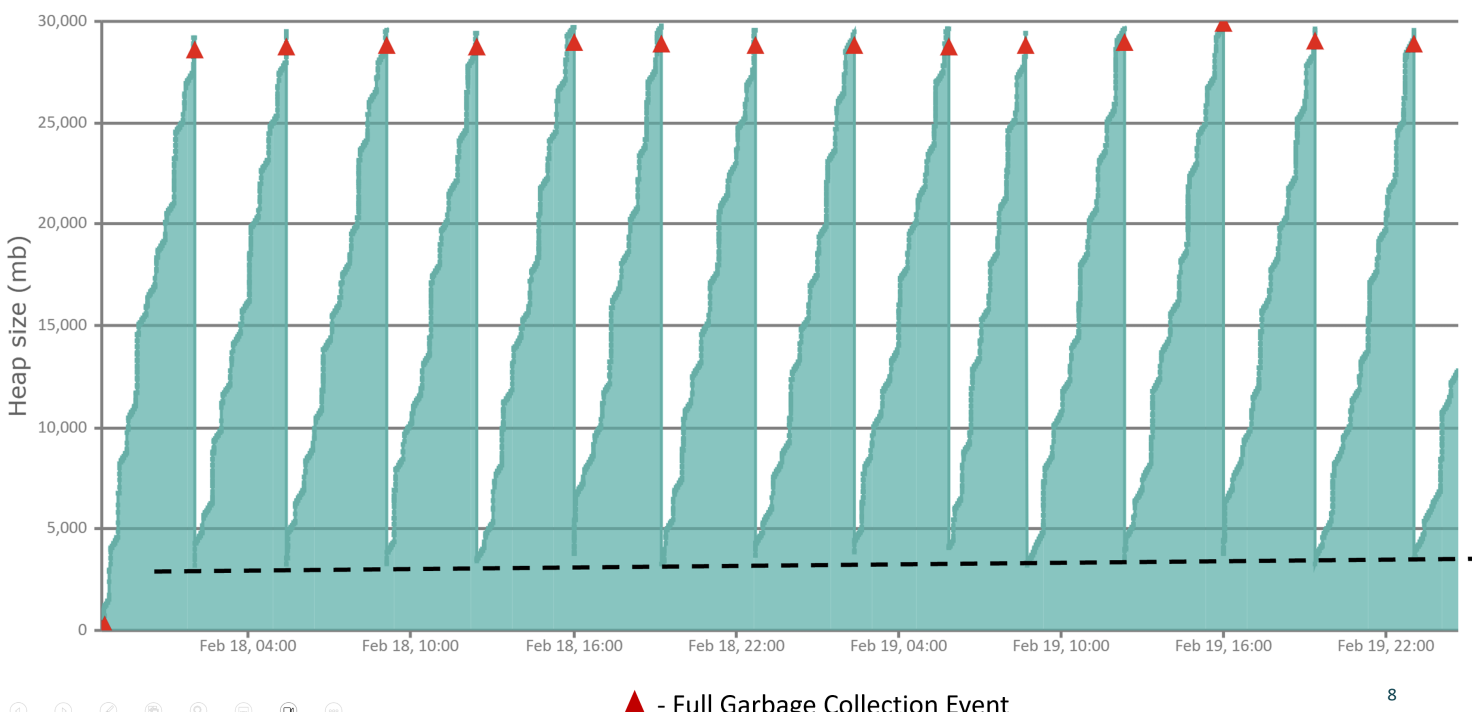
Fig: GC behavior of a healthy application (no increase in Heap usage)
2. CPU Spikes
Is your CPU usage suddenly spiking without warning? As your app begins to leak memory, the JVM responds by triggering garbage collection more often. GC is a CPU-heavy process; it scans memory to identify and remove unused objects. That added workload can cause sharp spikes in CPU usage, sometimes pushing it all the way to 100%.
3. Degraded Response Time and Timeouts
If your app is suddenly slowing or timing out, frequent GC pauses might be the reason. While GC is running, your application’s threads will be paused. This can delay transactions, trigger failed health checks, or even cause user requests to time out. The app is technically up, but it’s not able to respond the way it should.
4. OutOfMemoryError
If memory runs out and the JVM can’t recover enough space, it will throw an OutOfMemoryError. When you see this, it’s usually too late to avoid impact.
If any of this sounds familiar, it might be time to take a much closer look. You can learn more in this post: Symptoms of Memory Leak.
How Can I Identify Memory Leaks by Analyzing a Heap Dump?
Memory leak isolation is often made to appear complicated. But in most business applications, you can isolate leaks by following these three simple steps:
1. Automatic Memory Leak Detection
Heap dump analysis tools use machine learning algorithms to detect memory leaks automatically. These leaks are highlighted at the top of the report, as shown in the figure below:

Each problem statement reported in this section contains hyperlinks. Clicking on them will give you deep insights like what objects are leaking, how much memory they consume, and what references are keeping them alive. This makes identifying memory leaks faster and easier.
2. Dominator Tree
The Dominator Tree section lists the largest memory-holding objects in your application. Leaking objects often appear at the top because they retain a significant portion of the memory. Use the ‘Incoming References‘ feature to find out who is keeping these objects alive. You can also explore ‘Outgoing References‘ to see their children and the raw data they contain. Sometimes, raw data often points directly to the origin of the leak.
3. Growing Objects
You can also use the Class Histogram to spot memory leaks. Take 2–3 heap dump snapshots at different times and compare their histograms. Objects whose count keeps growing consistently across snapshots often point to a memory leak. Note: Make sure these snapshots are taken during similar load patterns, i.e., during the same load test or under comparable traffic conditions in production. Otherwise, you might misinterpret normal usage growth as a leak.
Once I’ve Identified a Memory Issue, What Are the Next Steps to Fix It?
Finding the memory problem is only half the job. The next steps are about fixing it safely and verifying that the issue is resolved. Below are the next steps you can pursue:
1. Isolate the Root Cause
Isolate the root cause of the memory issue using Dominator Tree, Class Histogram, and GC Root analysis. Understand whether the issue is caused by an unbounded cache. Unclosed listeners? ThreadLocal misuse? Static references? Knowing exactly why the object is retained helps you apply the right fix.
2. Reproduce the Problem in a Controlled Environment
If possible, reproduce the memory behavior in a lower environment (like staging or local) using similar traffic or test scenarios. This helps to validate the fix and ensures you don’t unintentionally introduce regressions.
3. Apply the Fix in Code or Configuration
Once the root cause is confirmed, make the necessary code or config changes. Common fixes include:
- Limiting the size of caches or using eviction policies
- Removing unused static references
- Deregistering listeners or callbacks
- Avoiding unnecessary object retention in long-lived collections or sessions
- Replacing poorly implemented singleton patterns
4. Validate the Fix
Once the fix is applied, run the application again under a similar load and capture a new heap dump. Compare it with the earlier one, look for signs of improvement such as reduced object count, lower retained size, and absence of the previously identified leak suspects.
5. Monitor in Production
Fixes should be monitored in production over time to ensure it is effective. Keep an eye on the key memory KPIs like heap usage trend, GC activity, frequency of full GCs, and application response times. Tools can help you track and validate the impact of the fix in real-world scenarios.
Conclusion
Memory leaks and OutOfMemoryError can silently drain your application’s performance and bring it to a grinding halt. By analyzing heap dumps using tools the right way, you can spot what’s going wrong, where memory is getting stuck, and how to resolve it effectively.
Published at DZone with permission of Ram Lakshmanan. See the original article here.
Opinions expressed by DZone contributors are their own.
Comments