Unlocking Data Dynamics: Understanding the Power of Pivoting and Un-Pivoting
Gain insight into the fundamental concepts of Pivot and Un-pivot, and uncover why Ottava enables you to work directly with pivoted data.
Join the DZone community and get the full member experience.
Join For FreeIn the realm of data manipulation and analysis, the terms "pivoting" and "un-pivoting" play crucial roles in transforming raw data into meaningful insights.
These operations are fundamental to reshaping datasets for better visualization, analysis, and interpretation. In this blog post, let's kick back, sip some coffee, and demystify these concepts that make your data dance to the right tunes.
Pivoting Data and Why Does It Matter?

Pivoting a column means aggregating identical values in that column, resulting in a new table orientation. The initial step involves sorting the table in ascending order based on the values present in the first column.
This transformative process revolves around the art of rotating or transposing data, seamlessly converting rows into columns and vice versa. The beauty of pivoting lies in its ability to bring order to the chaos of scattered information.
Picture a scenario where dates are laid out in rows, and sales figures are scattered across columns in a dataset. Pivoting enables you to elegantly rearrange the data landscape. With a simple pivot, dates effortlessly transform into columns, aligning perfectly with their corresponding sales figures.
Within the domain of data analysis, leveraging pivoted data empowers you to effortlessly employ aggregation and filtering techniques. Embracing the prowess of Pivot not only optimizes your data for analysis but also clears the path for a more streamlined and user-friendly data entry process.
Key Characteristics of Pivoting
- Aggregate Values: Pivoting is often used to aggregate or summarize data. By grouping and restructuring information, it becomes simpler to perform calculations or generate summary statistics.
- Improved Readability: Pivoting can enhance the readability of data, especially when dealing with time series or categorical information. This makes it easier for analysts and decision-makers to identify trends or patterns.
- Charting and Visualization: Many data visualization tools prefer data in a pivoted format. Pivoted data is often more compatible with charting libraries and makes it straightforward to create visual representations of trends and comparisons.
Un-Pivoting Data and What Does It Even Mean?
You’ve heard of pivoting data, but have you ever heard of un-pivoting before?
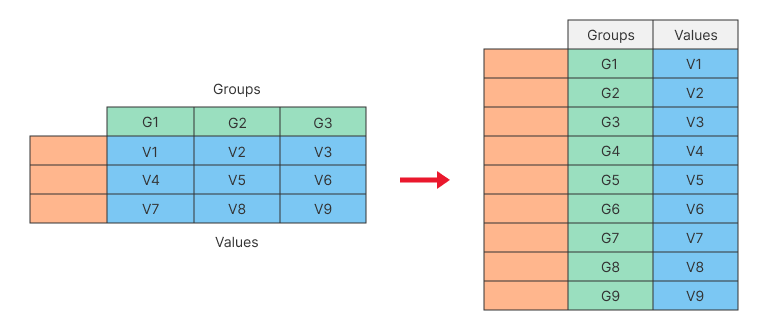
In data manipulation, pivoting restructures data to enhance analysis, but its counterpart, un-pivoting, performs the inverse function. Un-pivoting (sometimes called flattening the data) takes data from a summarized or aggregated state back to its original, more detailed form. This reversal is particularly valuable when dealing with pre-aggregated data designed for reporting purposes.
The significance of un-pivoting becomes apparent when considering the diverse angles from which data analysis can be approached. While pivoted data provides a convenient view for specific analyses, the un-pivoted form is essential for exploring data from various perspectives. Despite its importance, working with un-pivoted data can be a messy and intricate process.
To illustrate, creating charts or reports often necessitates the use of un-pivoted data. This step is crucial for delving into the nuances of information, revealing patterns, and facilitating a comprehensive understanding of the dataset. In essence, while pivoting optimizes data for specific analyses, un-pivoting is the key to unlocking the full analytical potential, offering a more granular and nuanced view of the underlying information.
Key Characteristics of Un-Pivoting
- Detail Retrieval: Un-pivoting allows users to retrieve detailed information from aggregated datasets. For instance, if sales data is pivoted by product categories, un-pivoting can bring back the individual transactions associated with each category.
- Database Normalization: Un-pivoting is an essential step in the normalization of databases. By breaking down aggregated data into its atomic components, databases can be structured more efficiently.
- Flexible Analysis: Unpivoted data provides a level of granularity that is crucial for certain types of analysis. Users can explore individual data points and relationships that might be lost in a pivoted summary.
Why Ottava Chose To Work With Pivoted Data
By this time, we hope you already spent some time working with Ottava and realized what we’ve done with the data entry method; if you are new to Ottava, you can find out more about this no-code SaaS data analysis and visualization platform at ottava.io.
Ottava's unique feature allows users to input raw data directly in a pivoted format (multi-dimensional summarized tables) rather than the conventional tabular data. This choice is driven by our understanding of the benefits and efficiency that such an approach brings to data management. The key reason Ottava enables users to work with pivoted data directly is to mitigate data entry errors that can arise from manual input.
Moreover, Ottava seamlessly executes the un-pivoting command in the background, a crucial step often required before diving into data analysis. By automating this process, Ottava spares users the complexities of un-pivoting data, allowing them to focus on working directly with the pivoted data and the charts we've meticulously crafted.
The already aggregated data in Ottava opens up a world of possibilities, presenting users with a curated collection of ready-to-use charts and visualizations tailored to this format. This not only simplifies the creation of dashboards and reports but also ensures that users can effortlessly transform their data into impactful visual representations. This aligns perfectly with Ottava's commitment to delivering a user-friendly experience, reducing human errors, and unlocking the full potential of data by transforming raw information into actionable insights.
Published at DZone with permission of Vicky Pham. See the original article here.
Opinions expressed by DZone contributors are their own.
Comments