Usage of Sets and Dense Rank While Developing Top N Reports in Tableau
While developing Tableau reports with dynamic parameters like Top N, it’s very important to understand the order of operations in Tableau.
Join the DZone community and get the full member experience.
Join For FreeThere is a whole lot of information on ranks in Tableau. While developing Tableau reports with dynamic parameters like Top N, it’s very important to understand the order of operations in Tableau.
In the below article from Tableau, the order of operations was explained in more detail. Tableau’s Order of Operations.
I would like to share here one case where sets can help along with dense rank for a Top N report. This is a very simple sample case to understand the usage.
An organization, “ABC,” is very sustainability centric and focuses more on contributing to society using “Sustainability Development Goals (SDG)” as guidelines. The organization “ABC” has branches all over the world, and huge budgets were allocated to its “Corporate Social Responsibilities (CSR)” activities. The CSR management team showed interest in getting more insights about CSR activities and how budgets were flowing in contributing to different SDGs.
This is a very straightforward question to understand budgets spent; a spreadsheet would be a direct answer. The questionnaire from management is presented in a multidimensional way, like below:
- What are Top N locations which had spent a certain amount?
- What are the Top N Sustainable Development Goals our organization is contributing by the number of employees participating?
- It’s obvious Top N w.r.t to Locations, Amount spent or contribution towards SDG’s is where more employees participating or more budget is spent. Management needs a deeper insight to consolidate all the rest of the locations' budget spent other than Top N(Location w.r.t SDG is TOP N, it shouldn’t contribute to the rest of the Locations category).
Let's dive into the solution to answer all three questions:
A quick look at sample data:
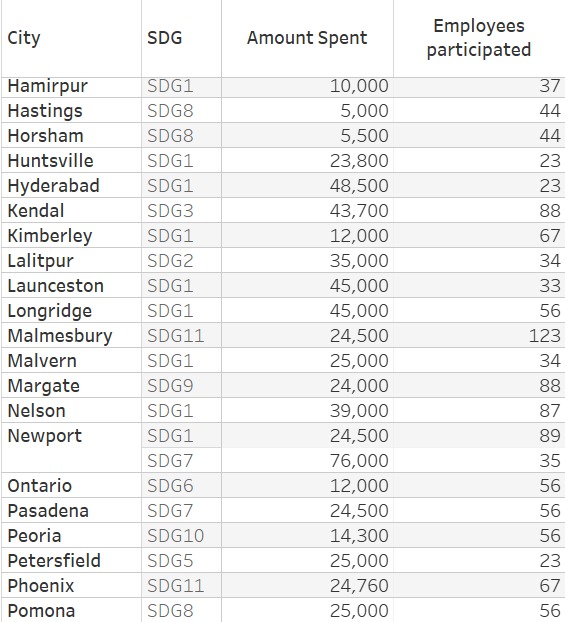
1. Sample Data
In Sample data from the location “Newport,” employees from this branch were contributing towards 2 SDGs (SDG1 & SDG7). We will talk about this again during solving question 3.
As a first step, create Top N according to the amount spent or employees participated w.r.t location and SDGs.
Create a “Top N” parameter, where the user can pass the value as a parameter.
Create another parameter, “According To,” where the “Top N” value is passed to.
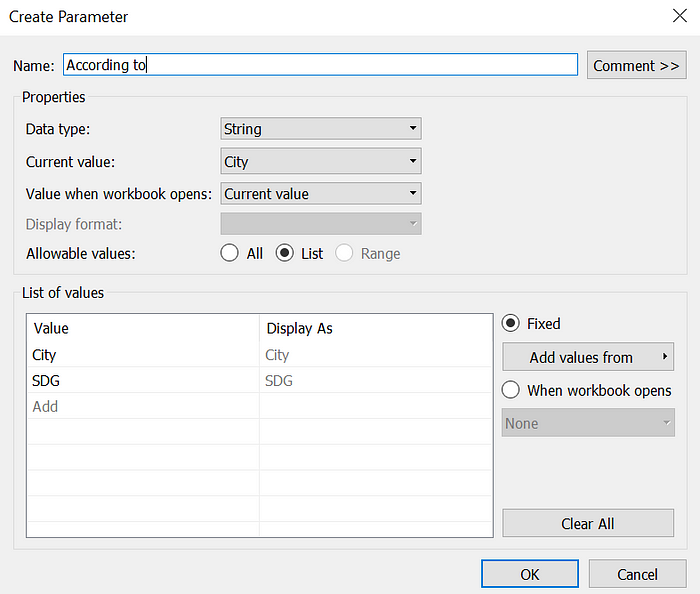
2. Parameter-According To
Create another parameter, “By which,” which is to visualize according to “Amount Spent” or “Number of employees participated.”
A detailed KB from Tableau, how to create TOP N by measure.
Using a Top N Parameter to Filter a Table | Tableau Software
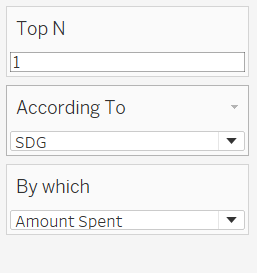
3. Parameters
Now, create 2 calculated fields using 2 parameters, “According To” and “By which,” to map arguments.
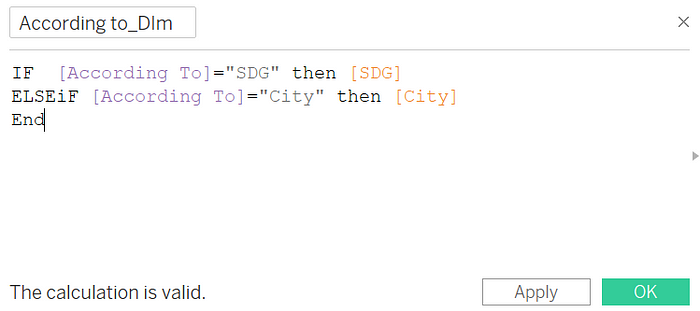
4. Calculated Field to Map With “According To” Parameter
In the same way, using the “By which” parameter, create another calculated field to map measure values.
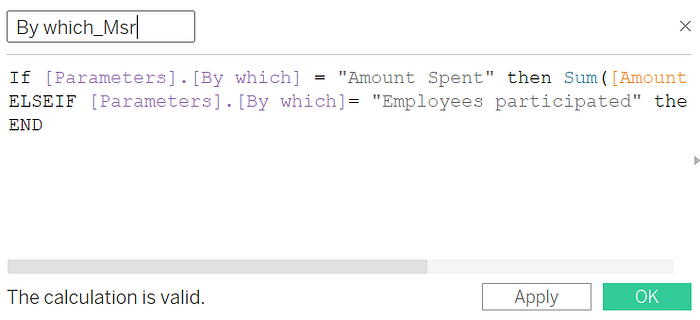
5. Calculated Field to Map With “By Which” Parameter
As we are ready by setting up all the parameters, let's start exploring Dense Rank.
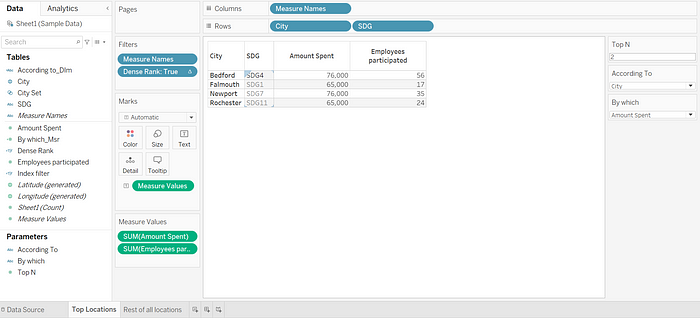
Creating a dense rank on the “By which_Msr” parameter, as we have duplicate values for SDG like “Newport” city data we had seen in picture.1.
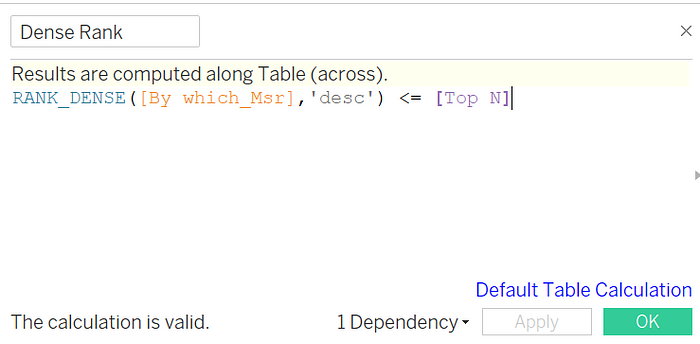
6. Using Dense Rank With Top N Parameter to Filter
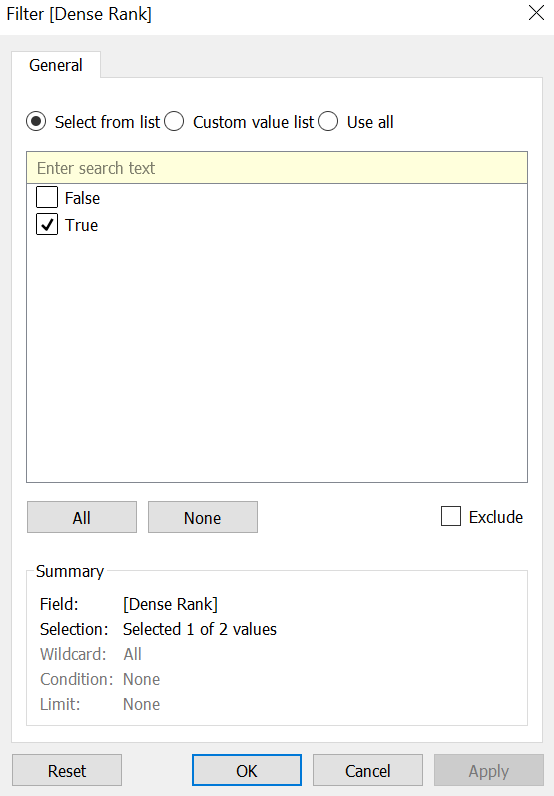
7. Pass Condition as True To Get Top N Data
Below result for the Top 2 Cities that contributed to City by the amount spent
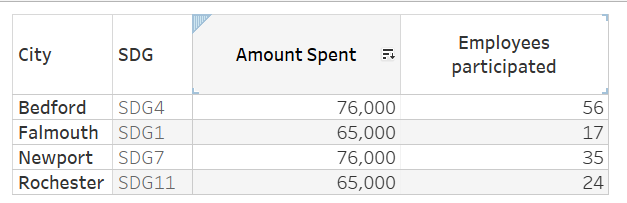
8. Top 2 Cities
That answers our 1st and 2nd questions easily.
Now let’s look into 3rd question. The first part of it, first. Consolidating all data that does not fall under Top N cities. An easy way to do this is to take the “Dense rank” filter as false in another sheet and visualize it. This is valid when we have unique data with no duplicates. The reason we are using dense rank here is to handle this duplicate data.
A suitable solution here is to use sets in our second sheet. Let's create a set on the city.
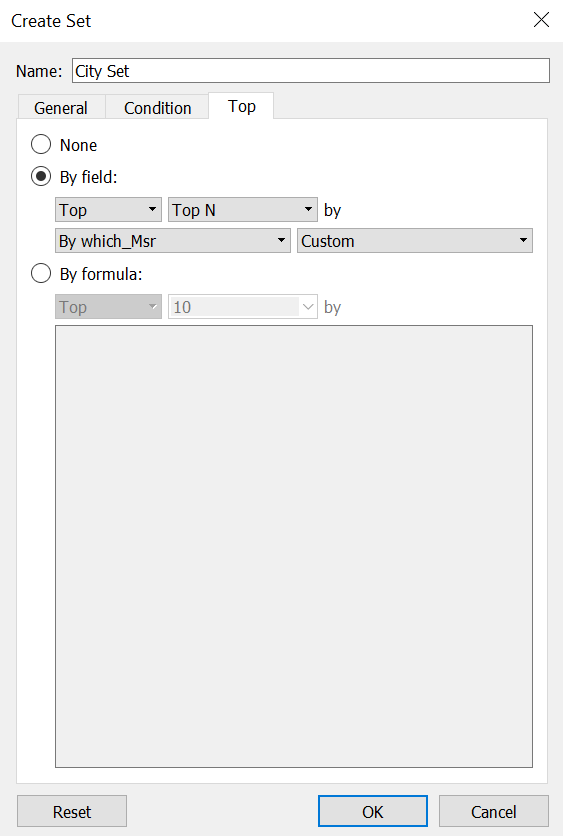
9. Create Set on Dimension City and Pass Top N Parameter
Now, take City set to filters in the rest of the locations sheet and set it to “Out.” Then perform “Add column Grand Totals ”
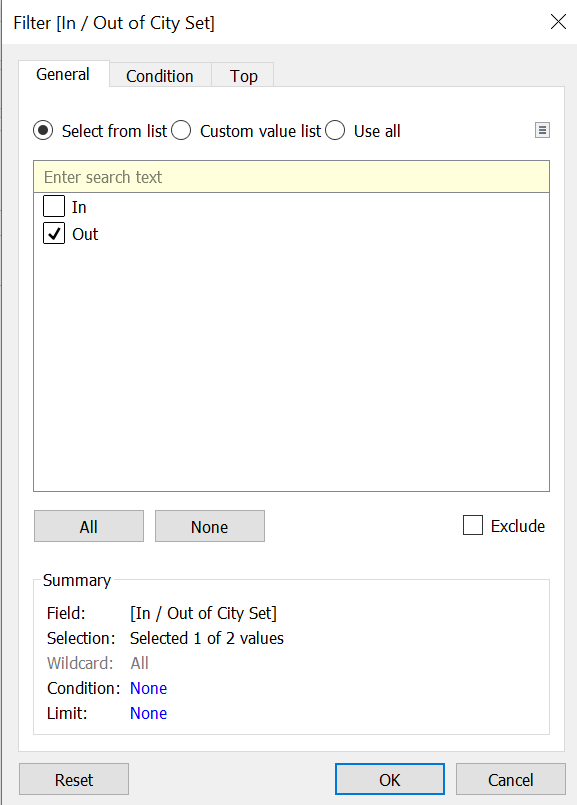
10. Configure Set on City Dimension
To answer our 3rd question, Newport data contributes to both SDGs, as it is in Top N; the second contribution is not added to the rest of all locations' data. Now perform a Running Total Table calculation on measure “Amount Spent.”
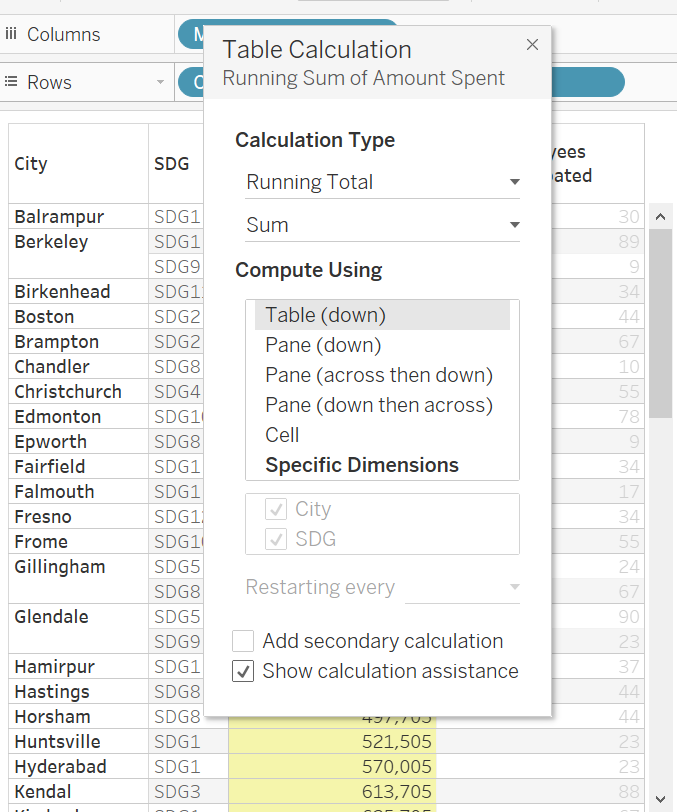
11. Running Total on Amount Spent
Since we need to display only the Total amount spent in a single row, let's use Index last() here to display the last maximum value row after running the total.
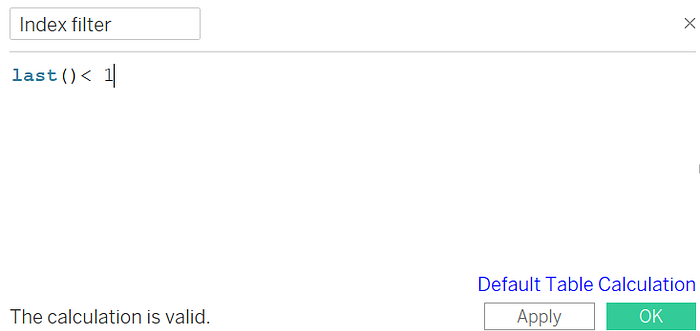
12. To Display Last Row
Drag this to filters and mark it as “True.”
This gives a final output for Top N according to city and amount spent at least in 1 SDG, and the remaining amount spent at different locations other than that present in Top N.
13. Top Two Locations W.R.T Amount Spent
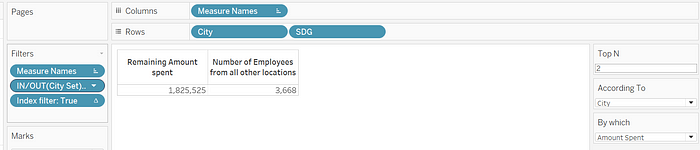
14. Rest of All Locations (Excluding Newport)
Rank functions are useful while handling Top N requirements when cases like duplicate data-dense rank functions are very helpful. Due to the Dense Rank, the same ranks allocated, there might be an ambiguity during calculations. that is where Sets come in very handy to help solve these duplicate data issues.
Published at DZone with permission of Rajesh Gaddipati. See the original article here.
Opinions expressed by DZone contributors are their own.
Comments