Using Heap Dumps to Find Memory Leaks
This guide covers heap dump collection methods, memory leak detection strategies, JVM memory warning signs, and best practices for Java memory optimization.
Join the DZone community and get the full member experience.
Join For FreeA JVM (Java Virtual Machine) runs programs in Java and many other languages and provides the runtime environment, CPU, memory, and security management. At any particular moment, the running JVM has many objects, and a heap dump is a snapshot of the memory allocated to all these objects.
In this post, we will discuss how to use heap dumps to find memory leaks.
What Is a Heap Dump?
A heap dump is like a blueprint of how the memory is used and who occupies what percentage of memory. Heap dumps are crucial in optimizing memory usage in Java applications, as well as for detecting and troubleshooting memory-leak problems.
The JVM allocates all the classes and objects needed for program execution memory on the heap. As the program progresses, some objects are no longer needed (no reference to them exists), and the garbage collector reclaims the memory allocated to them. This reclaimed memory is made available for newer objects needed by the programs running inside the JVM.
How to Take a Heap Dump?
A heap dump can be taken by simple Java commands, either on the command line or via runtime options.
1. Via the JMAP Command
The jmap command takes as input a process ID, and prints memory statistics like:
- The class loader statistics of Java heap
- Heap usage statistics like total capacity/available/free memory
- Information on objects awaiting finalization
- Histogram of the Java object heap
- Garbage collection (GC) algorithm being used
- Dumps the Java heap in hprof binary format, etc.
Its format is jmap [-clstats/-heap/-finalizerinfo/-histo{:live}/-dump:dump_options] ProcessID.
jmap -heap 12345
jmap -dump:live,format=b,file=myFileName.hprof 12345
jmap -histo 12345
2. Use JVM options
Clearly specify that heap dumps should be taken, especially in case of an OutOfMemoryError.
-XX:+HeapDumpOnOutOfMemoryError -XX:HeapDumpPath=/myfolder/myFile.hprof 3. Use the yCrash Open-Source Tool
It captures more than 16 essential artifacts, including a heap dump, to take a 360-degree snapshot of your running Java applications.
4. Use the JCMD Utility
JCMD is packaged with your Java installation; its general format is jcmd <PID> GC.heap_dump heapdump.hprof.
jcmd 12345 Dump.heap myHeapDumpFileName How to Analyze Heap Dumps to Find Memory Leaks
To browse and view the heap dumps visually, you can use the Java VisualVM tool or the more versatile HeapHero tool. I prefer using HeapHero as it is powerful, can pinpoint problems, provides details about memory usage and problems, and provides charts/visualizations that are easily discernible.
Also, HeapHero's machine learning algorithms give you deep insights into problems and provide accurate solutions/recommendations. 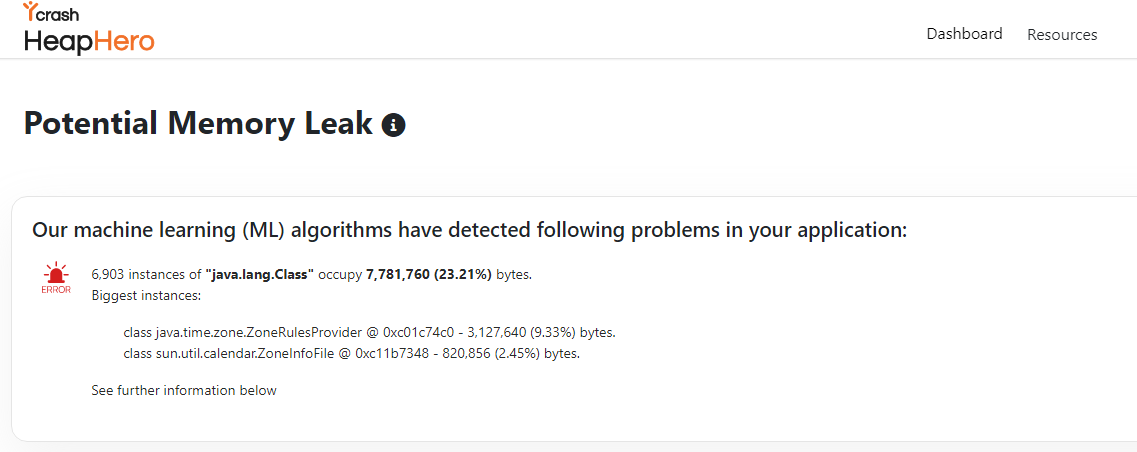
These are some telltale signs that indicate that something is wrong.
- Many duplicate variables contain the same value, e.g., many String objects contain exactly the same string.
- A few objects continuously grow over time, occupying increasing volumes of memory.
- After a certain period, repeated runs of the GC are not able to free up enough memory ( or the free memory keeps decreasing as GC runs keep increasing in frequency).
- Objects that could have been singletons are instance variables and have multiple copies in the heap.
- There are a lot of unreachable objects, i.e., objects that exist in the memory but do not have a useful reference or the reference is from another unreachable object.
Source: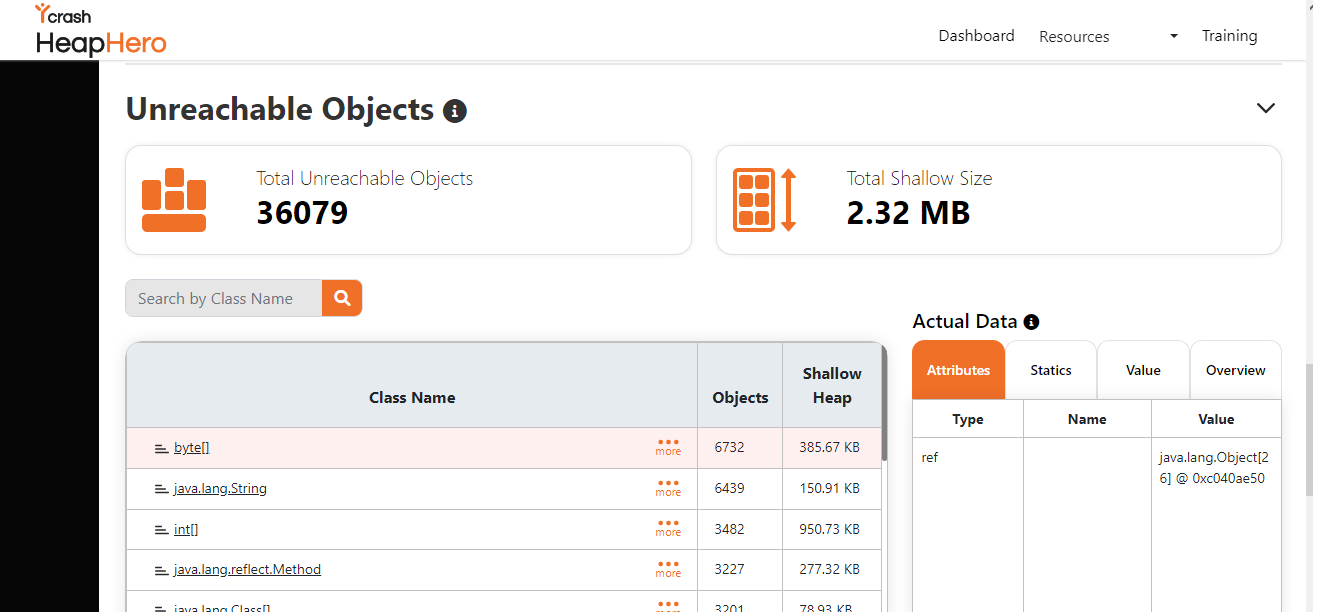
These unreachable objects must be closed to reclaim memory. Find the redundant/useless copies and use appropriate data types instead of fixed byte arrays/strings, etc. More such techniques can be found here: Fixing out-of-memory errors in Java applications.
Check the list of the largest objects:
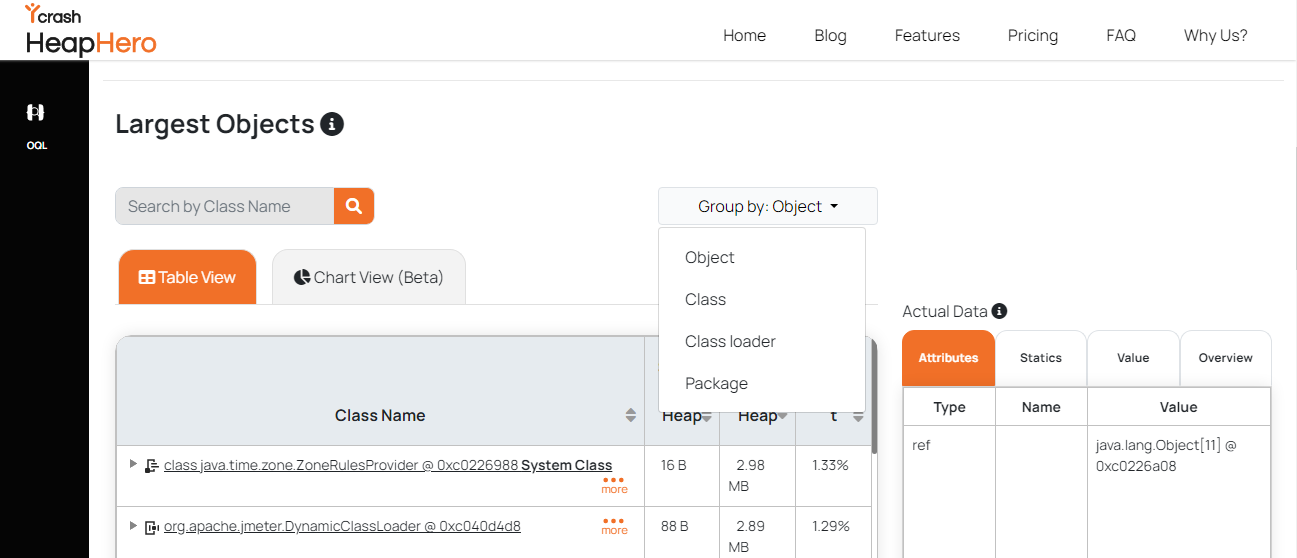
HeapHero shows you a list of the largest objects, sorted in descending order. You can also group them by Class/Object/Class Loader/Package. Find all the objects/classes occupying a lot of space and something that can be done about them. For example, closing file/database connections, making singleton objects, or sharing the same String values via static variables (not per instance).
Memory Optimization Maneuver and Typical Use Cases
- Identify objects unnecessarily holding references and close them.
- Understand the memory usage patterns of your program(s), allocate appropriate initial memory, and apply effective garbage collection strategies. For example:
- The Parallel Garbage Collector uses multiple threads to collect garbage in the young generation, improving throughput for CPU-bound applications.
- The Shenandoah Garbage Collector uses a barrier-based approach to minimize pause times and is suitable for large heaps.
To conclude, we have discussed how details hidden inside heap dumps can be used to mitigate the risk of OutOfMemoryErrors and close potential memory leaks.
Your suggestions and comments are welcome. Thanks for your time.
Opinions expressed by DZone contributors are their own.
Comments