Single Wire Output With the ARM Cortex-M and Eclipse
Follow along to learn more about Single Wire Output on the ARM Cortex-M. See how you can set up trace output messaging (and more) all from a single pin.
Join the DZone community and get the full member experience.
Join For FreeAs a standard procedure, I add some console functionality to my embedded applications. That way, I have a command line interface and can inspect and influence the target system. One interesting hardware feature of the ARM Cortex-M is Single Wire Output (SWO): It allows you to send out data (e.g. strings) over up to 32 different stimulus ports, over a single wire.

Debug Trace Output? SWO!
As the standard text and command line interface to my target boards, I’m using a normal UART/SCI. However, on many boards, the UART’s are used by the application.
There is semihosting, but this is very slow, depends on the debugger and toolchain/library used, plus it's a waste of FLASH and RAM, so I don’t recommend using semihosting at all.
There is USB CDC, but this requires a USB connector, a USB stack, and a microcontroller capable of USB. Not applicable in all cases.
There is Segger RTT, which is small, fast, and best of all, does not need any special pins. But it only works with Segger debugging probes.
ARM SWO
But there is yet another option: the ARM SWO trace port as defined by ARM for Cortex-M. Technically, SWO is a single trace pin that is used to stream out data packets with a certain clock rate, derived from the CPU core clock. You can think of SWO as a kind of UART TX pin using a special format to send out data packets. Up to 32 packet types (or stimuli) can be used, and you only need very little CPU processing power or code.
Common SWO usages are:
- Sending debug messages as strings.
- Recording interrupt entry/exit.
- Recording function entry/exit.
- Periodic PC value sampling.
- Event notification.
- Variable or memory cell change over time.
One of the most common uses is the first one: using SWO to print debug messages from the target in a UART style. And this is what I’m going to show in this article. There is another encoding method out there (Manchester encoded), which is not covered here.
ARM CoreSight
SWO is part of the ARM CoreSight Debug block, which is usually part of Cortex-M3, M4, and M7:

As shown in that overview slide, over SWO (or SWV), ITM and DWT trace messages can be sent. For instructions, up to four extra trace pins are required (see “First Steps with Ozone and the Segger J-Link Trace Pro” for more info on that).
SWO Pin
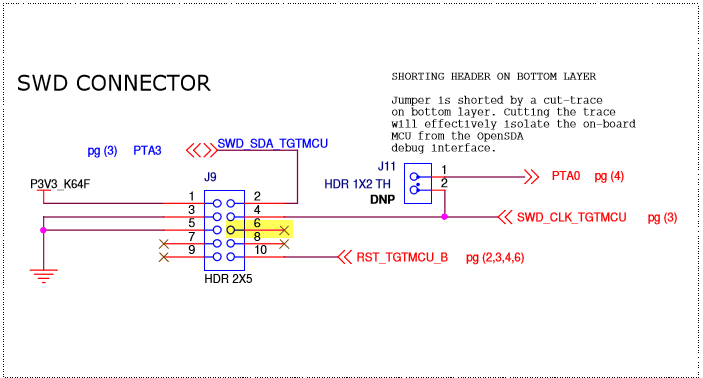
The precondition to use SWO is that the this pin is available on the debug header. This is the case for my TWR-K64F120M board:

As shown above, the SWO trace pin is shared with the JTAG TDO pin. So this means that SWO cannot be used with JTAG, it only can be used with SWD (see "SWD Debugging with the FRDM-KL25Z Board").
Carefully check your board schematics to see if it supports SWO. For example, on the FRDM-K64F (same device as on the above TWR-K64F120M), the SWO pin is *not* routed to the debug header:
Debug Probe and SWO
In order to use SWO, I need a debug probe capable of reading the SWO pin. For example, the Freescale/NXP OpenSDA onboard debug interface hardware on the Freedom and Tower modules does not support SWO (see “Solving “The connected emulator does not support serial wire output (SWO)”).
The external Segger J-Link, however, does support the SWO pin. Below I have a J-Link EDU connected to the debug and trace port of the TWR-K64F120M board:

Source Code to Send Debug Messages Over SWO Trace Pin
In order to write debug message over SWO to the host, a small piece of code is needed.
An example project with all the sources is available on GitHub: https://github.com/ErichStyger/mcuoneclipse/tree/master/Examples/KDS/TWR-K64F120M/TWR-K64F120M_Demo/Sources
External tools (like the Segger RTT viewer) can set up SWO in the hardware. My recommendation is to initialize it from the application. Because the SWO trace output clock is derived from the CPU clock, the Init function needs that clock, plus the SWO port number to be initialized. Below is the code I’m using to initialize the SWO output to a default of 64k baud:
/*!
* \brief Initialize the SWO trace port for debug message printing
* \param portBits Port bit mask to be configured
* \param cpuCoreFreqHz CPU core clock frequency in Hz
*/
void SWO_Init(uint32_t portBits, uint32_t cpuCoreFreqHz) {
    uint32_t SWOSpeed = 64000; /* default 64k baud rate */
    uint32_t SWOPrescaler = (cpuCoreFreqHz / SWOSpeed) - 1; /* SWOSpeed in Hz, note that cpuCoreFreqHz is expected to be match the CPU core clock */

    CoreDebug->DEMCR = CoreDebug_DEMCR_TRCENA_Msk; /* enable trace in core debug */
    *((volatile unsigned *)(ITM_BASE + 0x400F0)) = 0x00000002; /* "Selected PIN Protocol Register": Select which protocol to use for trace output (2: SWO NRZ, 1: SWO Manchester encoding) */
    *((volatile unsigned *)(ITM_BASE + 0x40010)) = SWOPrescaler; /* "Async Clock Prescaler Register". Scale the baud rate of the asynchronous output */
    *((volatile unsigned *)(ITM_BASE + 0x00FB0)) = 0xC5ACCE55; /* ITM Lock Access Register, C5ACCE55 enables more write access to Control Register 0xE00 :: 0xFFC */
    ITM->TCR = ITM_TCR_TraceBusID_Msk | ITM_TCR_SWOENA_Msk | ITM_TCR_SYNCENA_Msk | ITM_TCR_ITMENA_Msk; /* ITM Trace Control Register */
    ITM->TPR = ITM_TPR_PRIVMASK_Msk; /* ITM Trace Privilege Register */
    ITM->TER = portBits; /* ITM Trace Enable Register. Enabled tracing on stimulus ports. One bit per stimulus port. */
    *((volatile unsigned *)(ITM_BASE + 0x01000)) = 0x400003FE; /* DWT_CTRL */
    *((volatile unsigned *)(ITM_BASE + 0x40304)) = 0x00000100; /* Formatter and Flush Control Register */
}
From my main application, I initialize it like this (for a system with a 24 MHz core clock):
#define CPU_CORE_FREQUENCY_HZ 120000000 /* CPU core frequency in Hz */

SWO_Init(0x1, CPU_CORE_FREQUENCY_HZ);
The printing is done in SWO_PrintChar():
/*!
* \brief Sends a character over the SWO channel
* \param c Character to be sent
* \param portNo SWO channel number, value in the range of 0 to 31
*/
void SWO_PrintChar(char c, uint8_t portNo) {
    volatile int timeout;

    /* Check if Trace Control Register (ITM->TCR at 0xE0000E80) is set */
    if ((ITM->TCR&ITM_TCR_ITMENA_Msk) == 0) { /* check Trace Control Register if ITM trace is enabled*/
        return; /* not enabled? */
    }
    /* Check if the requested channel stimulus port (ITM->TER at 0xE0000E00) is enabled */
    if ((ITM->TER & (1ul<<portNo))==0) { /* check Trace Enable Register if requested port is enabled */
        return; /* requested port not enabled? */
    }
    timeout = 5000; /* arbitrary timeout value */
    while (ITM->PORT[0].u32 == 0) {
        /* Wait until STIMx is ready, then send data */
        timeout--;
        if (timeout==0) {
            return; /* not able to send */
        }
    }
    ITM->PORT[0].u16 = 0x08 | (c<<8);
}
The above code uses a very simple timeout mechanism: The important point is not to block it if SWO is not enabled or if the SWO port is not ready. Otherwise, the application will blocked.
To make it easier to print a string, I’m using the following function:
/*!
* \brief Sends a string over SWO to the host
* \param s String to send
* \param portNumber Port number, 0-31, use 0 for normal debug strings
*/
void SWO_PrintString(const char *s, uint8_t portNumber) {
    while (*s!='\0') {
        SWO_PrintChar(*s++, portNumber);
    }
}
To send a ‘hello’ over SWO, it's as easy as:
SWO_PrintString("hello world with SWO\r\n", 0);
The first parameter is the string to send, the second is the SWO trace channel number.
GNU ARM Eclipse Viewer
To receive the SWO trace output on the host, the GNU ARM Eclipse plugins have built-in SWO support for the Segger J-Link probes.
SWO only is supported in SWD (Single Wire Debug) mode, and not in JTAG mode. So make sure that SWD is selected as debugging protocol:

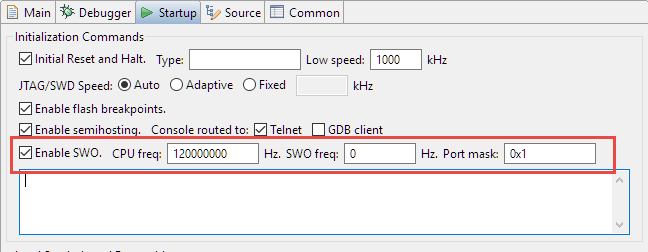
In the GNU ARM Eclipse debug configuration, enable SWO and specify the CPU frequency and the SWO frequency (see the documentation about the frequencies). I have to provide the CPU frequency (120 MHz in my case) and can leave the SWO freqenzy at 0 so the J-Link will automatically determine the speed). Specify in the port to mask the ports (as bitmask) used, so 0x1 is for port 0:
With this, running the application on the target it shall show the output in the Eclipse Console View:

Segger SWO Viewer
Segger has a special SWO Viewer (both command line and GUI version).
In the GUI version, I specify the device used, and it can sense the trace clock:

In the viewer, I can turn on/off ports and see the data received:

Telnet: Putty
But there is no fancy viewer or Eclipse needed to see the SWO data. Segger uses port 2332 by default:

I can configure any telnet client (e.g. PuTTY) to open a session on port 2332:

And the I get the output in PuTTY:

Summary
The ARM SWO trace pin allows you to send trace messages to the host. One common usage is to send debugging or other messages. SWO only needs a single pin, works only with SWD (not JTAG), and requires little code and ressources on the target. Unfortunately, many boards do not have the SWO trace pin routed to the debug header, so if you are making your own design, routing SWO to the debug header should be at least considered.
While SWO trace output is great, it is limited to the higher end Cortex-M. I did not find it in the Cortex-M0(+), and it is output only, and requires a debug probe/interface supporting it. At least with Eclipse and the GNU ARM Eclipse plugins, in combination with Segger J-Link probes, SWO output has worked great for me.
On the other side, the Segger RTT is much more versatile — and very fast, too. It works on all ARM Cortexes, and best of all, it does not need an extra pin. However, it requires a little more overhead and RAM on the target system. Plus, it allows you to both send and receive data. So, for the serial debug message printing, the Segger RTT sounds a better solution to me.
Happy SWOing.
Published at DZone with permission of Erich Styger. See the original article here.
Opinions expressed by DZone contributors are their own.
Comments