VisualVM 1.3: Detailed Application Monitoring
Join the DZone community and get the full member experience.
Join For Freevisualvm 1.3 has just been released and is now available for download at https://visualvm.dev.java.net ! the most significant new features in this release include the incorporation of the sampler plugin into the core tool, the ability to define custom profiling presets, and support for taking a heap dump of a remote jvm. the tool newly enables custom sorting of applications, recognizes the clojure, groovy, jruby, jython and scala runtimes, and introduces monitoring remote hosts. two new plugins have been provided with this release: the tracer framework and probes plugin enable detailed application monitoring, and the threads inspector plugin displays stacks of the selected threads.
further information about the release is available in the release notes , details about the new features are described on the official netbeans profiler and visualvm blog .

monitoring a java application using the tracer probes
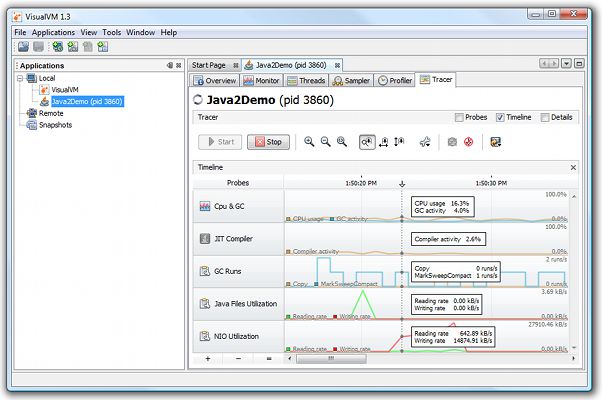
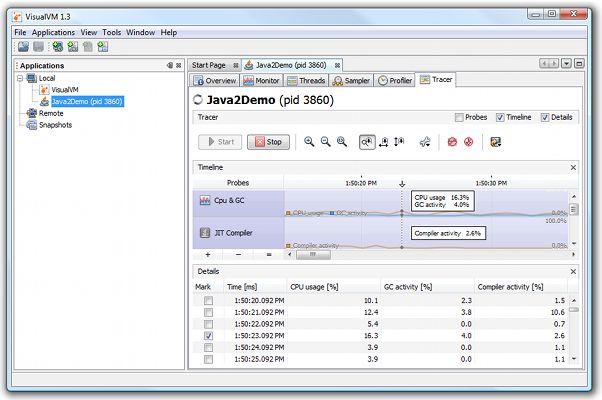
let's take a look at the tracer plugin, which provides a framework and gui for monitoring and analyzing java applications. using various types of probes, the plugin is able to gather metrics from an application and display the data in a timeline. this gives a quick overview of what is happening in various parts of the application and allows you to easily determine the relations between the metrics. the values are displayed both graphically and in a table and can be exported to common formats for further processing with external tools.
the tracer timeline uses interactive, high-performance charts optimized for displaying large amounts of live data. the rows that represent the probes can be resized to display greater detail. the time axis can be used to mark the samples that represent the important events that occurred during the tracer session. the appearance and behavior of the timeline can be customized in the options dialog.

selecting the probes to use for monitoring
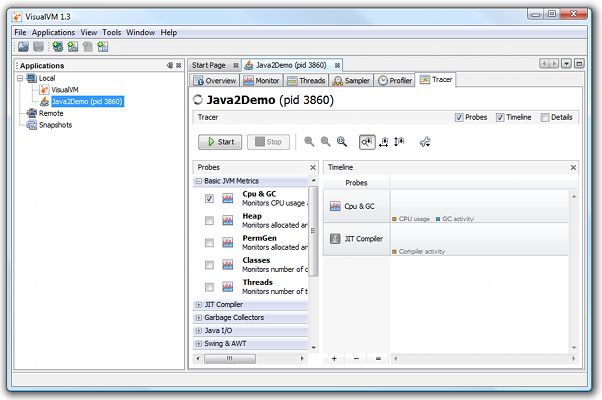
to start using tracer, you need to download one or more plugins with predefined probes from the plugin center. tracer probes can be found in the "tracer" category in the list of available plugins. the following probes are available for visualvm 1.3:
- monitor probes. for monitoring cpu & gc activity, heap & permgen usage, number of loaded classes and application threads. these probes provide the same information as the graphs in the monitor tab, and allow you to analyze other data in the context of basic jvm telemetry.
- jvm probes. for monitoring various virtual machine internals, such as i/o metrics, gc metrics and hotspot utilization.
- jvmstat probes. for visualizing the metrics exported by the monitored jvm as jvmstat counters (including sun.gc.jvmstat, sun.perfdata.jvmstat, sun.threads.jvmstat, etc.).
- swing probes. provide detailed information about awt and swing gui performance in terms of paints count, layout times and events utilization.
- javafx probes. for monitoring the performance of various logical parts of javafx applications.
- dtrace probes. provide low-level system metrics, including jvm overhead, utilization of each cpu or syscalls numbers. these probes are available only for the solaris/opensolaris os.

tracer displaying detailed data for the selected probes
the initial set of probes primarily uses jmx and btrace technologies. you can expect to see more probes for monitoring (not only) java applications in the future because the tracer framework is general enough to support nearly every technology, including dtrace, attach api, snmp, etc. the visualvm developers encourage you to send any ideas/requests regarding the tracer probes to feedback@visualvm.dev.java.net .
Opinions expressed by DZone contributors are their own.

Comments