What Is Synthetic Testing?: A Definition and How it Compares to Real User Monitoring
The title says it all, so let's dive right in!
Join the DZone community and get the full member experience.
Join For FreePerformance monitoring is critical for a healthy software application. If you have nothing like synthetic testing or real user monitoring in place, opportunities for performance optimizations could be slipping through the cracks.
However, when you have a monitoring tool as a guide, you could be fixing problems like slow loading pages within the hour.
The two main types of application monitoring are real user monitoring and synthetic testing (or synthetic monitoring). If you are looking into an application monitoring tool, it’s important to know the differences.
What Is Synthetic Testing?
Synthetic testing is a method of understanding a user’s experience of your application by predicting behavior.
Wikipedia says:
“Synthetic monitoring (also known as active monitoring or proactive monitoring) is website monitoring that is done using a Web browser emulation or scripted recordings of Web transactions. Behavioral scripts (or paths) are created to simulate an action or path that a customer or end-user would take on a site.”
Synthetic testing tools use simulated users to provide information on uptime, the performance of critical business transactions, and most common navigation paths. For this reason, synthetic monitoring is often used to alert teams to outages and performance problems. Synthetic testing can also help when you have little to no traffic by using lightweight agents that use scripts to simulate user behavior and judge performance.
Some Uses of Synthetic Monitoring Tools Are:
- Letting you know when your app is down
- Creating a baseline for performance trends across countries
- Performance monitoring over low-traffic periods
- Detecting problems caused by third-party scripts
- Monitoring critical database queries for availability
The problem with synthetic testing is that it doesn’t tell you the actions of real users.
Because it uses simulated actions, synthetic testing can’t predict complex behavior. It just assumes the paths that users might take through your apps. The tests could come out fine, but your real users experience issues. So, synthetic testing alone would leave a significant gap in your monitoring strategy.
How Is Real User Monitoring Different?
Real user monitoring (RUM), on the other hand, uses data from real users navigating your application to surface bottlenecks like slow loading pages and poor UX.
RUM is usually performed using a few lines of code within web pages which collects relevant data and delivers it to you. There’s no impact on your website performance because RUM is usually both agentless and asynchronous.
The downside to RUM is that it is a passive form of monitoring. It can only provide data for apps with activated traffic, so in this case, synthetic monitoring should be your choice.
You can see why synthetic testing is so useful, and at first glance, synthetic testing and real user monitoring seem very similar. Real user monitoring offers a much more accurate view of your end user. If you have website traffic, real user monitoring should be the tool of choice.
An Example of When Real Data Is Better
It helps to explain in context.
Say you are building a website that calculates retirement savings. You have several online calculators that help customers work out how much money to save. You think your target audience is tech-savvy 20-40 year-olds, so you set up synthetic monitoring to test for performance problems on mobile devices and in the latest browser versions. The tests reassure you that everything is running smoothly. Time for launch!
After a few months, you add a RUM tool to get a second set of eyes on performance. That’s when you notice some pages are taking over two minutes to load! What’s going on?
RUM notices that most of your users are on IE6, and only 5% are browsing on mobile—something synthetic testing didn’t pick up. Your calculators cause big performance problems on these older versions, and you have to allocate a significant amount of time back into re-development. Not great for a time-poor start-up.
Browser Monitoring for Detecting Problems in Specific Browsers
Browser monitoring matters. RUM tracks and reports on your most popular browsers and how they are performing in real time, making it very easy to make improvements. It’s helpful when dropping support too—it’s pointless having fixes for IE 6 when no-one browses your websites on versions less than IE9.
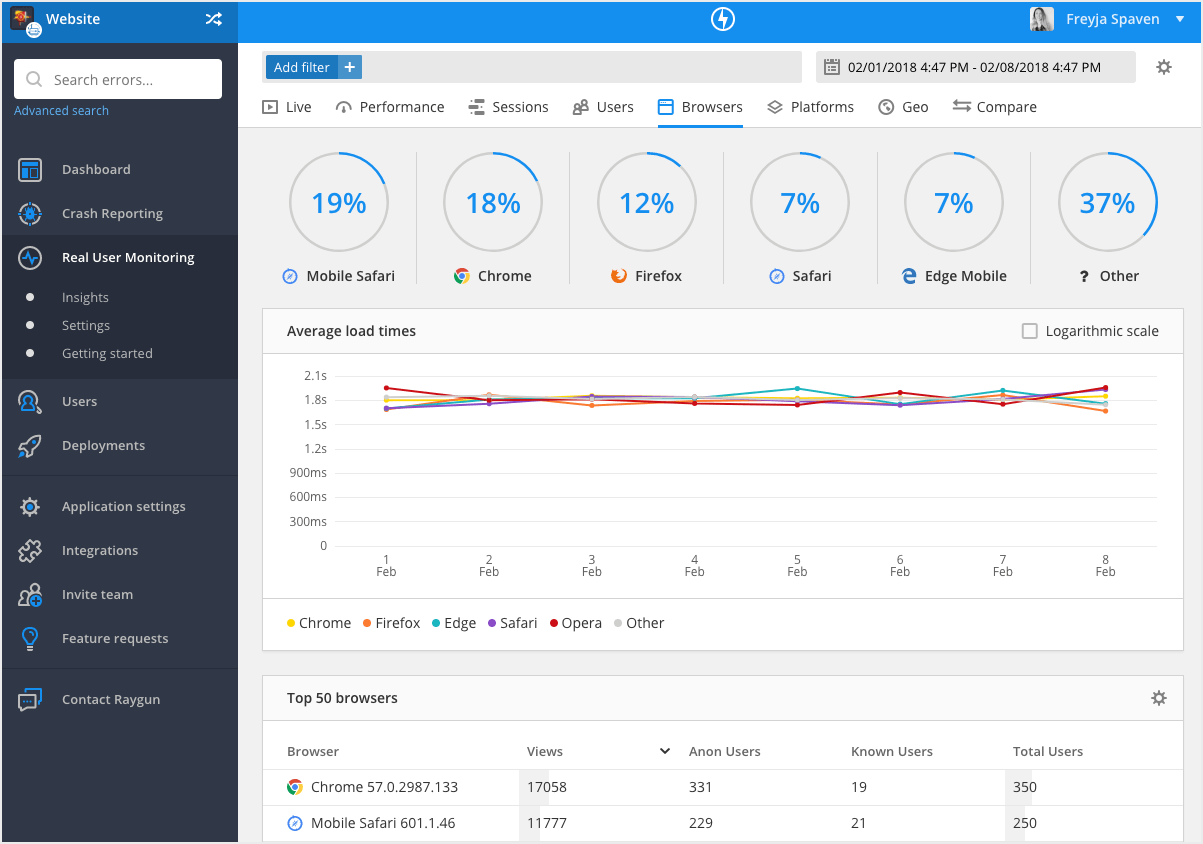
Raygun Real User Monitoring collects all browser data to help you understand which browsers are most popular in your app. You can see exactly which versions of popular browsers are in use, or choose to group them by browser type. This can help provide answers to performance questions many development teams face every day, like: “Should we remove support for IE6?” and “Which browser is most popular? Which is letting us down performance wise?”

Raygun’s Browsers page, showing performance of each popular browser
Session Trace Information to Track the User Journey
Another key difference is that real user monitoring makes it possible to see every user and the journey they took through your application. This is important when developers need to know how a VIP customer ran into an error. For example, was it a software error, or a slow loading third-party script?
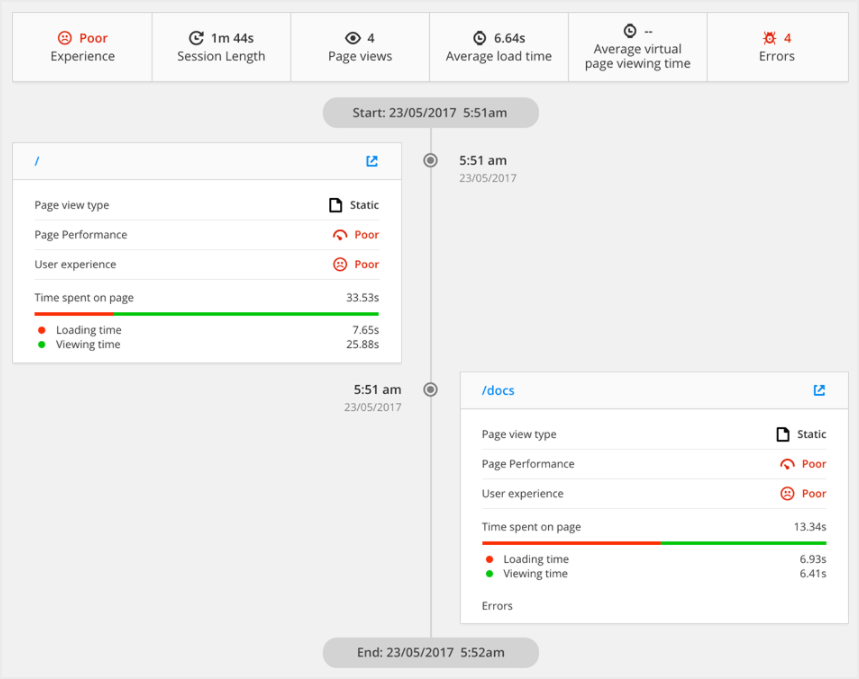
Session tracing allows developers to see which pages or views loaded slowly, and which failed to load or caused an error.

Raygun’s session trace page showing details of the user’s session
Real User Monitoring Compare for Seeing Performance Side-By-Side
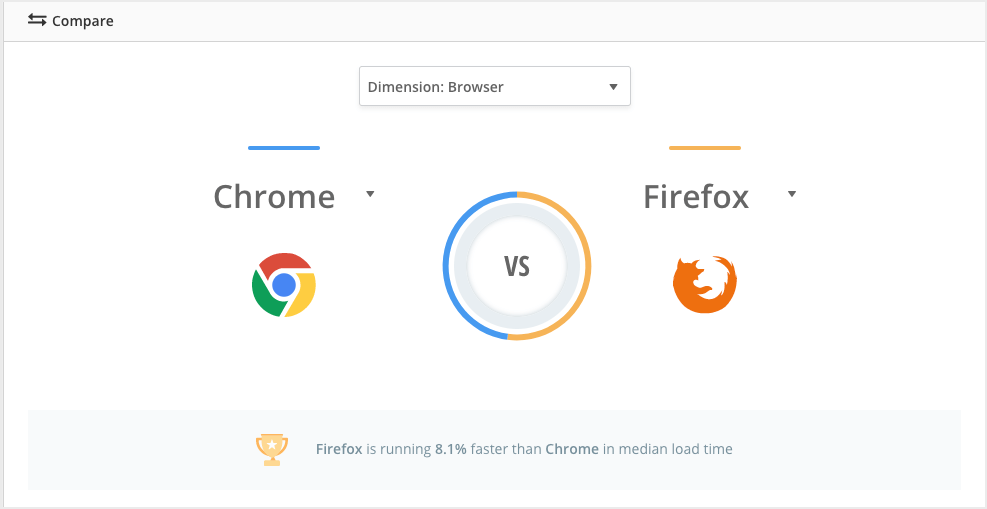
When making performance improvements to your app, there’s no one-size-fits-all solution. What’s considered mission critical for one company could be a minor edge case for another. Therefore, being able to customize your data views is a core feature of any RUM product. Comparing performance data like browser, country, device and operating system helps developers understand how these dimensions affect performance.

Compare browser performance using Raygun
You can also compare the performance of two deployments side-by-side. This is important as both developers and product managers understand the impact their releases have on overall user experience.
Summary
Real user monitoring and synthetic testing are complementary tools. Together, they create a compelling monitoring picture. While synthetic monitoring might fall short in some areas, real user monitoring will fill in the gaps.
Raygun’s real user monitoring offers detailed insights into end users and even a weekly digest of your web and mobile application’s performance. Developers can fix performance problems quickly as they can see with complete clarity what went wrong, and the root cause.
Further Resources
Saving customers 75 hours with Real User Monitoring
Use Synthetic Monitoring to Measure Availability and Real-User Monitoring for Performance
Published at DZone with permission of Freyja Spaven, DZone MVB. See the original article here.
Opinions expressed by DZone contributors are their own.

Comments