What Is the Difference Between Metrics and Events?
We gather all types of data from our systems when we adopt monitoring technologies and tools.
Join the DZone community and get the full member experience.
Join For FreeWe gather all types of data from our systems when we adopt monitoring technologies and tools. We might, for example, want to see application metrics, database logs, and network traffic side-by-side. We don't always talk about the differences in these types of data, so today we're covering a question I get asked most often: what is the difference between metrics and events?

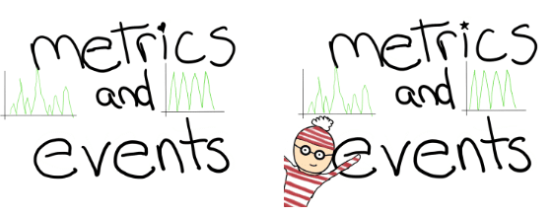
See if you can spot the differences!
Technical Differences
Metrics and events are two different types of time series data: regular and irregular, respectively. Regular data (metrics) are evenly distributed across time and can be used for processes like forecasting. Irregular data (events) are unpredictable, and while they still occur in temporal order, the intervals between events are inconsistent, which means that using them for forecasting or averaging could lead to unreliable results.
The basic difference is metrics occur at regular intervals and events don't. Imagine I'm monitoring my personal website — I want to track the response codes to make sure the site is available, so I collect them at frequent intervals. I could then query those response code metrics to figure out what percentage of the time my site was down (because it was too popular). But I also want to know when a user clicks on an ad. I don't know when or if this click will happen, so collecting at a regular interval doesn't make sense. If I have 12 clicks for the past year, the average will be one click a month regardless if they could have all happened October (the peak of my popularity).

It’s time series meets gossip!
In order to use event data for forecasting or averages, it has to be transformed into regular data. If you're interested in modeling time series data, I recommend reading this blog on shaping and analyzing your data. If you're using InfluxDB, you can see an example of working with irregular time series data here.
Because metrics and events are different types of data, this changes how the database can efficiently store and compress the data being ingested (e.g. different compression algorithms might be needed for different types of data). This is why at InfluxDB, we emphasize the ability to track both metrics and events — not every system can do both, and not every system is optimized for both. Ideally, our database does its job, and we don't have to worry about the ways it handles data. We can send metrics and events into InfluxDB without knowing or caring about how the database differentiates between the two.
Practical Differences
The way we can interact with data changes depending on whether it's regular or irregular, so sometimes we do need to know whether the data we're collecting are metrics or events. For example, metrics can be used for aggregates since we have data that is evenly spaced across time. We don't want to use irregular data to find aggregates because they won't be distributed across time evenly, and they'll return some useless results.
Monitoring Metrics and Events
I want to keep track of my piggy bank closely. Right now, there's only one metric I care about: total funds. Anyone can put money into my piggy bank, so I want to report the total funds at a one-minute interval. This means that every minute, my database will receive a data point with the timestamp and the number of total funds in my piggy bank.

Her name is Oinky and she is a fine accountant.
Now, I want to track specific events for my piggy bank: deposits and withdrawals. When a deposit occurs, my database will receive a data point with the "deposit" tag, the timestamp, and the amount of the deposit. Similarly, when a withdrawal occurs, my database will receive a data point with the "withdrawal" tag, the timestamp, and the amount of the withdrawal.
This very simple dataset makes sure that the total funds reported by my piggy bank match the total deposits and withdrawals. This is the same way my parents balanced their checkbook and the same way I used to close out the cash register during my retail career.
Imagine now that this is the same basic idea behind online banking. We could add more metadata to add detail to the events, like attaching a user ID to a deposit or withdrawal.
Conclusion
Metrics and events are complementary. The ability to monitor both is more necessary than ever, and it shouldn't take a data scientist to be able to do it (data scientists are pretty cool though).
Original artwork by Katy Farmer.Published at DZone with permission of Katy Farmer, DZone MVB. See the original article here.
Opinions expressed by DZone contributors are their own.

Comments