Turbocharge Load Testing: Yandex.Tank + ghz Combo for Lightning-Fast Code Checks
When you need a quick assessment of your service’s ability to handle a load of 100+ requests per second, there’s no need to involve multiple teams in complex processes.
Join the DZone community and get the full member experience.
Join For FreeHi there! Occasionally, there arises a need for swift load testing, whether it be in a local environment or on a testing platform. Typically, such tasks are tackled using specialized tools that demand thorough prior comprehension. However, within enterprises and startups where rapid time-to-market and prompt hypothesis validation are paramount, excessive tool familiarization becomes a luxury.
This article aims to spotlight developer-centric solutions that obviate the necessity for profound engagement, allowing for rudimentary testing without delving into pages of documentation.
Local Running
You should install:
- Docker - All services and tools are required for it.
- Java 19+ - For Kotlin service. Also, you can try to use the Java 8 version; it should work, but you have to change the Gradle settings.
- Golang
- Python 3+ - For the Yandex.Tank.
Tech Requirements
Prior to embarking on our journey, it is advisable to generate a couple of services that can serve as illustrative examples for testing purposes.
Stack: Kotlin + webflux.r2dbc + Postgres
Our service has:
- get all stocks (limit 10)
GET /api/v1/stocks - get stock by name
GET /api/v1/stock?name=apple - save stock
POST /api/v1/stock
It should be an easy service because we have to focus on load testing.
Kotlin and the HTTP Service
Let's start by creating a small service with some basic logic inside.
We'll prepare a model for this purpose:
@Table("stocks")
data class Stock(
    @field:Id val id: Long?,
    val name: String,
    val price: BigDecimal,
    val description: String
)
Simple router:
@Configuration
@EnableConfigurationProperties(ServerProperties::class)
class StockRouter(
    private val properties: ServerProperties,
    private val stockHandler: StockHandler
) {

    @Bean
    fun router() = coRouter {
        with(properties) {
            main.nest {
                contentType(APPLICATION_JSON).nest {
                    POST(save, stockHandler::save)
                }
                GET(find, stockHandler::find)
                GET(findAll, stockHandler::findAll)
            }
        }
    }
}
Handler:
@Service
class StockHandlerImpl(
    private val stockService: StockService
) : StockHandler {

    private val logger = KotlinLogging.logger {}

    private companion object {
        const val DEFAULT_SIZE = 10
        const val NAME_PARAM = "name"
    }

    override suspend fun findAll(req: ServerRequest): ServerResponse {
        logger.debug { "Processing find all request: $req" }

        val stocks = stockService.getAll(DEFAULT_SIZE)
        return ServerResponse.ok()
            .contentType(MediaType.APPLICATION_JSON)
            .body(stocks, StockDto::class.java)
            .awaitSingle()
    }

    override suspend fun find(req: ServerRequest): ServerResponse {
        logger.debug { "Processing find all request: $req" }

        val name = req.queryParam(NAME_PARAM)

        return if (name.isEmpty) {
            ServerResponse.badRequest().buildAndAwait()
        } else {
            val stocks = stockService.find(name.get())

            ServerResponse.ok()
                .contentType(MediaType.APPLICATION_JSON)
                .body(stocks, StockDto::class.java)
                .awaitSingle()

        }
    }

    override suspend fun save(req: ServerRequest): ServerResponse {
        logger.debug { "Processing save request: $req" }

        val stockDto = req.awaitBodyOrNull(StockDto::class)
        return stockDto?.let { dto ->
            stockService.save(dto)

            ServerResponse
                .ok()
                .contentType(MediaType.APPLICATION_JSON)
                .bodyValue(dto)
                .awaitSingle()
        } ?: ServerResponse.badRequest().buildAndAwait()
    }

}
Full code here: GitHub
Create a docker file:
FROM openjdk:20-jdk-slim
VOLUME /tmp
COPY build/libs/*.jar app.jar
ENTRYPOINT ["java", "-Dspring.profiles.active=stg", "-jar", "/app.jar"]
Then, build a docker image and tune it:
docker build -t ere/stock-service .
docker run -p 8085:8085 ere/stock-service
But for now, it's better to stick with the idea of running everything through Docker containers and migrate our service into a Docker Compose setup.
version: '3.1'

services:

  db:
    image: postgres
    container_name: postgres-stocks
    ports:
      - "5432:5432"
    environment:
      POSTGRES_PASSWORD: postgres

  adminer:
    image: adminer
    ports:
      - "8080:8080"

  stock-service:
    image: ere/stock-service
    container_name: stock-service
    ports:
      - "8085:8085"
    depends_on:
      - db
Moving Forward
How can we proceed with testing? Specifically, how can we initiate a modest load test for our recently developed service? It’s imperative that the testing solution is both straightforward to install and user-friendly.
Given our time constraints, delving into extensive documentation and articles isn’t a viable option. Fortunately, there’s a viable alternative—enter Yandex.Tank. The tank is a powerful instrument for testing and has important integrations with JMeter, but in the article, we will use it as a simple tool.
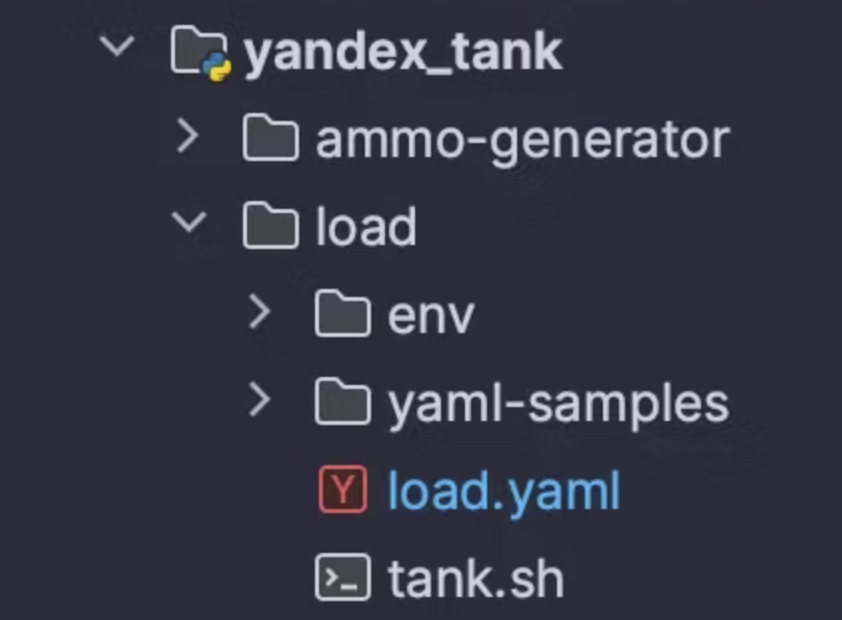
Let's kick off by creating a folder for our tests. Once we've placed the configs and other essential files—fortunately, just a couple of them—we'll be all set.
For our service, we need to test methods “get-all” and “save.” The first config for find method.
phantom:
  address: localhost
  port: "8085"
  load_profile:
    load_type: rps
    schedule: line(100, 250, 30s)
  writelog: all
  ssl: false
  connection_test: true
  uris:
    - /api/v1/stocks
overload:
  enabled: false
telegraf:
  enabled: false
autostop:
  autostop:
    - time(1s,10s) # if request average > 1s
    - http(5xx,100%,1s) # if 500 errors > 1s
    - http(4xx,25%,10s) # if 400 > 25%
    - net(xx,25,10) # if amount of non-zero net-codes in every second of last 10s period is more than 25
Key settings for configuration:
- Address and port: Same as our application.
- Load test profile (
load_profile): We'll use the 'lined' type, ranging from 100 requests per second to 250 with a 30-second limit. - URIs: A list of URLs to be tested.
- Autostop pattern: No need to stress-test if our service has already gone down!
Copy and paste the bash script (tank sh):
docker run \
    -v $(pwd):/var/loadtest \
    --net="host" \
    -it yandex/yandex-tank
And run!
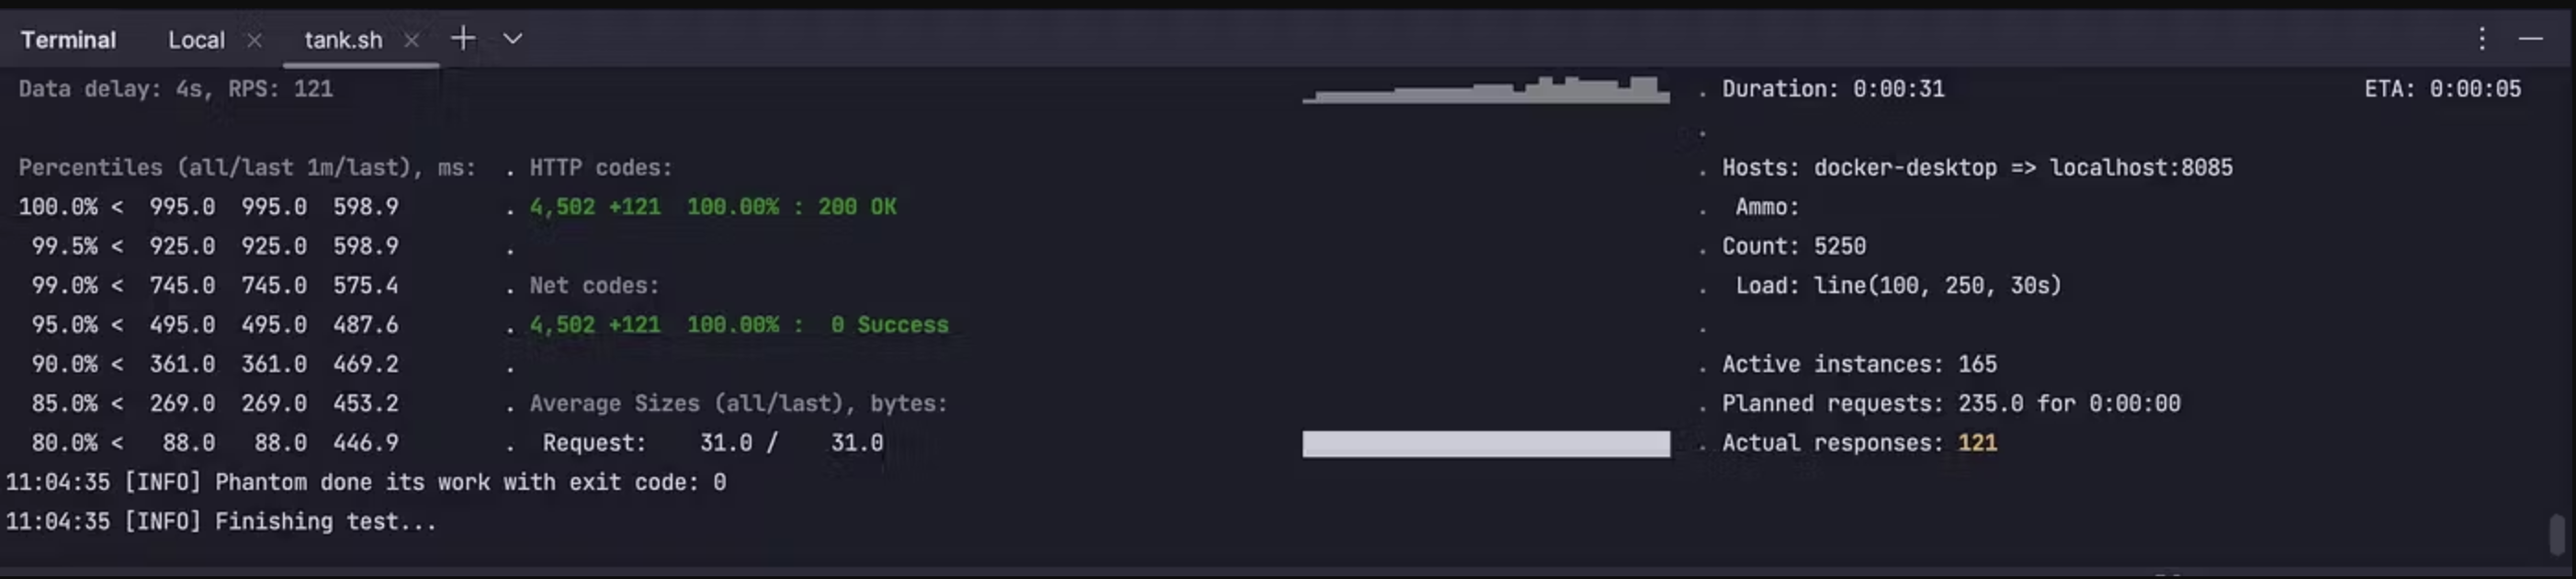
What will we see as a result? Yandex.Tank will log everything it deems worthy during the test. We can observe metrics such as the 99th percentile and requests per second (rps).
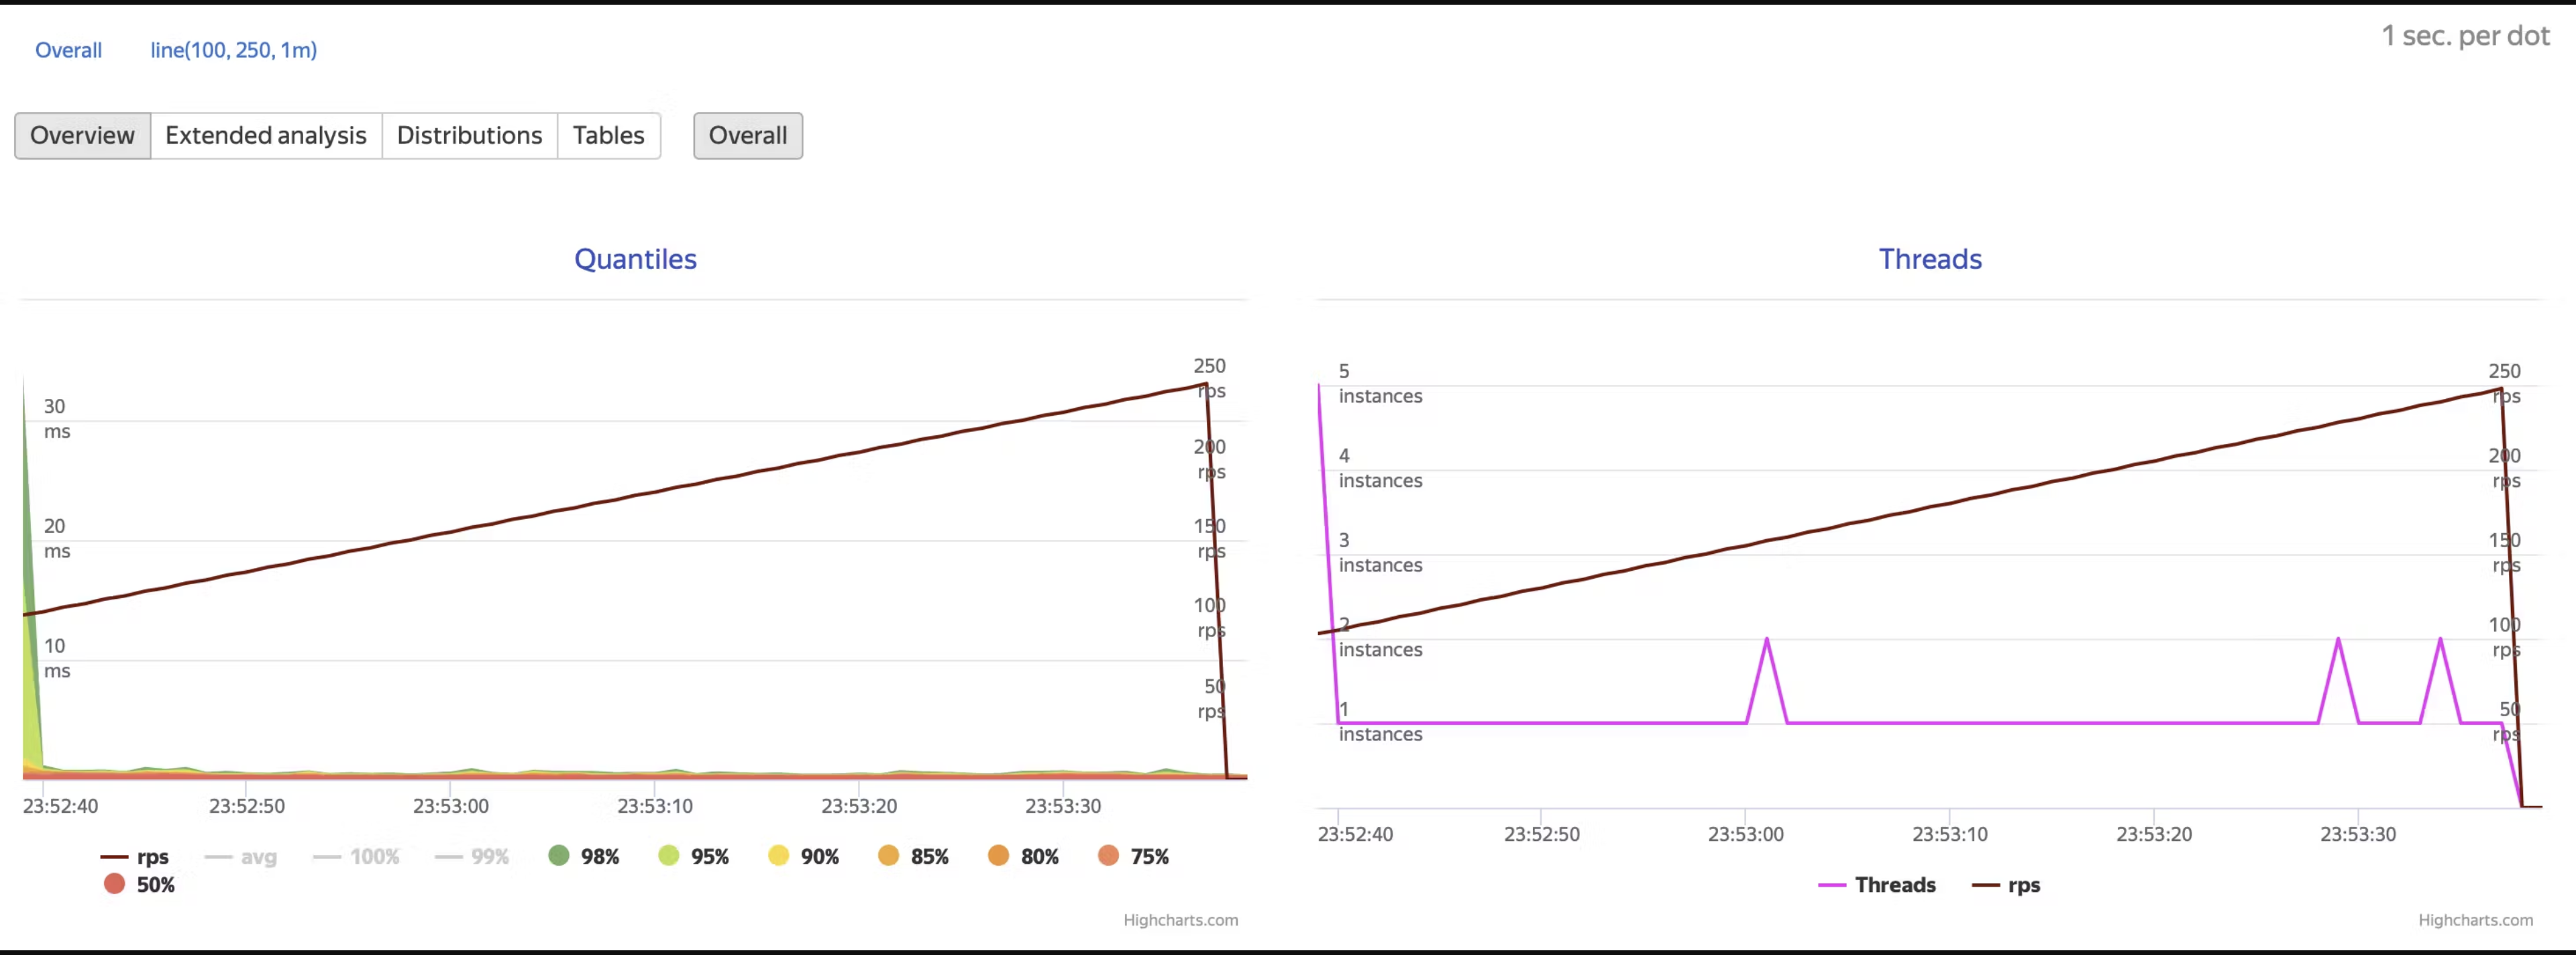
So, are we stuck with the terminal now? I want a GUI! Don't worry, Yandex.Tank has a solution for that too. We can utilize one of the overload plugins. Here's an example of how to add it:
overload:
  enabled: true
  package: yandextank.plugins.DataUploader
  job_name: "save docs"
  token_file: "env/token.txt"
We should add our token; just go here and logic by GitHub: https://overload.yandex.net
Okay, dealing with a GET request is straightforward, but what about POST? How do we structure the request? The thing is, you can't just throw the request into the tank; you need to create patterns for it! What are these patterns? It's simple—you need to write a small script, which you can again fetch from the documentation and tweak a bit to suit our needs.
And we should add our own body and headers:
#!/usr/bin/env python3
# -*- coding: utf-8 -*-

import sys
import json

# http request with entity body template
req_template_w_entity_body = (
        "%s %s HTTP/1.1\r\n"
        "%s\r\n"
        "Content-Length: %d\r\n"
        "\r\n"
        "%s\r\n"
    )

# phantom ammo template
ammo_template = (
        "%d %s\n"
        "%s"
    )

method = "POST"
case = ""
headers = "Host: test.com\r\n" + \
          "User-Agent: tank\r\n" + \
          "Accept: */*\r\n" + \
          "Connection: Close\r\n"


def make_ammo(method, url, headers, case, body):
    """ makes phantom ammo """
    req = req_template_w_entity_body % (method, url, headers, len(body), body)
    return ammo_template % (len(req), case, req)


def generate_json():
    body = {
        "name": "content",
        "price": 1,
        "description": "description"
    }
    url = "/api/v1/stock"
    h = headers + "Content-type: application/json"
    s1 = json.dumps(body)
    ammo = make_ammo(method, url, h, case, s1)
    sys.stdout.write(ammo)
    f2 = open("ammo/ammo-json.txt", "w")
    f2.write(ammo)


if __name__ == "__main__":
    generate_json()
Result:
212
POST /api/v1/stock HTTP/1.1
Host: test.com
User-Agent: tank
Accept: */*
Connection: Close
Content-type: application/json
Content-Length: 61

{"name": "content", "price": 1, "description": "description"}
That’s it! Just run the script, and we will have ammo-json.txt. Just set new params to config, and delete the URLs:
phantom:
  address: localhost:9001
  ammo_type: phantom
  ammofile: ammo-json.txt
And run it one more time!
It’s Time to Test the GRPC!
Having acquainted ourselves with loading HTTP methods, it’s natural to consider the scenario for GRPC. Are we fortunate enough to have an equally accessible tool for GRPC, akin to the simplicity of a tank? The answer is affirmative. Allow me to introduce you to "ghz."
Just take a look: https://ghz.sh/
But before we do that, we should create a small service with Go and GRPC as a good test service.
Prepare a small proto file:
syntax = "proto3";
option go_package = "stock-grpc-service/stocks";
package stocks;
service StocksService {
rpc Save(SaveRequest) returns (SaveResponse) {}
rpc Find(FindRequest) returns (FindResponse) {}
}
message SaveRequest {
Stock stock = 1;
}
message SaveResponse {
string code = 1;
}
message Stock {
string name = 1;
float price = 2;
string description = 3;
}
message FindRequest {
enum Type {
INVALID = 0;
BY_NAME = 1;
}
message ByName {
string name = 1;
}
Type type = 1;
oneof body {
ByName by_name = 2;
}
}
message FindResponse {
Stock stock = 1;
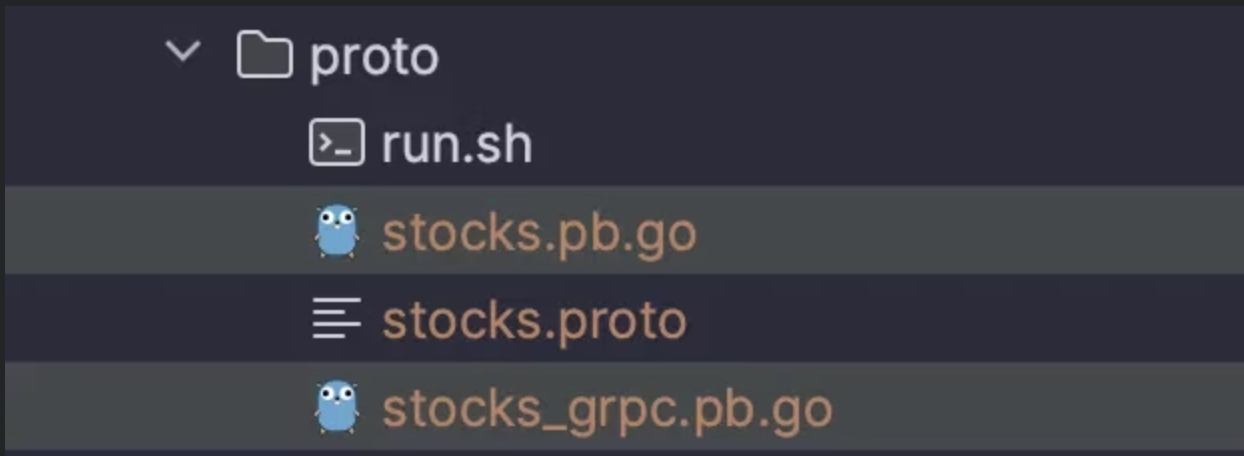
}And generate it! (also, we should install protoc)
protoc --go_out=. --go_opt=paths=source_relative --go-grpc_out=. --go-grpc_opt=paths=source_relative stocks.proto
Our results:
Coding Time!
Next steps: Create services as fast as we can.
Create dto (stock entity for DB layer)
package models

// Stock – base dto
type Stock struct {
 ID          *int64  `json:"Id"`
 Price       float32 `json:"Price"`
 Name        string  `json:"Name"`
 Description string  `json:"Description"`
}
Implement server:
// Server is used to implement stocks.UnimplementedStocksServiceServer.
type Server struct {
 pb.UnimplementedStocksServiceServer
 stockUC stock.UseCase
}

// NewStockGRPCService stock gRPC service constructor
func NewStockGRPCService(emailUC stock.UseCase) *Server {
 return &Server{stockUC: emailUC}
}

func (e *Server) Save(ctx context.Context, request *stocks.SaveRequest) (*stocks.SaveResponse, error) {
 model := request.Stock

 stockDto := &models.Stock{
  ID:          nil,
  Price:       model.Price,
  Name:        model.Name,
  Description: model.Description,
 }

 err := e.stockUC.Create(ctx, stockDto)
 if err != nil {
  return nil, err
 }

 return &stocks.SaveResponse{Code: "ok"}, nil
}

func (e *Server) Find(ctx context.Context, request *stocks.FindRequest) (*stocks.FindResponse, error) {
 code := request.GetByName().GetName()

 model, err := e.stockUC.GetByID(ctx, code)
 if err != nil {
  return nil, err
 }

 response := &stocks.FindResponse{Stock: &stocks.Stock{
  Name:        model.Name,
  Price:       model.Price,
  Description: model.Description,
 }}

 return response, nil
}
Full code here.
Test It!
- Install GHz with brew (as usual).
- Let's check a simple example here.
Now, we should change it a little bit:
- Move to the folder with the proto files.
- Add method:
stocks.StocksService.Save. - Add simple body:
{“stock”: { “name”:”APPL”, “price”: “1.3”, “description”: “apple stocks”} } 10connections will be shared among20goroutine workers. Each pair of2goroutines will share a single connection.- Set service’s port.
And the result:
cd .. && cd stock-grpc-service/proto

ghz --insecure \
  --proto ./stocks.proto \
  --call stocks.StocksService.Save \
  -d '{"stock": { "name":"APPL", "price": "1.3", "description": "apple stocks"} }' \
  -n 2000 \
  -c 20 \
  --connections=10 \
  0.0.0.0:5007
Run it!
Summary:
  Count:        2000
  Total:        995.93 ms
  Slowest:      30.27 ms
  Fastest:      3.11 ms
  Average:      9.19 ms
  Requests/sec: 2008.16

Response time histogram:
  3.111  [1]   |
  5.827  [229] |∎∎∎∎∎∎∎∎∎∎∎
  8.542  [840] |∎∎∎∎∎∎∎∎∎∎∎∎∎∎∎∎∎∎∎∎∎∎∎∎∎∎∎∎∎∎∎∎∎∎∎∎∎∎∎∎
  11.258 [548] |∎∎∎∎∎∎∎∎∎∎∎∎∎∎∎∎∎∎∎∎∎∎∎∎∎∎
  13.973 [190] |∎∎∎∎∎∎∎∎∎
  16.689 [93]  |∎∎∎∎
  19.405 [33]  |∎∎
  22.120 [29]  |∎
  24.836 [26]  |∎
  27.551 [6]   |
  30.267 [5]   |

Latency distribution:
  10 % in 5.68 ms
  25 % in 6.67 ms
  50 % in 8.27 ms
  75 % in 10.49 ms
  90 % in 13.88 ms
  95 % in 16.64 ms
  99 % in 24.54 ms

Status code distribution:
  [OK]   2000 responses
And what, stare at everything in the terminal again? No, with ghz, you can also generate a report, but unlike Yandex, it will be generated locally and can be opened in the browser.
Just set it:
ghz --insecure -O html -o reports_find.html - -O + html → output format
- -o filename
Conclusion
In summary, when you need a swift assessment of your service's ability to handle a load of 100+ requests per second or identify potential weaknesses, there's no need to initiate intricate processes involving teams, seeking assistance from AQA, or relying on the infrastructure team.
More often than not, developers have capable laptops and computers that can execute a small load test. So, go ahead and give it a shot—save yourself some time!
I trust you found this brief article beneficial.
Valuable Documentation I Recommend Reading:
Just in case, if you need more:
- Yandex.Tank docs
- Yandex.Tank GitHub
- Yandex.Tank Setting
- ghz official page
- ghz config:link
May the Force Be With You! Thanks once again, and best of luck!
Published at DZone with permission of Ilia Ivankin. See the original article here.
Opinions expressed by DZone contributors are their own.
Comments