A Beats Tutorial: Getting Started
Get acquainted with the E:L stack and working with the different beats: Filebeat, Packetbeat, Metricbeat, Auditbeat, Heartbeat, and Winlogbeat.
Join the DZone community and get the full member experience.
Join For FreeThe ELK Stack, which traditionally consisted of three main components (Elasticsearch, Logstash, and Kibana), has long departed from this composition and can now also be used in conjunction with a fourth element called Beats: a family of log shippers for different use cases. It is this departure that has led to the stack being renamed as the Elastic Stack.
This tutorial provides a guide for those just getting acquainted with the stack and provides information for getting started working with the different beats: Filebeat, Packetbeat, Metricbeat, Auditbeat, Heartbeat, and Winlogbeat.
A Brief History Lesson
In centralized logging, a data pipeline consists of three main stages: aggregation, processing, and storage. In the ELK Stack, the first two stages were traditionally the responsibility of Logstash, the stack's workhorse.
Executing these tasks comes at a cost. Due to inherent issues related to how Logstash was designed, performance issues became a frequent occurrence, especially with complicated pipelines that require a large amount of processing.
The idea of outsourcing some of Logstash's responsibilities also came into being, especially the task of data extraction to other tools. As I describe in this article, the idea first manifested itself in Lumberjack and later in the Logstash forwarder. Eventually, a few cycles of development later, a new and improved protocol was introduced that became the backbone of what is now called the Beats family.
What Are Beats?
Beats are a collection of lightweight (resource-efficient, no dependencies, small) and open-source log shippers that act as agents installed on the different servers in your infrastructure for collecting logs or metrics.
Filebeat, as its name implies, is used for collecting and shipping log files and is also the most commonly used beat. One of the facts that make Filebeat so efficient is the way it handles backpressure — so if Logstash is busy, Filebeat slows down its read rate and picks up the beat once the slowdown is over.
Filebeat can be installed on almost any operating system, including as a Docker container, and also comes with internal modules for specific platforms such as Apache, MySQL, Docker and more, containing default configurations and Kibana objects for these platforms.
Packetbeat
A network packet analyzer, Packetbeat was the first beat introduced. Packetbeat captures network traffic between servers and, as such, can be used for application and performance monitoring.
Packetbeat can be installed on the server being monitored or on its own dedicated server. Packetbeat tracks the network traffic, decodes the protocols, and records data for each transaction. The protocols supported by Packetbeat include DNS, HTTP, ICMP, Redis, MySQL, MongoDB, Cassandra, and many more.
Metricbeat
Metricbeat is an extremely popular beat that collects and reports various system-level metrics for various systems and platforms. Metricbeat also supports internal modules for collecting statistics from specific platforms.
You can configure the frequency at which Metricbeat collects the metrics and what specific metrics to collect using these modules and sub-settings called metricsets.
Heartbeat is meant for "uptime monitoring." In essence, what Heartbeat does is probe services to check if they are reachable or not — it's useful, for example, to verify that the service uptime complies with your SLA. All you need to do is supply Heartbeat with a list of URLs and uptime metrics to send to your stack, either directly to Elasticsearch or to for enrichment before indexing.
Heartbeat is still in beta mode, defined as being experimental.
Auditbeat is a beat that is also still defined as being in experimental stages and can be used for auditing user and process activity on your Linux servers. Similar to other traditional system auditing tools (systemd, auditd), Auditbeat can be used to identify security breaches — file changes, configuration changes, malicious behavior, etc.
Winlogbeat
Winlogbeat will only interest Windows sysadmins or engineers as it is a beat designed specifically for collecting Windows Event logs. It can be used to analyze security events, updates installed, and so forth.
Community Beats
There is also a long list of beats developed by the community. These, of course, are not supported in any official way but are worth exploring if relevant for your use case.
The list of community beats includes beats for AWS, Apache, Cassandra, Docker, GitHub, and many more.
Installing Beats
Installing the various beats is super simple. Most likely, you've already set up one of the other components in the ELK Stack, so you should be familiar with the commands.
Just in case, here is a full example of installing a beat from scratch on an Ubuntu 16.04 host.
First, download and install the Elasticsearch signing key:
wget -qO - https://artifacts.elastic.co/GPG-KEY-elasticsearch | sudo apt-key add -Then, save the repository definition:
echo "deb https://artifacts.elastic.co/packages/6.x-prerelease/apt
stable main" | sudo tee -a /etc/apt/sources.list.d/elastic-6.x.list
To install your beat, use:
sudo apt-get update
sudo apt-get install <beatname>
Configuring Beats
Being based on the same underlying architecture, Beats follows the same structure and configuration rules.
Configuration files are usually located in the same directory — for Linux, this location is the directory. For Filebeat, this would be /etc/filebeat/filebeat.yml. For Metricbeat, this would be /etc/metricbeat/metricbeat.yml. And so forth.
Generally speaking — and again, the exact structure may differ depending on the beat in question — the configuration file will include two main sections: one defines what data to collect and how to handle it, and the other where to send the data.
Beats configuration files are based on the YAML format with a dictionary containing a group of key-value pairs, but they can contain lists, strings, and various other data types.
Most of the beats also include files with complete configuration examples, useful for learning the different configuration settings that can be used. Use it as a reference.
Filebeat Configuration Example
Here is an example of a very basic Filebeat configuration:
filebeat.prospectors:
- type: log
  enabled: true
  paths:
    - /var/log/*.log
  fields:
    app_id: service-a
    env: dev

output.logstash:
  hosts: ["localhost:5044"]
The prospector is where you define what log file to track — its path, its type, encoding type, and any other processing steps you would like to apply. You can define multiple prospectors per Filebeat or multiple paths per prospector. You can add custom fields to each prospector, useful for tagging and identifying data streams.
The output section informs Filebeat where to send the data — in the example above, we are defining a Logstash instance, but you can also define Elasticsearch as an output destination if you do not require additional processing.
Metricbeat Configuration Example
Here is an example of a Metricbeat configuration:
metricbeat.modules:
- module: docker
  metricsets: ["container", "cpu", "diskio", "healthcheck", "info", "memory", "network"]
  hosts: ["unix:///var/run/docker.sock"]
  period: 10s
fields:
  env: dev

output.elasticsearch:
  hosts: ["elasticsearch:9200"]
I am using the Docker module, defining what specific statistics I want to be shipped (called metricsets), adding a custom env field, and shipping directly into Elasticsearch.
Configuration Best Practices
Each beat contains its own unique configuration file and configuration settings, and therefore requires its own set of instructions. Still, there are some common configuration best practices that can be outlined here to provide a solid general understanding.
- Some Beats, such as Filebeat, include full example configuration files (i.e. /etc/filebeat/filebeat.full.yml). These files include long lists of all the available configuration options.
- YAML files are extremely sensitive. Do not use tabs when indenting your lines — only spaces. YAML configuration files for Beats are mostly built the same way, using two spaces for indentation.
- Use a text editor (I use Sublime) to edit the file.
- Sections are separated by a long line of
#(hash) symbols. As much as this sounds funny, don't mistake these for commented-out configuration lines. - The
-(dash) character is used for defining new elements — be sure to preserve their indentations and the hierarchies between sub-constructs.
Beats Modules
As mentioned above, Filebeat and Metricbeat both support what is a growing number of modules — built-in configurations and settings for specific platforms and systems. So instead of configuring these two beats from scratch, using these modules will help you hit the ground running with pre-configured settings.
Modules only take care of the "what" and the "how," not the "where to" — you will still need to configure the output section.
Each module comes with a set of files containing module-specific configurations, field definitions, and sample Kibana visualizations. Modules have default configurations, which will most likely be fine in most use cases. You can see these default settings in the /etc/<beatname>/module.d directory (DEB).
There are various ways of enabling these modules, the easiest simply being to define it in your beat configuration file, replacing your prospector:
filebeat.modules:
  - module: apache2
    access:
      enabled: true
      var.paths: ["/path/to/log/apache2/access.log*"]
What's Next?
Once you've configured your beat, you are ready to begin enjoying the wealth of information they collect.
To start your beat, use:
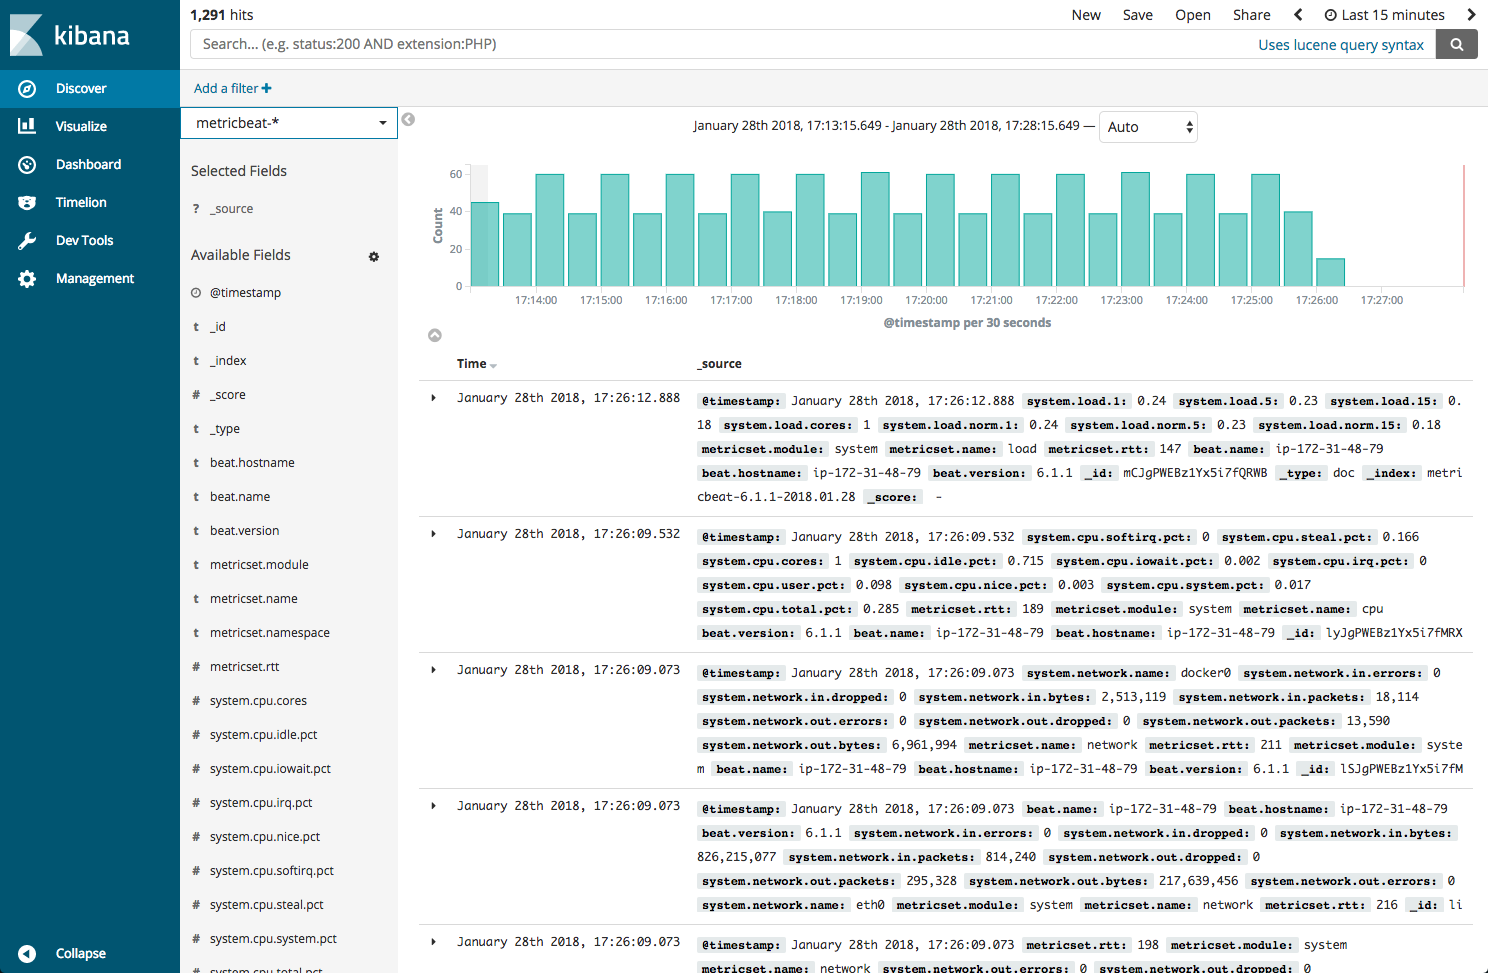
sudo service <beatname> startWithin seconds, a new index will be created in Elasticsearch, which you can define in Kibana to begin analysis which is the simplest way to make sure your beat is working correctly.
Beats by no means replace Logstash. Users often get confused as to how the two interact. Beats acts as a lightweight log shipper for specific use cases, while Logstash is responsible for the heavy lifting, acting as an aggregator and processor. You will most likely use them together, especially when using Filebeat for collecting and processing log files.
Beats are extremely versatile and easy to use, and the addition of modules makes them even more feature-rich. In this tutorial, I provided only the tip of the iceberg — the different beats contain specific usage instructions and configurations that are worth exploring.
Happy YAMLing, and keep the beat going, guys!
Published at DZone with permission of Daniel Berman. See the original article here.
Opinions expressed by DZone contributors are their own.
Comments