Application Monitoring Using CloudWatch Synthetics
In this article, I will explain how Cloud watch synthetics are used to monitor your application using AWS synthetics canaries and why it is needed.
Join the DZone community and get the full member experience.
Join For FreeIn this article, I will explain how CloudWatch synthetics are used to monitor your application using AWS synthetics canaries and why it is needed.
Imagine you have already invested significant resources in building a robust application infrastructure on Amazon Web Services (AWS). However, with the increasing complexity of your application and the ever-growing number of users, ensuring a seamless user experience has become a challenge. To address this challenge, you have a powerful monitoring solution offered by AWS called Synthetics. Along with this, customers also want to ensure sensitive data is detected and masked consistently across all their logs. With account-level policies, customers will be able to protect all their logs in a simplified and consistent way. This includes data monitoring as well as part of application monitoring.
Synthetic monitoring is an approach to run automated scripts and simulate user behavior to identify and fix the website availability, performance, and functionality issues before end users notice them.
With the CloudWatch synthetic feature, you can create different kinds of canaries to continually verify your customer experience even when you do not have traffic, monitor and test for unusual behavior, and trace issues for faster resolution.
Using Canaries, you can discover issues with your website before your customer do.
What Are CloudWatch Synthetics/Canaries?
CloudWatch synthetic feature was introduced in November 2019. It helps users monitor the application endpoint more easily. It runs tests on your endpoints 24/7 and alerts you if they don’t behave as expected. Using this feature, you can create canaries (configurable scripts) that run on a schedule to monitor applications.
Canaries are small, modular, lightweight pieces of code that simulate user interaction with your application. These can be written in Node.js or Python, and they work over both HTTP and HTTPS protocols.
Canaries use a headless Google Chrome Browser to perform tasks like opening web pages and taking screenshots. It uses Google’s Puppeteer library to perform the tests with Node.js, and the Selenium framework is used with Python.
Canaries scripts can be customized to check for availability, latency, transactions, broken or dead links, step-by-step task completions, and page load errors in your application.
CloudWatch Synthetics supports monitoring your REST APIs, URLs, and website content, checking for unauthorized changes from phishing, code injection, and cross-site scripting.
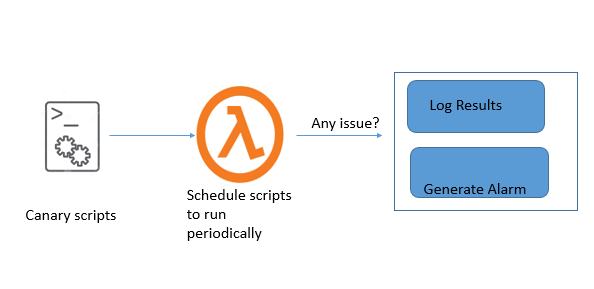
Architecture
The architecture of CloudWatch synthetics is defined as follows:
- Synthetics is an orchestration service that offers a simple and effective configuration interface to continuously verify customer-facing application performance.
- Endpoints are monitored using a canary, implemented as an AWS Lambda function
- The Lambda function exposes a standard interface through which you inject some NodeJS code. This code is responsible for performing the “endpoint configuration” authentication and then validating the responses.
- You can also store responses to an S3 bucket and generate alarms for any value that falls beyond the pre-configured thresholds.
Here is a reference diagram for the general architecture of CloudWatch Synthetics.
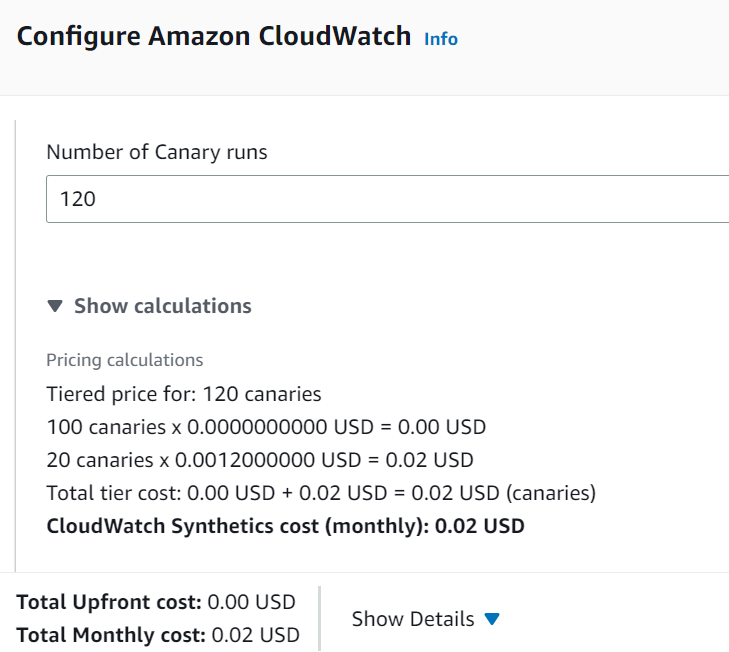
Cost
The pricing for Amazon AWS synthetic monitoring follows the pay-as-you-go concept just like many other AWS services. No minimum charges are levied.
Charges are incurred when you exceed 100 canary runs per month using CloudWatch Synthetics. To reduce cost, you should delete unnecessary canaries — sample pricing for N. Virginia region is as below. These costs do not include the S3 storage, CloudWatch alarm, or Lambda execution costs.
Note: Cost may vary for other regions.
Security Consideration
When creating and running a canary, you should consider security issues and follow the best practices:
- Secure Connection: Use encrypted connections that start with https://.
- Secret Manager: Do not store sensitive information in canary code. Use a secret manager to keep your secret safe.
- Log Data Protection: Detect and Mask sensitive data in Logs
- IAM Roles: Create a canary with an IAM execution role that allows the least privileges or permission.
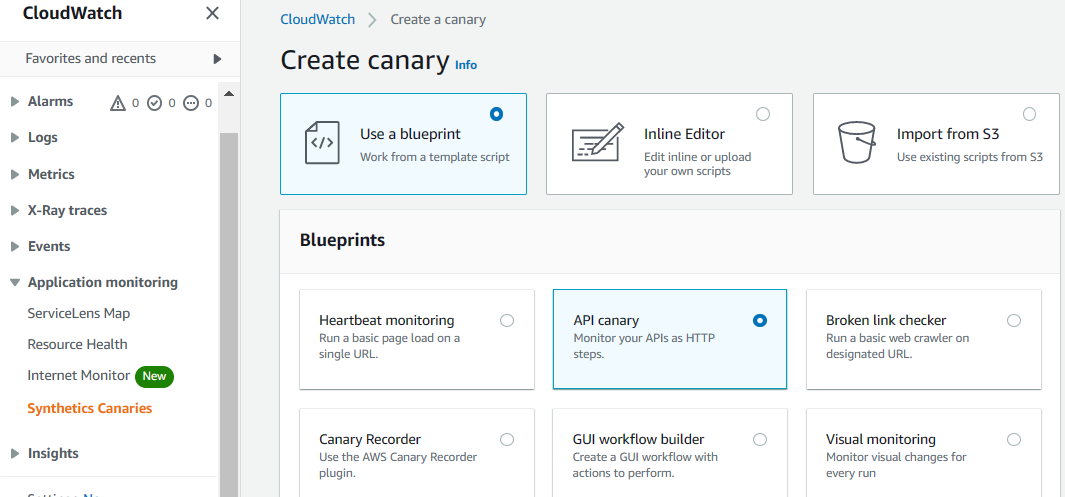
How To Create Canary
Canaries can be created using prebuilt blueprints or by creating custom canaries with CloudFormation templates.
Blueprints
You can create canaries by using ready-made code snippets using the blueprint option from the AWS management console. There are six types of blueprints available, and you can choose one among them according to your use case.
1. Heartbeat Monitoring
Heartbeat Monitoring loads the specified URL and stores the page’s screenshot and the HTTP archive file to monitor the URL’s status, duration, and failure reason. You can also use a Heartbeat Monitoring blueprint to monitor multiple URLs if you use syn-nodejs-puppeteer-3.1 or a later runtime version.
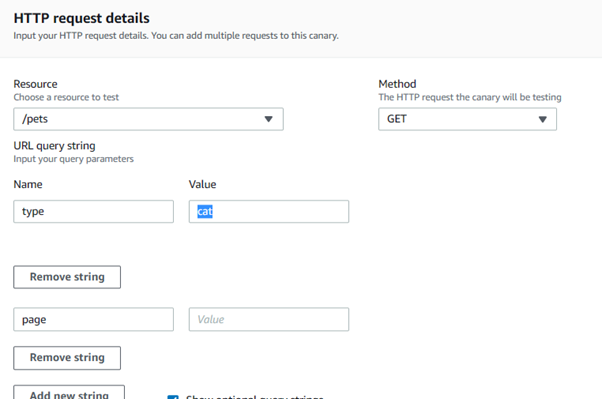
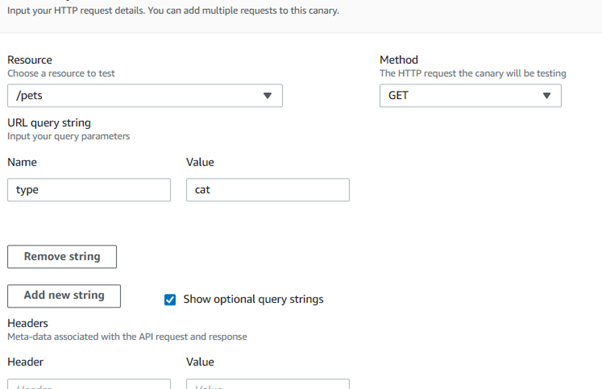
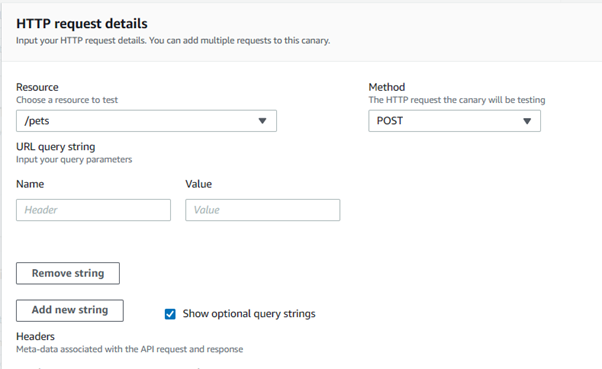
2. API Canary
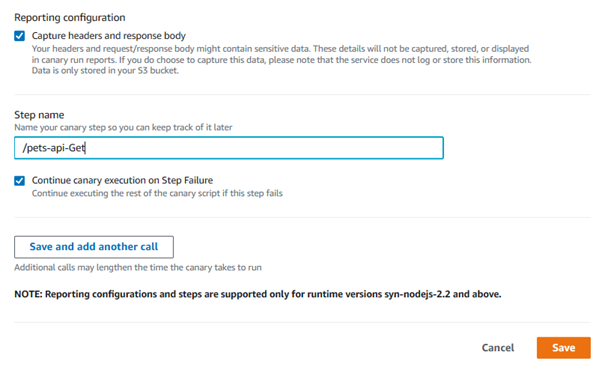
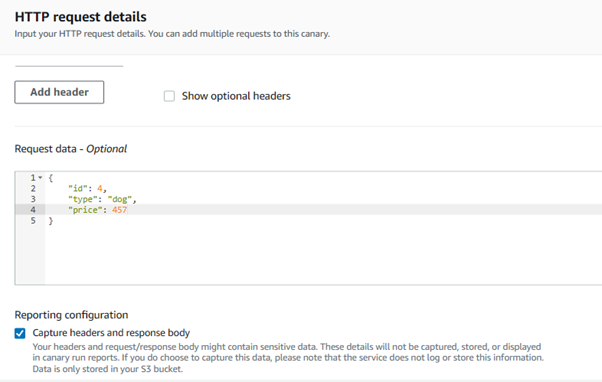
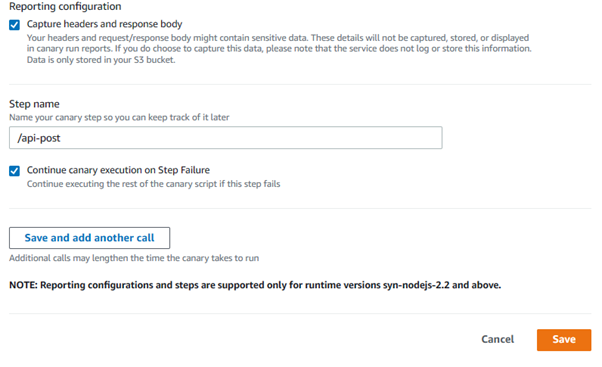
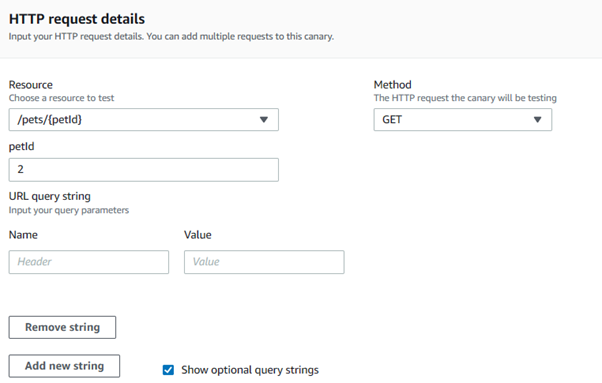
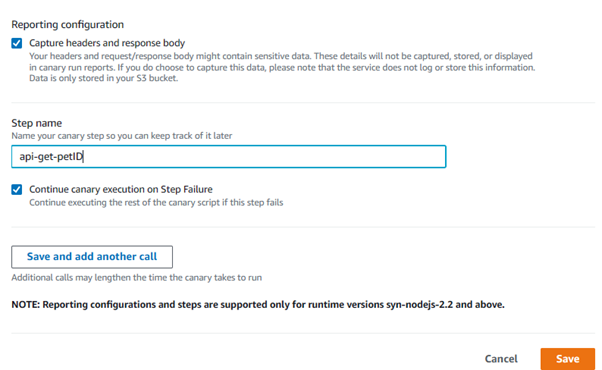
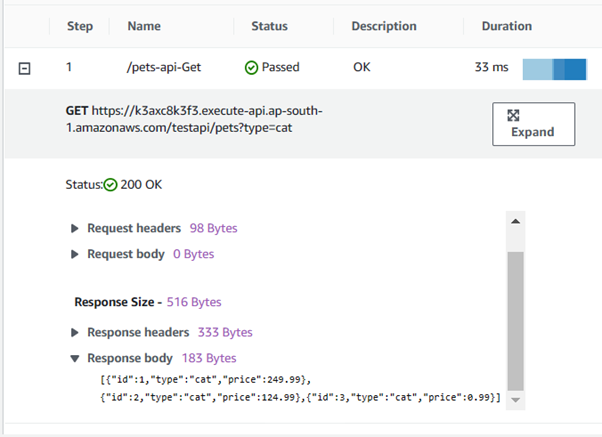
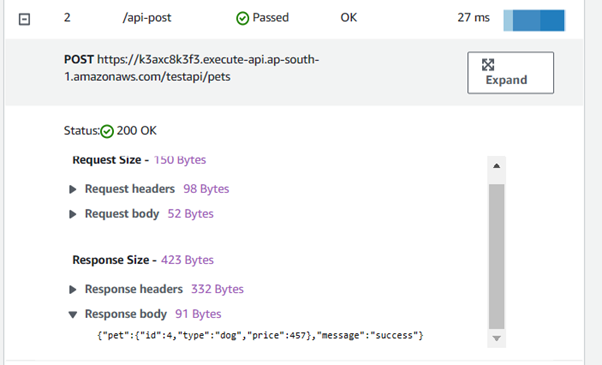
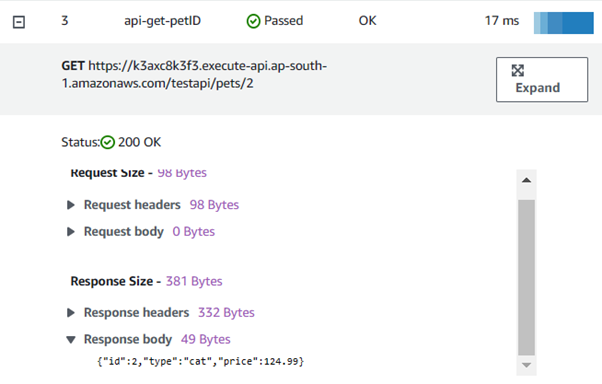
With the API Canary, you can monitor read and write methods such as GET, POST, PUT, and DELETE of REST API. The API Canary blueprint also supports multi-step canaries, which monitor your APIs as HTTP steps. You can test multiple APIs in a single canary, but each step will be a separate request that can access a different URL. You can prevent sensitive data from being recorded by not capturing headers and response bodies.
3. Broken Link Checker
A broken link checker canary is used to address the problem of broken links on websites. You can enter the starting point (URL) and the number of links to be checked. With this blueprint, you can check the following errors:
- 404 Page Not Found
- Bad URL
- Invalid Host Name
- Invalid HTTP response code
- The host server returns empty responses.
- The HTTP requests time out during the canary’s run.
- The host consistently drops connections.
4. Visual Monitoring
Visual monitoring is used to monitor visual defects in your web application. This visual monitoring blueprint compares screenshots taken during a canary run with screenshots from a baseline canary run.
5. Canary Recorder
The Canary Recorder blueprint enables the use of the CloudWatch Synthetics Recorder. The Synthetics Recorder is a Google Chrome Extension that help you to create canaries faster and easier. This records your click and type actions on the application and automatically generates a Node.js script.
6. GUI Workflow
GUI Workflow Builder Canary blueprint allows you to define test steps on your web applications. Below are the actions that you need to specify before using this blueprint:
Click — Selects the specified element and simulates a user clicking
Verify selector — Verifies that the element that you have specified exists on the webpage.
To verify in a Node.js script, you can specify an element using the format: [id=] or a[class=]. To verify in a Python script, you can specify an element using the format: xpath //*[@id=] or //*[class=].
Verify text — Verifies that the mentioned string is contained within the target element.
Input text — Writes the text that you have specified in the target element.
Click with navigation — Waits for the whole page to load after selecting the specified element.
Create Canary
Pre-Requisite: For demo purposes, I have deployed the pet-store API using this link.
Go to Cloudwatch -> Application Monitoring and select Synthetics Canaries.
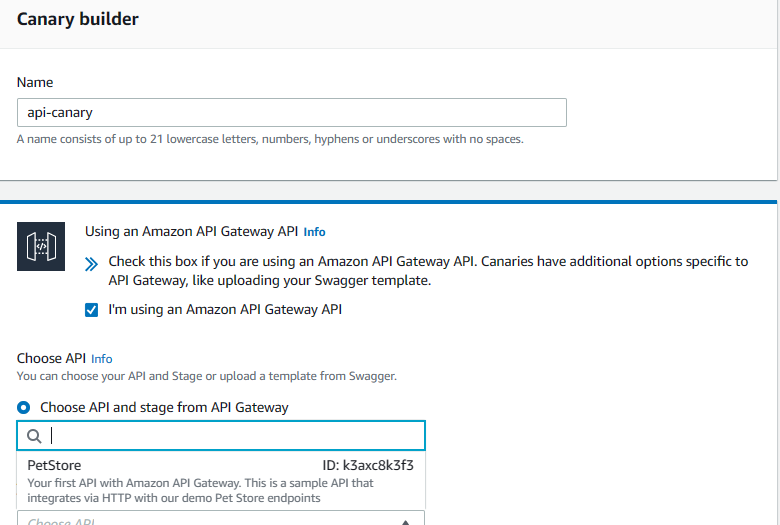
Create API Canary.
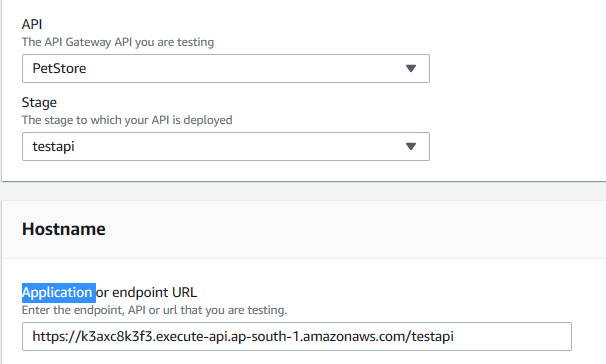
Select option “I am using an API gateway,” choose API, and then stage. CloudWatch Synthetics lists all the API endpoints and their stages in the current Region.

Select test API and the hostname will be automatically populated.
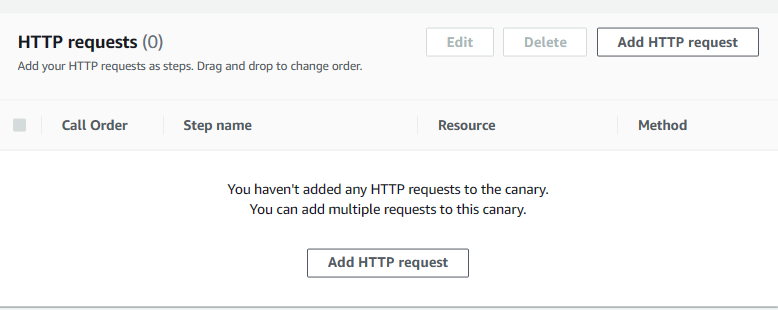
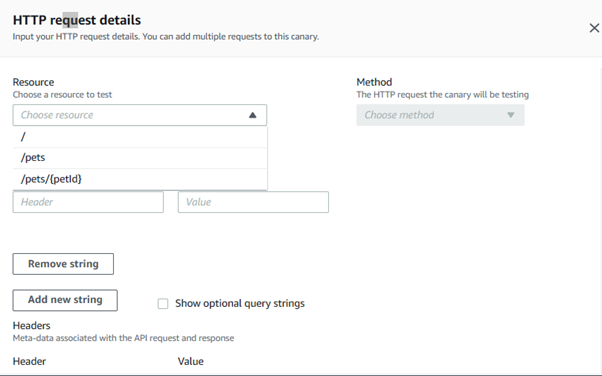
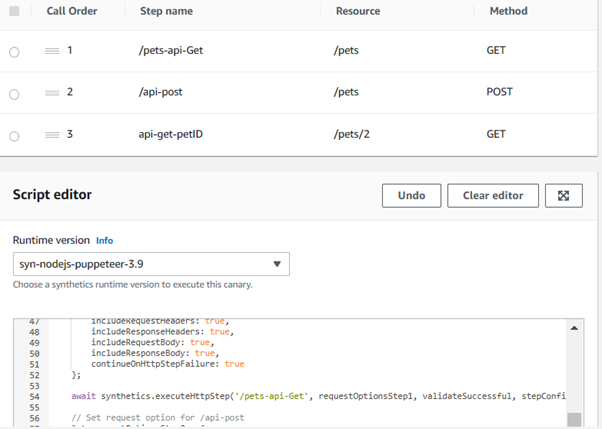
Configure the HTTP steps that the canary uses to monitor API endpoints.

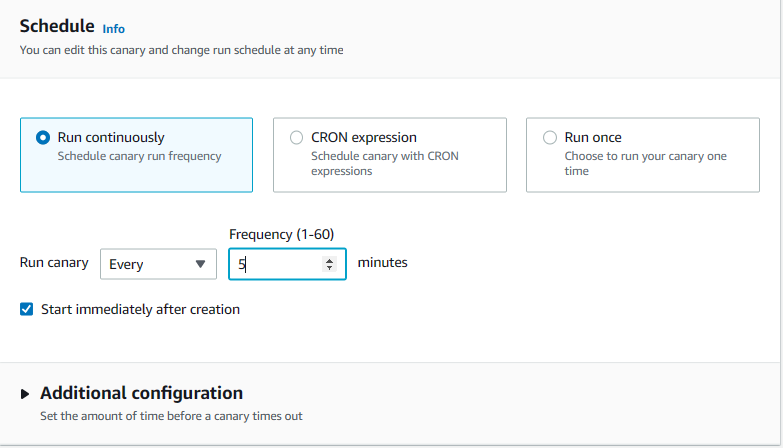
Schedule Canary
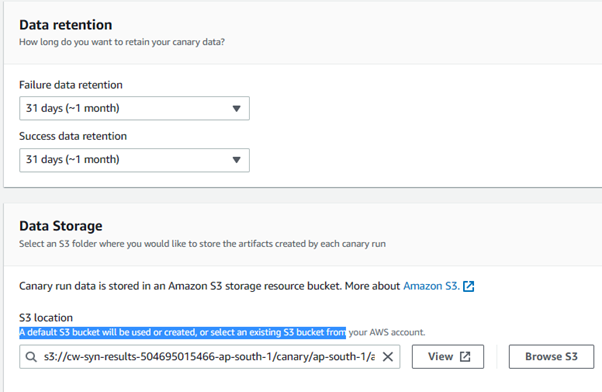
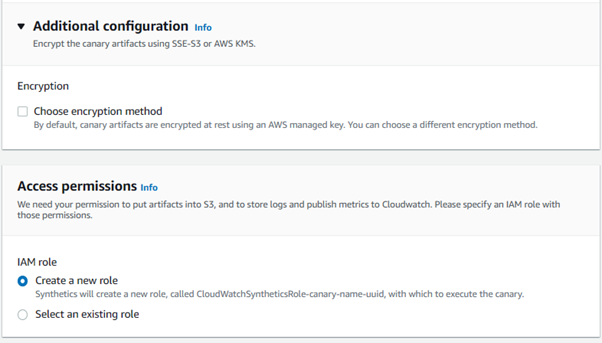
Configure other configuration parameters as “Data Retention, Storage, Access Permission.”
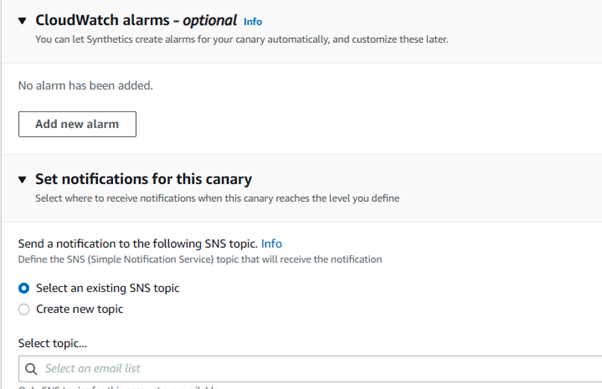
CloudWatch alarm can be configured while creating canaries or can be set up later as well.
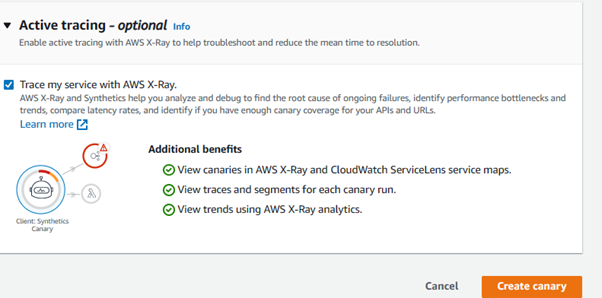
Synthetics can be integrated with X-Ray to debug and find the root cause of failure.
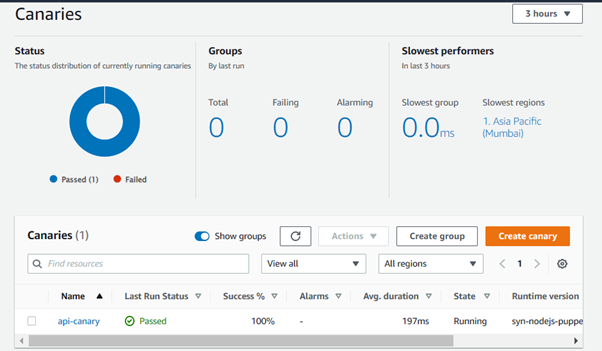
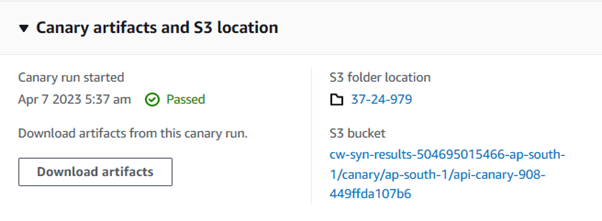
Canary is created.
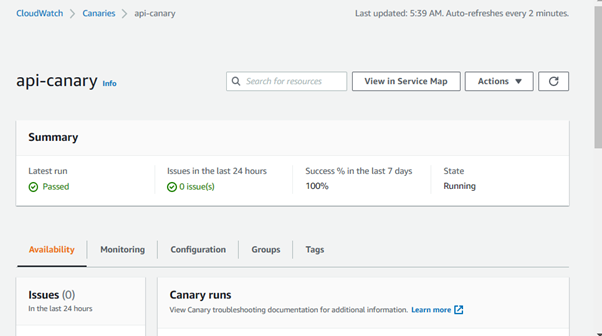
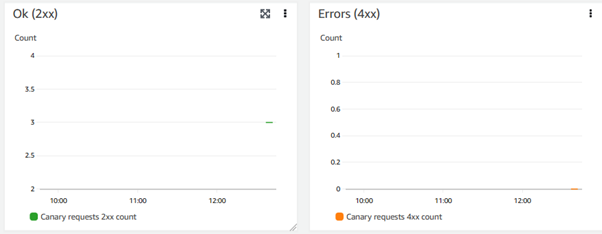
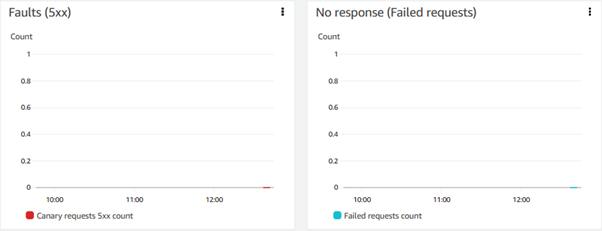
Go to canary -> availability section, expand the HTTPS requests configured, and verify the response.
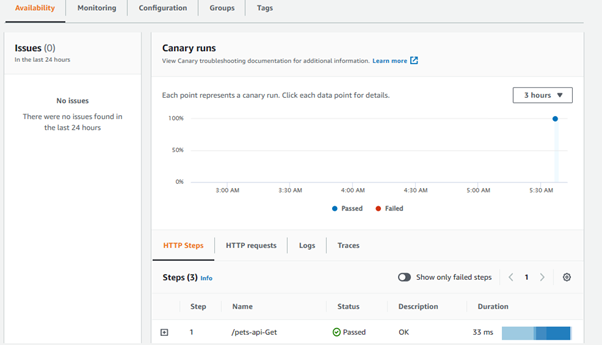
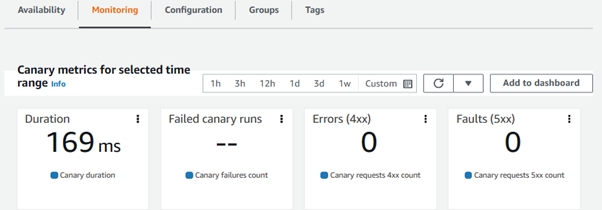
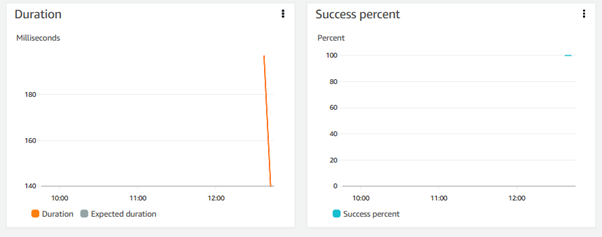
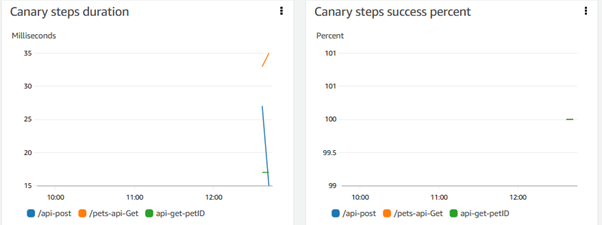
In the monitoring section, CloudWatch metrics for synthetics monitoring are displayed.
Alert Notifications
When a canary fails to obtain the expected result from the website or API endpoint, notifications are sent through CloudWatch Alarms and SNS. You can set up an alarm on the synthetic console wizard while creating synthetic canaries, or it can be set up later. You can configure SNS-topic to get the notification to your email inbox or incident response tooling (e.g., ServiceNow).
That is Amazon CloudWatch Synthetics in a nutshell.
Summary
In summary, AWS Synthetics provides a proactive and customizable monitoring solution by simulating user interactions with critical endpoints and workflows. Its integration with AWS RUM (Real-User Monitoring), extensive monitoring capabilities, serverless architecture, and seamless integration with other AWS services make it a powerful choice for monitoring application availability and performance. Additionally, its cost-effective pricing model adds value to organizations looking for efficient monitoring solutions.
Opinions expressed by DZone contributors are their own.
Comments