Architecting Observability in Kubernetes with OpenTelemetry and Fluent Bit
Microservices solve scalability problems but introduce troubleshooting nightmares. Here is a practical architectural pattern to unify logs, metrics, and traces.
Join the DZone community and get the full member experience.
Join For FreeIn the era of monolithic architectures, troubleshooting was relatively straightforward: SSH into the server, grep the log files, and check CPU usage with top.
In the cloud-native world — specifically within Kubernetes — this approach is obsolete. Applications are split into dozens of microservices, pods are ephemeral (spinning up and terminating automatically), and a single user request might traverse ten different nodes. When a transaction fails, where do you look?
If you don’t have a robust observability strategy, you are essentially flying blind. This article outlines a proven architectural pattern to establish observability by leveraging OpenTelemetry, Fluent Bit, and structured logging.
The Problem: The Distributed Blind Spot
Moving to a microservices architecture on Kubernetes introduces three distinct visibility challenges:
- Ephemeral Data: When a pod crashes or scales down, its local logs are destroyed. You cannot rely on local disk storage.
- Fragmented Context: A transaction flows through Service A, Service B, and Service C. If Service C fails, Service A may only log a generic "500 Error." There is no easy way to link the error in Service C back to the request in Service A.
- Siloed Telemetry: Logs, metrics, and traces often live in different tools, making correlation nearly impossible during a 3 a.m. outage.
To solve this, we must move from simple monitoring (Is the system up?) to observability (Why is the system behaving this way?).
The Architecture: A Unified Telemetry Pipeline
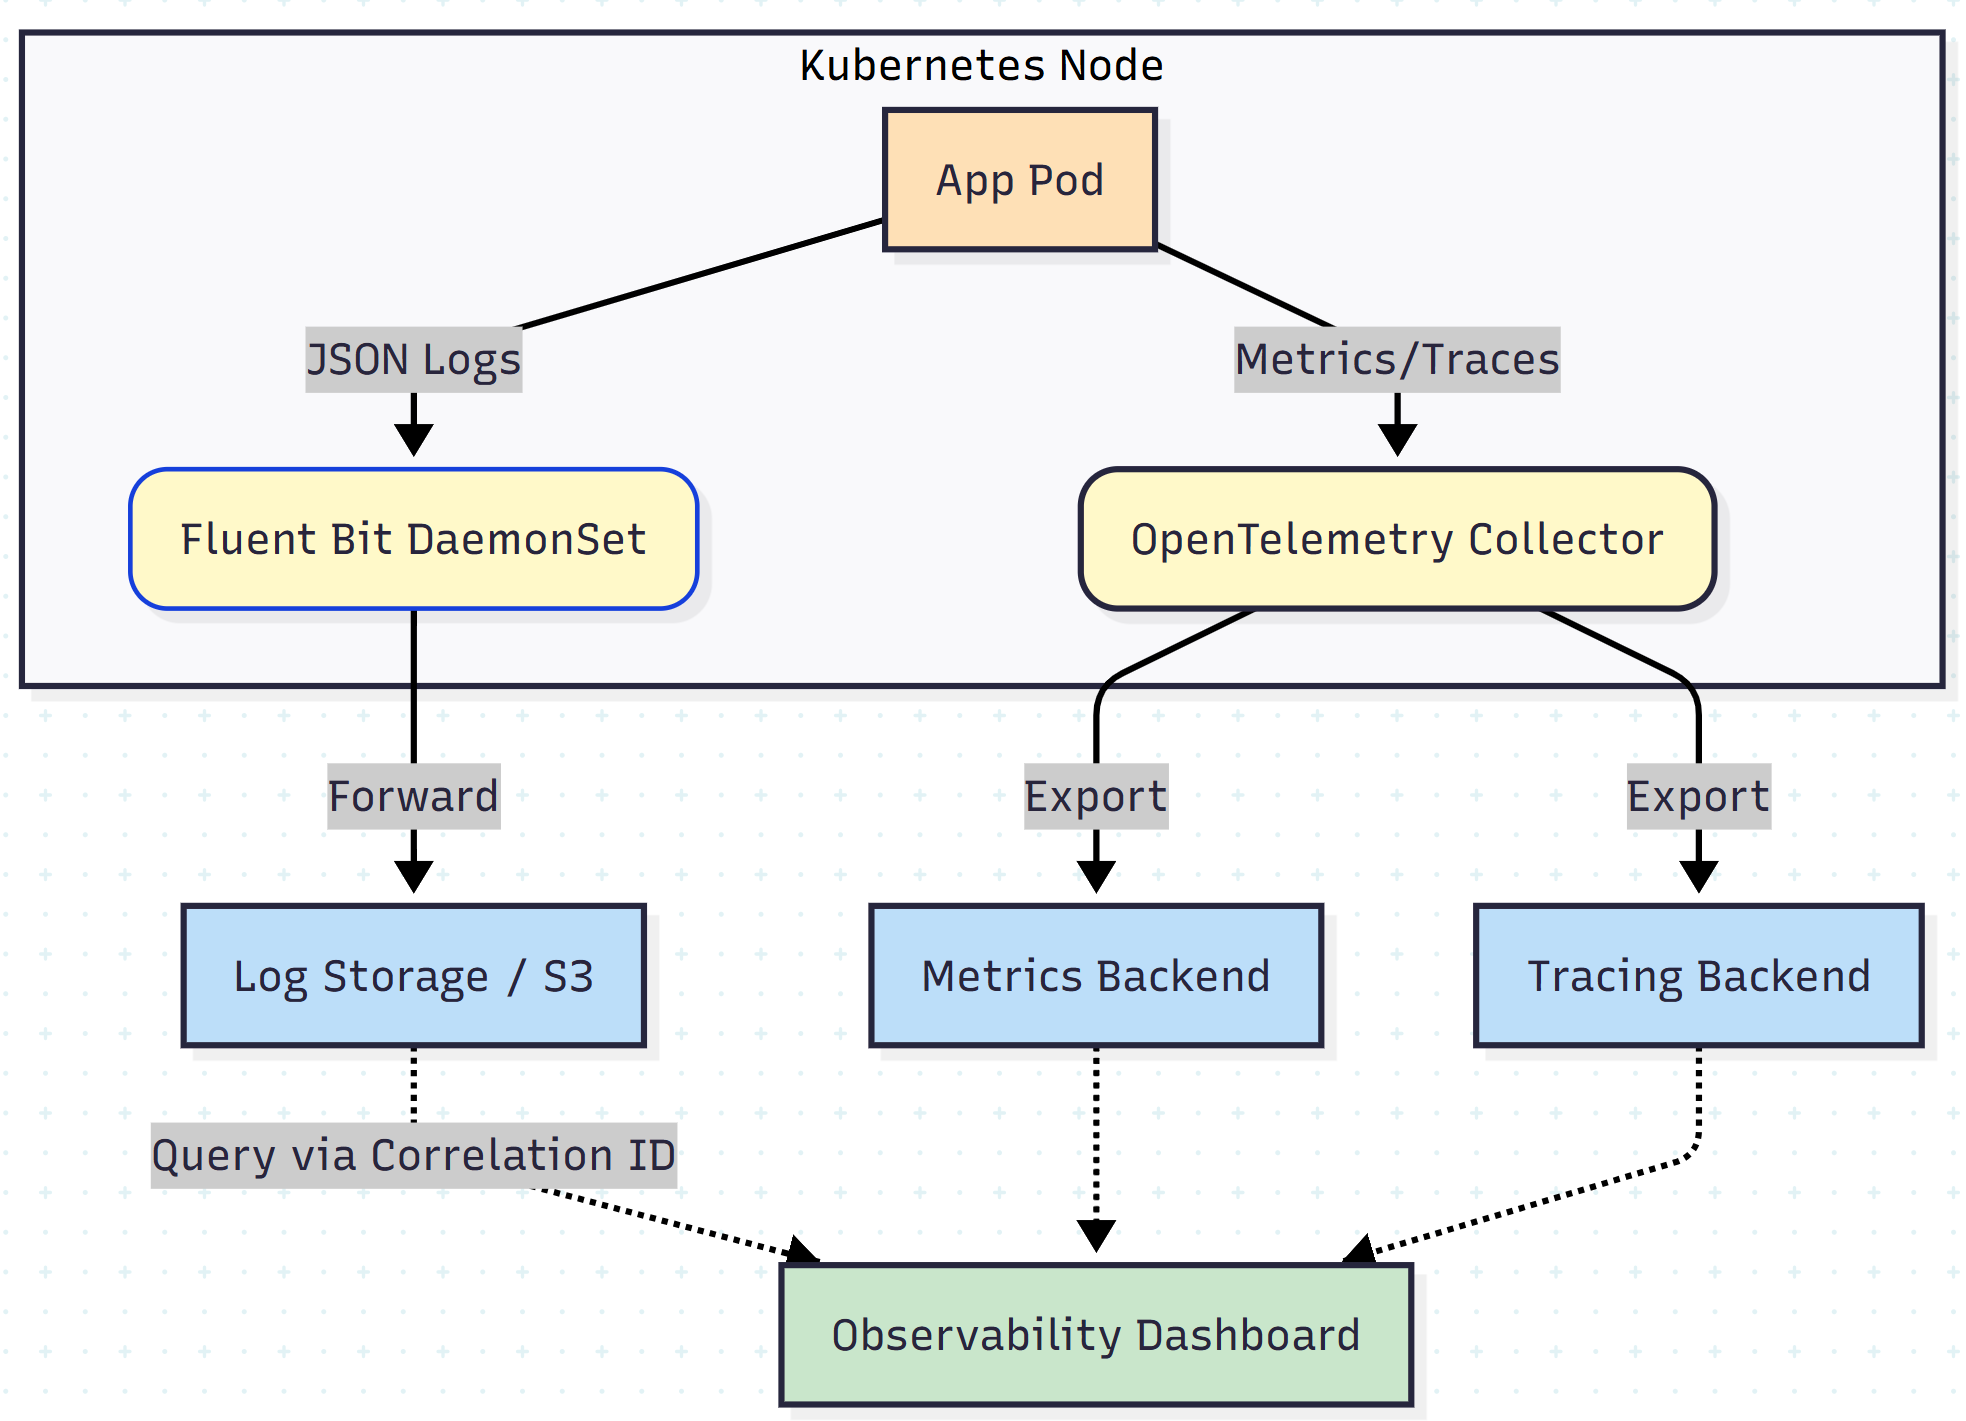
The solution involves building a pipeline that standardizes data generation at the source and centralizes it for analysis.
The stack:
- Logs: Fluent Bit (collection) → Object storage (S3/Athena) or a log aggregator
- Metrics: OpenTelemetry Collector → Prometheus / CloudWatch
- Tracing: OpenTelemetry SDK → Distributed tracing backend
Below is the high-level data flow:
Step 1: Structured Logging and Context Propagation
The first step isn’t infrastructure — it’s code. Text-based logs are difficult to parse programmatically. Applications must emit logs in JSON format.
More importantly, we must inject trace context into those logs. By adopting the W3C Trace Context standard, every service passes a traceparent header to the next service.
The “Golden Key”: Trace IDs
When an application logs an event, it must include the current trace_id and span_id. This is the glue that binds logs to traces.
Example of a structured log entry:
{
  "timestamp": "2024-10-27T10:00:00Z",
  "level": "ERROR",
  "service": "payment-service",
  "message": "Database connection timeout",
  "trace_id": "0af7651916cd43dd8448eb211c80319c",
  "span_id": "b7ad6b7169203331",
  "http_status": 503
}
By querying for trace_id: 0af7651916cd43dd8448eb211c80319c, you can instantly retrieve every log line generated by that specific user request across all microservices.
Step 2: The Log Shipping Layer (Fluent Bit)
Because Kubernetes logs are ephemeral, they must be shipped immediately. Fluent Bit is the industry standard here due to its lightweight footprint and high performance.
Deployed as a DaemonSet (one agent per node), Fluent Bit tails container log files, parses the JSON, and flushes them to an external destination.
Why Object Storage (S3)?
While sending logs to Elasticsearch or Splunk is common, high-volume systems can generate terabytes of logs per day. A cost-effective pattern is shipping logs to Amazon S3 (or similar object storage) and using a query engine such as Amazon Athena to analyze them on demand.
Sample Fluent Bit configuration:
[INPUT]
    Name              tail
    Path              /var/log/containers/*.log
    Parser            docker
    Tag               kube.*

[FILTER]
    Name              kubernetes
    Match             kube.*
    Kube_URL          https://kubernetes.default.svc:443

[OUTPUT]
    Name              s3
    Match             *
    Bucket            my-app-logs-bucket
    Region            us-east-1
    Total_FileSize    100M
    Upload_Timeout    1m
Step 3: Unifying Metrics with OpenTelemetry
Historically, metrics were collected by proprietary agents. OpenTelemetry (OTel) has standardized this process.
By deploying the OpenTelemetry Collector, we create a vendor-agnostic way to receive metrics from applications. The pipeline consists of three stages:
- Receivers: Ingest data (e.g., OTLP, Prometheus receiver)
- Processors: Filter, batch, or enrich data (e.g., adding Kubernetes metadata such as namespace or pod name)
- Exporters: Send data to the backend of choice (Prometheus, Datadog, CloudWatch, etc.)
This decoupling allows you to change observability vendors without rewriting a single line of application code.
The Result: Correlation and Root Cause Analysis
Implementing this architecture fundamentally transforms the troubleshooting workflow.
The "Before" Workflow
- User reports an error
- Engineer guesses which service failed
- Engineer SSHs into nodes or checks scattered log groups
- Engineer realizes the error is upstream and repeats step 3
Time elapsed: ~4 hours
The "After" Workflow
- Engineer receives an alert containing a
trace_id - Engineer queries the trace ID in the central dashboard
- The distributed trace visualizes the request flow, highlighting the exact span that failed (e.g., “SQL Timeout” in Service C)
- Engineer clicks the span to view correlated JSON logs for context
Time elapsed: ~10 minutes
Conclusion
Observability in cloud-native environments is not about collecting more data — it’s about collecting connected data.
By enforcing structured logging with trace IDs at the application level, using Fluent Bit for efficient log transport, and leveraging OpenTelemetry for standardized metrics, engineering teams can regain control over complex distributed systems. This approach not only reduces Mean Time to Recovery (MTTR) but also establishes a scalable foundation for future growth.
Opinions expressed by DZone contributors are their own.
Comments