Better FreeRTOS Debugging in Eclipse
If you're debugging FreeRTOS applications, here are a few configuration tips you can keep up your sleeve that will save time and give you more accurate results.
Join the DZone community and get the full member experience.
Join For FreeWhen debugging FreeRTOS applications in Eclipse, it is a big deal to have views available showing all the threads, queues, timers, and heap memory allocation. Some of the best Eclipse plugins are the ones NXP provides for FreeRTOS: They are free of charge and give me pretty much everything I need. However, if you are not that familiar with FreeRTOS itself, here are a few tips to get more out of the plugins.

Better FreeRTOS Debugging in Eclipse
In this article, I show several tips and FreeRTOS configuration settings to make debugging FreeRTOS in Eclipse easier. There are several settings in FreeRTOS that store more information in the kernel. While this usually has a small price (RAM, ROM, execution time), it greatly simplifies debugging FreeRTOS applications. And if you are concerned about the overhead, you can turn it off after debugging.
Version Used
I’m using in this article Kinetis Design Studio V3.2.0 (Eclipse Luna) with the plugin version 1.0.1.201610061345, which is available from this Eclipse update site.

FreeRTOS Kernel Awareness
For installation instructions, see FreeRTOS Kernel Awareness for Eclipse from NXP.
For FreeRTOS, I’m using the latest FreeRTOS V9.0.0 with some V9.01 extensions (see McuOnEclipse Components: 12-Mar-2017 Release). If you want to have the source code, it is available on GitHub.
In FreeRTOS, the Task Control Block (TCB) has information about the task (priority, name, etc. There is a number in that TCB that gets incremented each time a TCB (or task) is created, kind of a ‘process ID’. That ID is only present if the following define is set to one (enabled) in FreeRTOSConfig.h:
#define configUSE_TRACE_FACILITY 0 /* 1: include additional structure members and functions to assist with execution visualization and tracing, 0: no runtime stats/trace */If that define is set to 0, then the TCB numbers are not available and not shown:

Task Control Block with no TCB number
Enable that configUSE_TRACE_FACILITY or use the following setting in the component:

Enabled Trace Facility
And now it shows the TCB number in the view:

TCB Numbers Shown
Be aware that this setting not only adds the TCB number, but turns on other debugging features: It will increase the RAM and ROM footprint of your application.
The TCB numbers itself do not offer big value, but I can see in which order the tasks have been created, if I’m interested in that information.
Task Name
Maybe you see the task names truncated or as ‘Unknown’:

Unknown Task Names
Then check the following setting in FreeRTOSConfig.h (it has to be set to >0):
#define configMAX_TASK_NAME_LEN 12 /* task name length in bytes */It defines how many characters (including the zero byte) are used for the task name string. The same setting can be found here:

Task Name Length
Don’t use a task name that's too long, as it consumes more RAM. A number of about 10-15 bytes should be enough.
FreeRTOS has a feature to show the performance of each task (Runtime information). By default, the view might show nothing:

Performance Analysis
To measure the performance, FreeRTOS is measuring how long a task is running: Basically, it stores the runtime when the task gets switched out. So each task counts its execution time. To use this, the following configuration define in FreeRTOSConfig.h needs to be turned on:
#define configGENERATE_RUN_TIME_STATS 0 /* 1: generate runtime statistics; 0: no runtime statistics */Depending on what other functions you use (e.g. vTaskGetRunTimeStats()), I recommend having the following defines enabled, too:
#define configUSE_STATS_FORMATTING_FUNCTIONS      1
#define configUSE_TRACE_FACILITY                  1
In addition to that, I have to provide a timer to measure the time. As a non-standard FreeRTOS feature, in the McuOnEclipse FreeRTOS port, I can use the RTOS tick counter as the time base with the following define:
#define configGENERATE_RUN_TIME_STATS_USE_TICKS 1 /* 1: Use the RTOS tick counter as runtime counter. 0: use extra timer */Using the McuOnEclipse FreeRTOS component, I can use the following settings:

Using Runtime Statistics
Using runtime statistics increases the RAM and ROM footprint of your application, too.
Using the RTOS tick counter will only count tasks that run longer than the tick period (e.g. 1 ms). It's usually not precise enough. In the example below, every task runs in less than the tick period, so the timing shows up as zero: The Main, Led and TmrSvc tasks are running in less than 1 ms (tick period) and do not get counted. The IDLE task itself runs for more than 1 ms, so it counts for 0x1ba8 milliseconds:

Runtime with a 1 ms counter
Typically, the time base for the performance measurement should be at least 10 times faster than the RTOS tick period. I can use a dedicated timer (say with a 0.1 ms period):

Runtime Counter

Runtime Counter with 0.1 ms Period
With this, I get a better measurement of the tasks:

Runtime Timing
Keep in mind that the extra timer is affecting the overall system load.
Queues, Mutex, and Semaphore
In FreeRTOS, both mutex and semaphores are in fact queues (with no data). Unlike tasks (which get a name at creation time), queues have no name by default. Then, you get this:

No Queue Registry Information
As indicated in the dialog, I have to set the following define to a value greater zero:
#define configQUEUE_REGISTRY_SIZE 10That same setting is here:

Queue Registry Size
The value defines how many queue names I’m able to register, or the number of queues present in the system at any time. I have to give the queues (and semaphore, and mutex) a name using the vQueueAddToRegistry() function:
  sem = xSemaphoreCreateBinary();
  if (sem==NULL) { /* semaphore creation failed */
    for(;;){} /* error */
  }
  vQueueAddToRegistry(sem, "MySemaphore");
With this, the queues show up with names:

Queues with Names
Additionally, if a task is waiting on a queue/semaphore/mutex, it is displayed with its name in the task list:

Task waiting on queue object
By default, on the ARM Cortex-M, FreeRTOS only records in the TCB for the task stack:
- Start of stack area
- Current stack pointer
- Maximum used stack location
But not the end of the stack. So, the debugger does not know the real stack size allocated for the task. In the screenshot below, I have allocated 400 bytes for the Main task, but it does not show that:

Stack Usage with no stack size
To solve this, have the following set to 1 in FreeRTOSConfig.h
#define configRECORD_STACK_HIGH_ADDRESS 1 /* 1: record stack high address for the debugger, 0: do not record stack high address */The same setting can be found here:

Record Stack High Address
With that setting, I get (almost) the correct settings:

Showing Task Stack Size
The stack size (392 bytes) is almost correct (should be 400 bytes), probably because the first and last entry is not counted.
Heap Usage
FreeRTOS supports, by default, up to five different heap allocation methods (schemes).

FreeRTOS Heap Schemes
The normal way is just to have one of them in the build, and the others deleted/removed from the project.
Because this is very painful and makes it hard to switch between the different memory schemes, the McuOnEclipse FreeRTOS port adds the following macro in FreeRTOSConfig.h, which identifies the memory scheme:
#define configUSE_HEAP_SCHEME 4 /* either 1 (only alloc), 2 (alloc/free), 3 (malloc), 4 (coalesc blocks), 5 (multiple blocks) */The NXP FreeRTOS Heap Usage view in Eclipse tries to ‘guess’ the used heap scheme based on the heap buffer variable name (if it is present, which name is used). Because of this, there is this information icon:
Heap Usage Information Icon
To help the view to identify the correct heap scheme used, I can add a variable to my code which tells the view which scheme is used:

Helper for Memory Scheme
To add the helper, use something like this to the application code:
const uint8_t freeRTOSMemoryScheme = configUSE_HEAP_SCHEME;
You have to make sure that this variable is not optimized by the linker (e.g. use it in your application code). A convenient way is to use the following setting which takes care of everything:

Heap Indication Constant
There is a bug in the version 1.0.1 of the NXP Kernel Awareness Plugin: If the variable freeRTOSMemoryScheme is present, it is always read with a value of 5, which is wrong. That bug has been reported and should be fixed in the next version. Until then, best if freeRTOSMemoryScheme is not used.
If you have one of the FreeRTOS views open, it means the view fetches the data from the target when I stop or step with the debugger. This can take up to a second or more, so it makes debugging very slow. One solution is to put the views into the background. I was at Embedded World Nürnberg this week and saw a demo of the MCUXpresso IDE: It feature new versions of the FreeRTOS plugins, and it has ‘pause’ button. That way, I can keep the views in the foreground, but they are paused and do not read from the target:

Thread-Aware Debugging
By default, Eclipse shows only one thread or task in the debug window. The OpenOCD, P&E, and Segger debug connections can support thread-aware debugging: With this, I can debug each task in its own context:
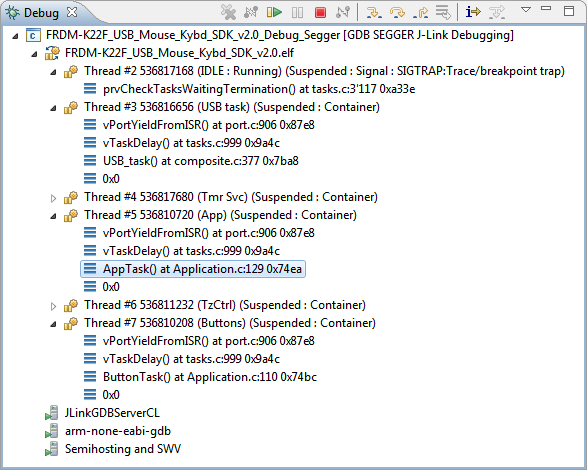
FreeRTOS Thread Awareness with Segger GDB
The following articles describe how to enable this for Eclipse or the SEGGER Ozone Debugger:
- FreeRTOS Thread Debugging with Eclipse and OpenOCD
- P&E ARM Cortex-M Debugging with FreeRTOS Thread Awareness and Real Time Expressions for GDB and Eclipse
- FreeRTOS Thread Debugging with Segger GDB in Eclipse
- FreeRTOS ARM Thread Debugging with Eclipse and GDB
- FreeRTOS Kernel Awareness with Ozone
FreeRTOS has a way to include extra helpers using the following at the end of the task.c file:
#if( configINCLUDE_FREERTOS_TASK_C_ADDITIONS_H == 1 && configUSE_TRACE_FACILITY==1)

    #include "freertos_tasks_c_additions.h"

#ifdef FREERTOS_TASKS_C_ADDITIONS_INIT
static void freertos_tasks_c_additions_init( void )
    {
        #ifdef FREERTOS_TASKS_C_ADDITIONS_INIT
            FREERTOS_TASKS_C_ADDITIONS_INIT();
        #endif
    }
#endif
This can be enabled in the FreeRTOS component using two settings:

Task C Addition Settings
An example implementation of such additions file can be found on GitHub.
FreeRTOS Tracing
FreeRTOS features instrumented tracing. One solution is to use Percepio Tracealizer:

Another solution is the SEGGER SystemView:

Scheduler time spent in Segger SystemView
The following articles point to the latest articles:
- Percepio FreeRTOS Tracealyzer Plugin for Eclipse
- Segger SystemView: Realtime Analysis and Visualization for FreeRTOS
I hope this article helps you debug FreeRTOS applications. There are several settings shown above that really makes life easier. On top of that, there are tracing solutions with FreeRTOS that help beyond ‘stop-mode’ debugging.
Keep in mind that the debugging helpers are not coming for free: To reduce the footprint of the application, I recommend turning them off. There are more things to consider when optimizing FreeRTOS applications: If there is enough interest, I could write an article about that topic, too. Simply let me know!
Happy debugging!
Published at DZone with permission of Erich Styger. See the original article here.
Opinions expressed by DZone contributors are their own.
Comments