Build Test Scripts for Your IoT Platform
Use JMeter to build test scripts for complex test scenarios in your IoT environment.
Join the DZone community and get the full member experience.
Join For FreeIn a previous article, I introduced the open-source test tool JMeter and used a simple HTTP test as an example to demonstrate its capabilities. This article shows you how to build test scripts for complex test scenarios.
The user interface displays a JMeter test script in the "tree" format. The saved test script (in the .jmxformat) is XML. The JMeter script tree treats a test plan as the root node, and the test plan includes all test components. In the test plan, you can configure user-defined variables called by components throughout the entire test plan. Variables can also thread group behavior, library files used in the test, and so on. You can build rich test scenarios using various test components in the test plan.
Test components in JMeter generally have the following categories:
- Thread group
- Sampler
- Logic controller
- Listener
- Configuration element
- Assertion
- Timer
- Pre-processor
- Post-processor
Thread Groups
A thread group is the beginning point for all test plans (so all samplers and controllers must be placed under a thread group). A thread group can be regarded as a virtual user pool in which each thread is essentially a virtual user, and multiple virtual users perform the same batch of tasks simultaneously. Each thread is independent and doesn't affect the others. During the execution of one thread, the variable of the current thread doesn't affect the variable value of other threads.
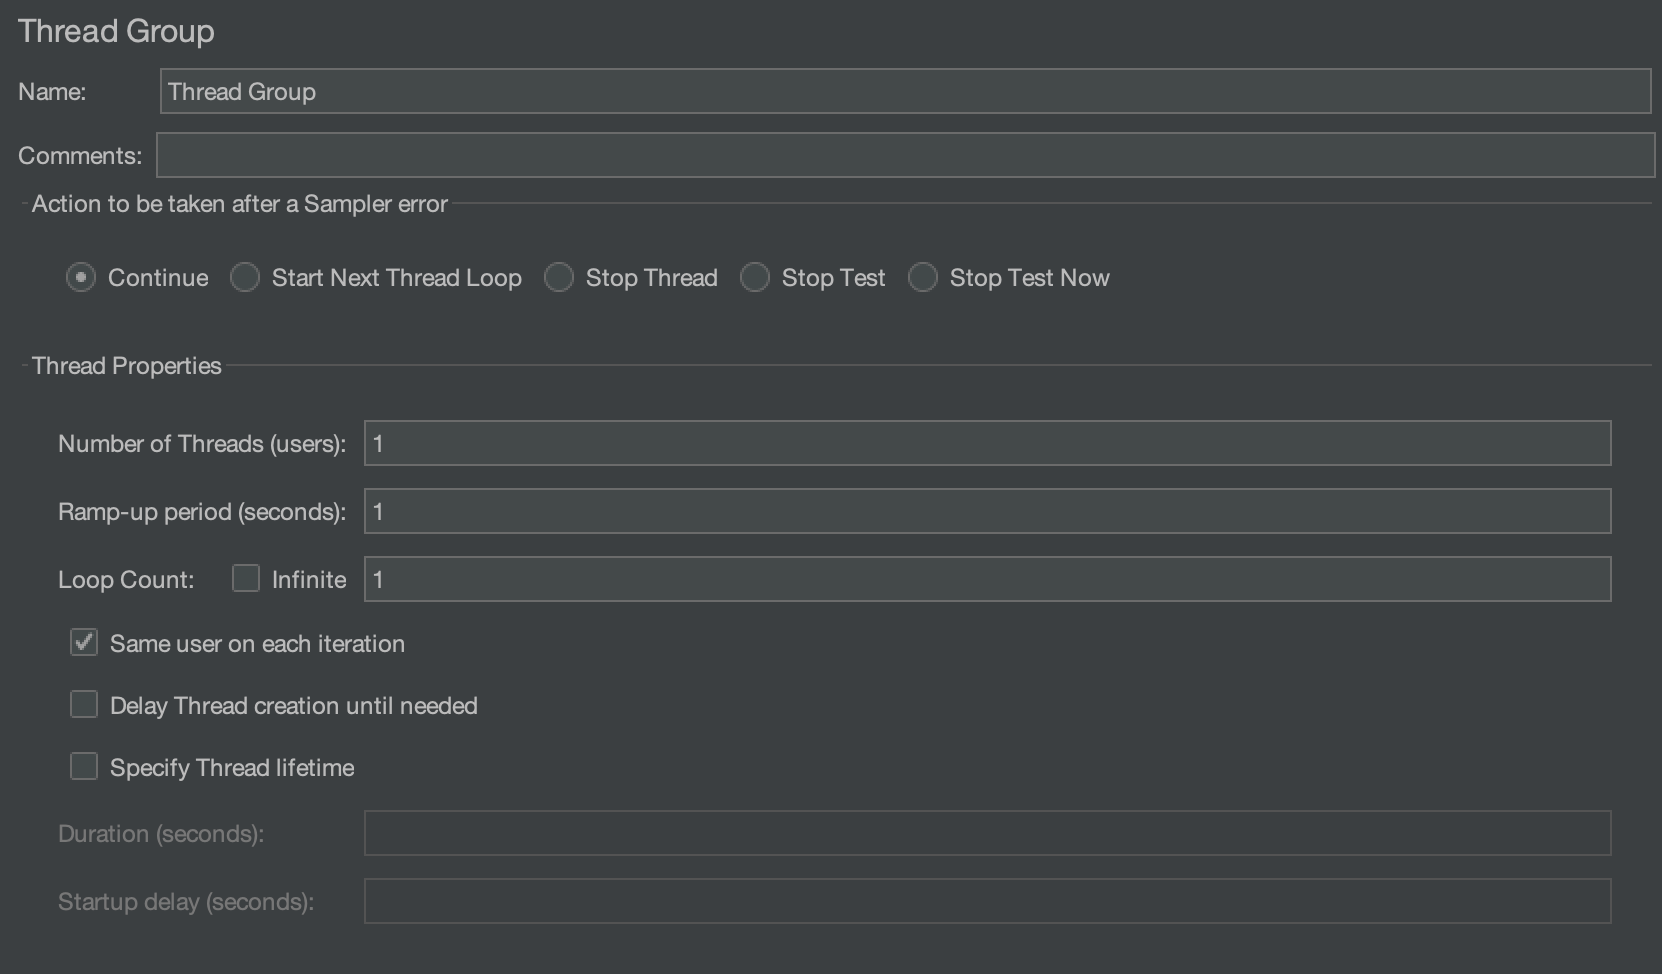
In this interface, the thread group can be configured in various ways.
1. Action to Be Taken After a Sampler Error
The following configuration items control whether a test continues when an error is encountered:
- Continue: Ignore errors and continue execution.
- Start Next Thread Loop: Ignore the error, terminate the current loop of the thread, and execute the next loop.
- Stop Thread: Stop executing the current thread without affecting the normal execution of other threads.
- Stop Test: Stop the entire thread after executing threads have finished the current sampling.
- Stop Test Now: The entire test execution stops immediately, even if it interrupts currently executing samplers.
2. Number of Threads
This is the number of concurrent (virtual) users. Each thread runs the test plan completely independently without interfering with any others. The test uses multiple threads to simulate concurrent access to the server.
3. Ramp-Up Period
The ramp-up time sets the time required to start all threads. For example, if the number of threads is set to 10 and the ramp-up time is set to 100 seconds, then JMeter uses 100 seconds to start and runs 10 threads (each thread begins 10 seconds after the previous thread was started).
If the ramp-up value is set small and the number of threads is set large, there's a lot of stress on the server at the beginning of the test.
4. Loop Count
Sets the number of loops per thread in the thread group before ending.
5. Delay Thread Creation Until Needed
By default, all threads are created when the test starts. If this option is checked, threads are created when they are needed.
6. Specify Thread Lifetime
Control the execution time of thread groups. You can set the duration and startup delay (in seconds).
Samplers
A sampler simulates user operations. It's a running unit that sends requests to the server and receives response data from the server. A sampler is a component inside a thread group, so it must be added to the thread group. JMeter natively supports a variety of samplers, including a TCP Sampler, HTTP Request, FTP Request, JDBC Request, Java Request, and so on. Each type of sampler sends different requests to the server according to the set parameters.
TCP Sampler
The TCP Sampler connects to the specified server over TCP/IP, sends a message to the server after the connection is successful, and then waits for the server to reply.
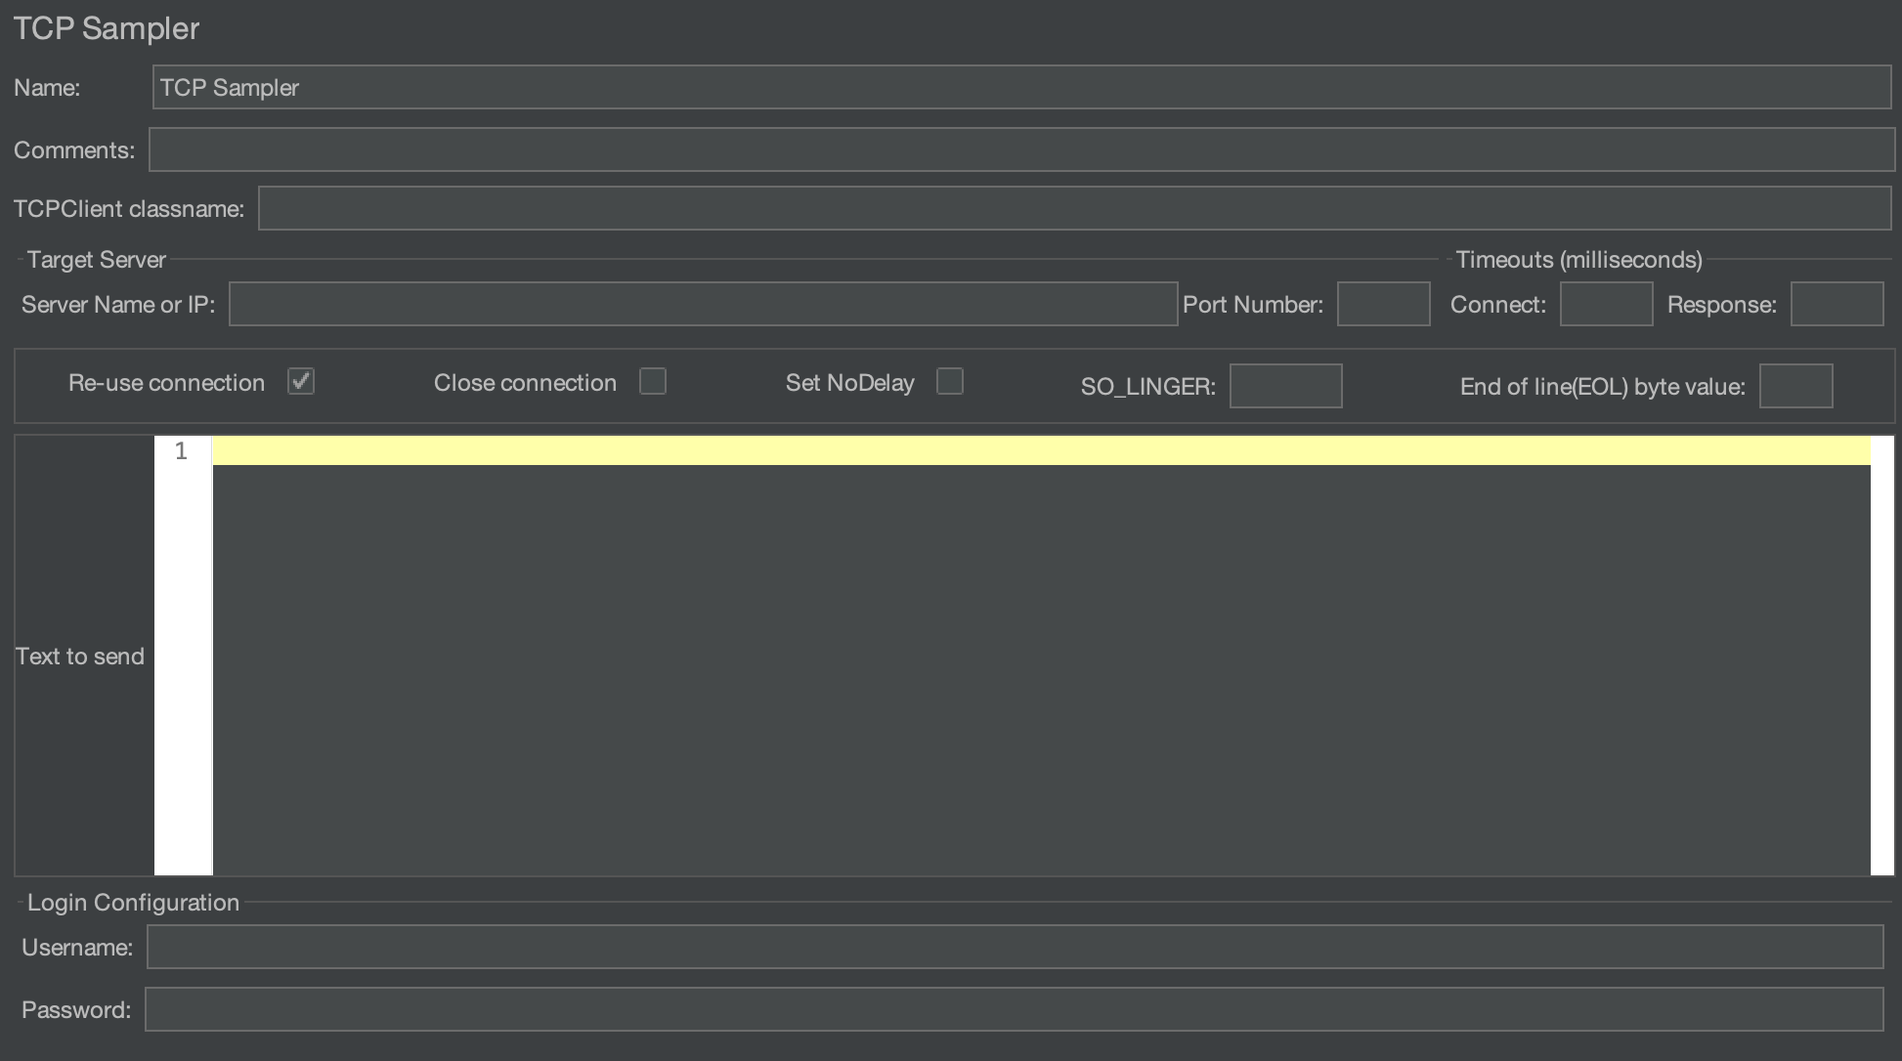
The properties that can be set in the TCP Sampler are as follows:
TCPClient Classname
This represents the implementation class that handles the request. By default, org.apache.jmeter.protocol.tcp.sampler.TCPClientImpl is used, and plain text is used for transmission. In addition, JMeter also has built-in support for BinaryTCPClientImpl and LengthPrefixedBinaryTCPClientImpl. The former uses hexadecimal packets, and the latter adds a 2-byte length prefix to BinaryTCPClientImpl.
You can also provide custom implementation classes by extending org.apache.jmeter.protocol.tcp.sampler.TCPClient.
- Target server settings: Server Name or IP and Port Number specify the hostname or IP address and port number of the server application.
- Connection Options: Determines how you connect to the server.
- Re-use connection: If enabled, this connection is always open; otherwise, it's closed after reading data.
- Close Connection: If enabled, this connection is closed after the TCP sampler has finished running.
- Set No-Delay: If enabled, the Nagle algorithm is disabled, and the sending of small packets is allowed.
- SO_LINGER: Controls whether to wait for data in the buffer to complete transmission before closing the connection.
- End of line (EOL) byte value: Determines the byte value at the end of the line. The EOL check is skipped if the specified value is greater than 127 or less than -128. For example, if a string returned by the server ends with a carriage return, you can set this option to 10.
- Timeouts: Set the connect timeout and response timeout.
- Text to send: Contains the payload you want to send.
- Login configuration: Sets the username and password used for the connection.
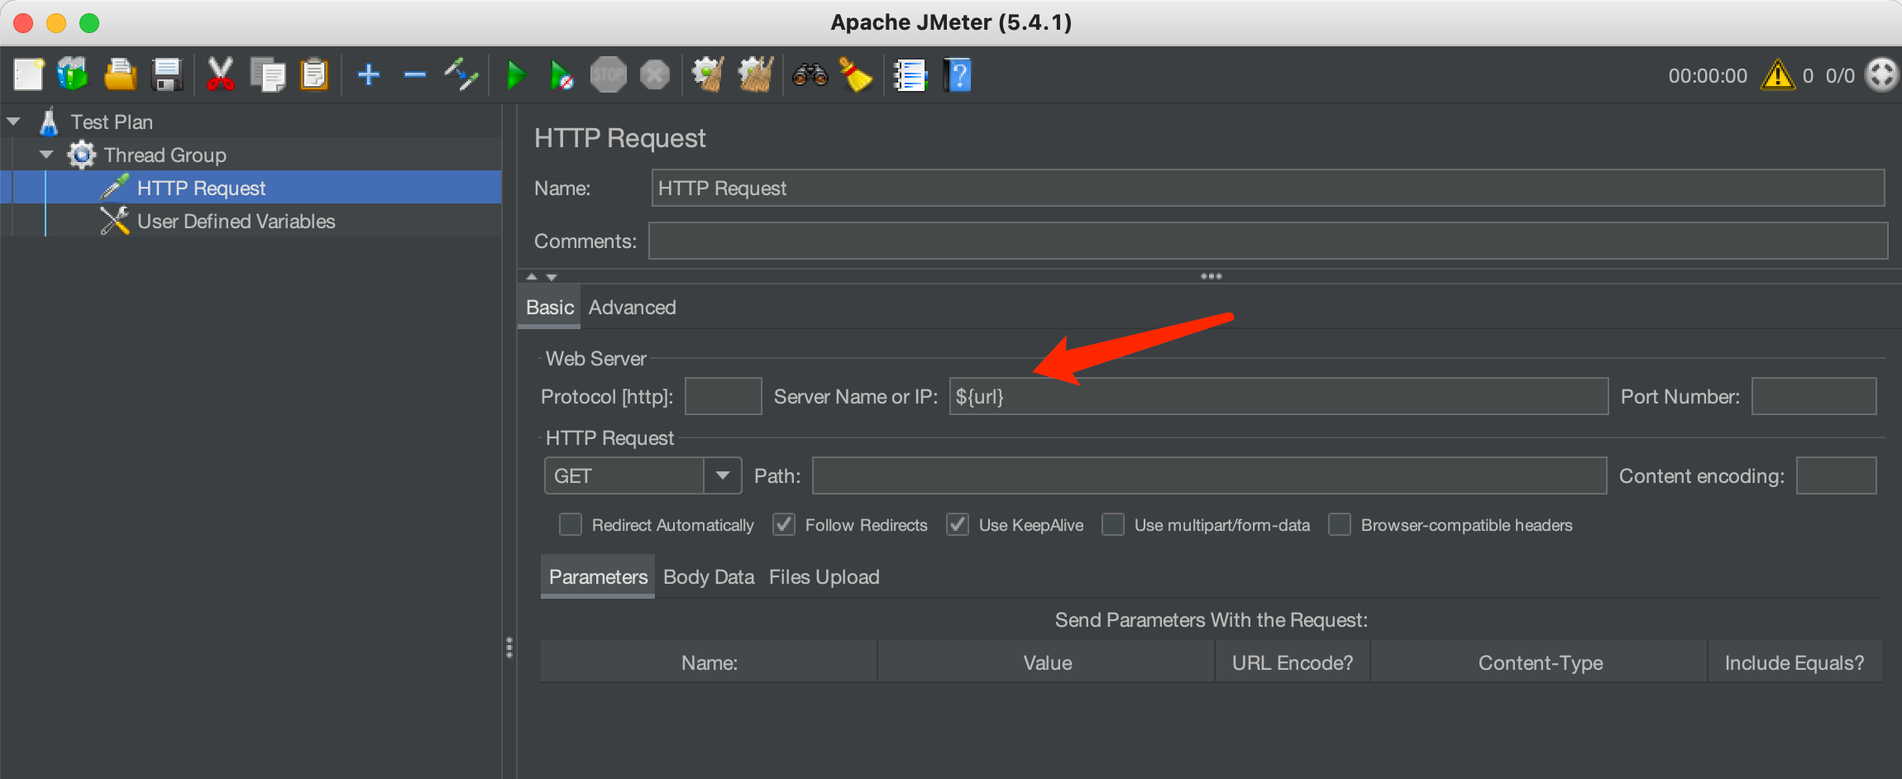
HTTP Request Sampler
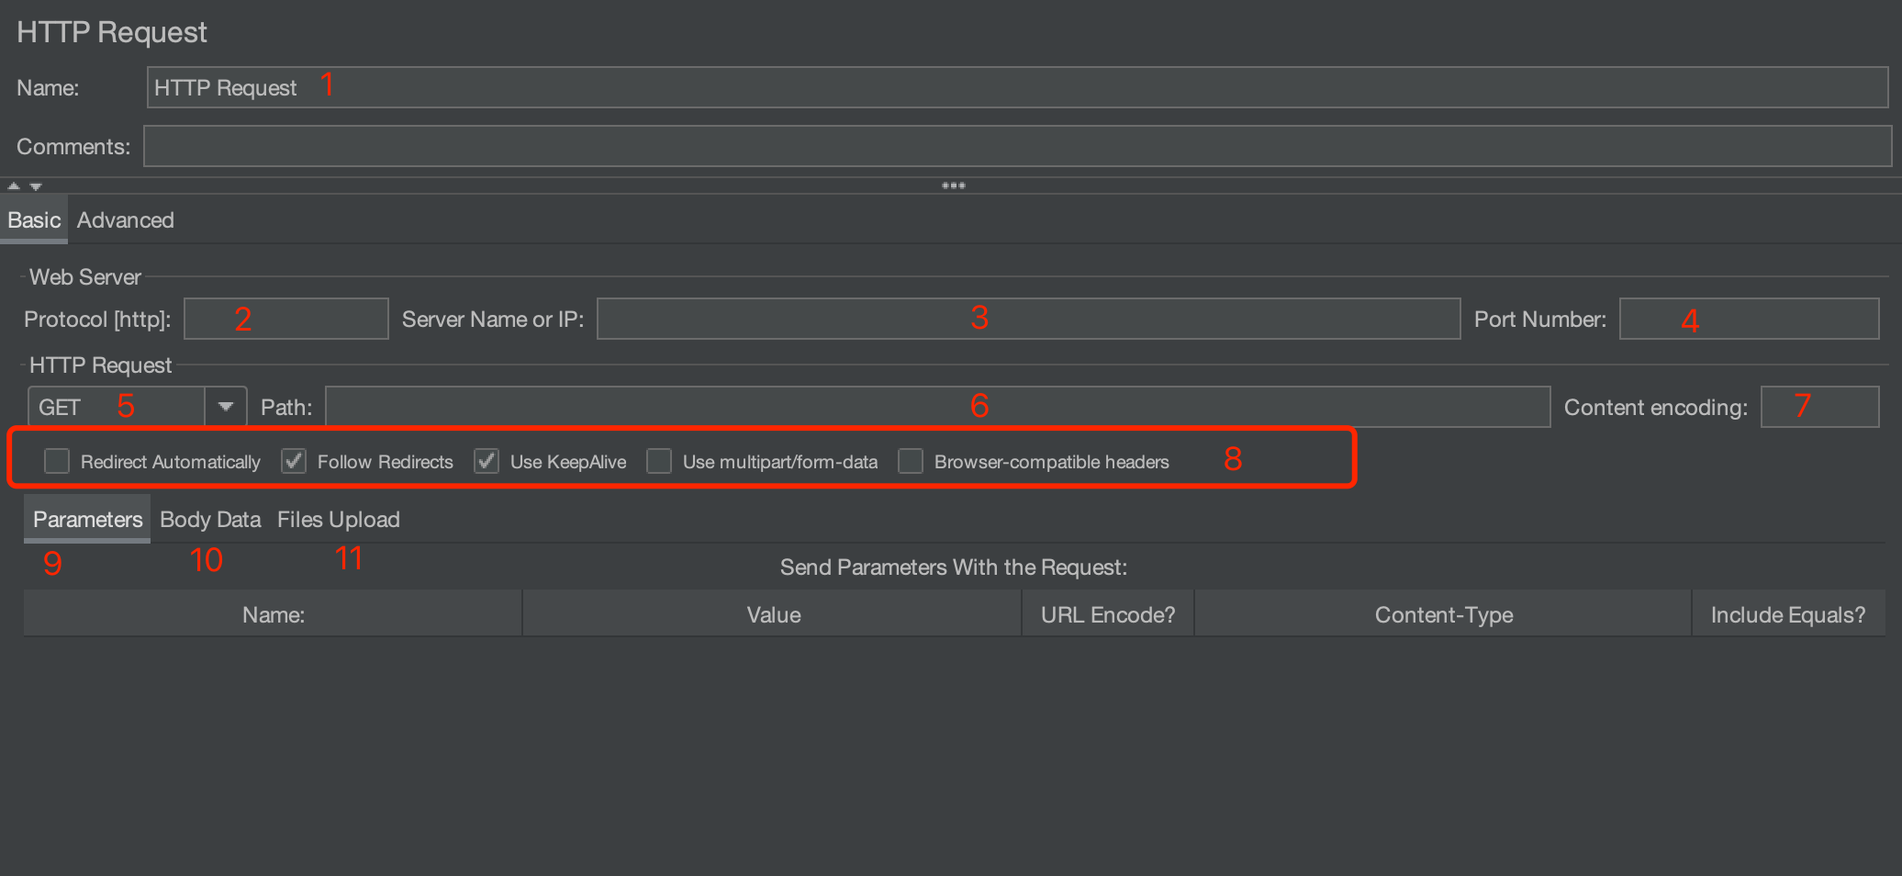
The HTTP Sampler sends HTTP and HTTPS requests to the web server.
Here are the settings available:
- Name and comments
- Protocol: Set the protocol to send the request to the target server, which can be HTTP, HTTPS, or FILE. The default is HTTP.
- Server name or IP address: The hostname or IP address of the target server to which the request is sent.
- Port number: The port number that the web service listens on. The default port is 80 for HTTP and 443 for HTTPS.
- Request method: The method for sending the request, commonly including GET, POST, DELETE, PUT, TRACE, HEAD, OPTIONS, and so on.
- Path: The target URL (excluding server address and port) to request.
- Content encoding: How to encode the request (applicable to POST, PUT, PATCH, and FILE).
- Advanced request options: A few extra options, including:
- Redirect Automatically: Redirection is not treated as a separate request and is not recorded by JMeter.
- Follow Redirects: Each redirection is treated as a separate request and is recorded by JMeter.
- Use KeepAlive: If enabled,
Connection: keep-aliveis added to the request header when JMeter communicates with the target server. - Use multipart/form-data for POST: If enabled, requests are sent using
multipart/form-data or application/x-www-form-urlencoded.
- Parameters: JMeter uses parameter key-value pairs to generate request parameters and send these request parameters in different ways depending on the request method. For example, for GET, DELETE requests, parameters are appended to the request URL.
- Message body data: If you want to pass parameters in JSON format, you must configure the Content-Type as
application/jsonin the request header. - File upload: Send a file in the request. The HTTP file upload behavior can be simulated in this way (usually).
Logic Controllers
The JMeter Logic Controller controls the execution logic of components. The JMeter website explains it like this: "Logic Controllers determine the order in which Samplers are processed."
The Logic Controller can control the execution order of the samplers. Therefore, the controller needs to be used together with the sampler. Except for the once-only controller, other logic controllers can be nested within each other.
Logic controllers in JMeter are mainly divided into two categories. They can control the logical execution order of nodes during the execution of the test plan (a loop or conditional controller), or they can act in response to specific throughput or transaction count.
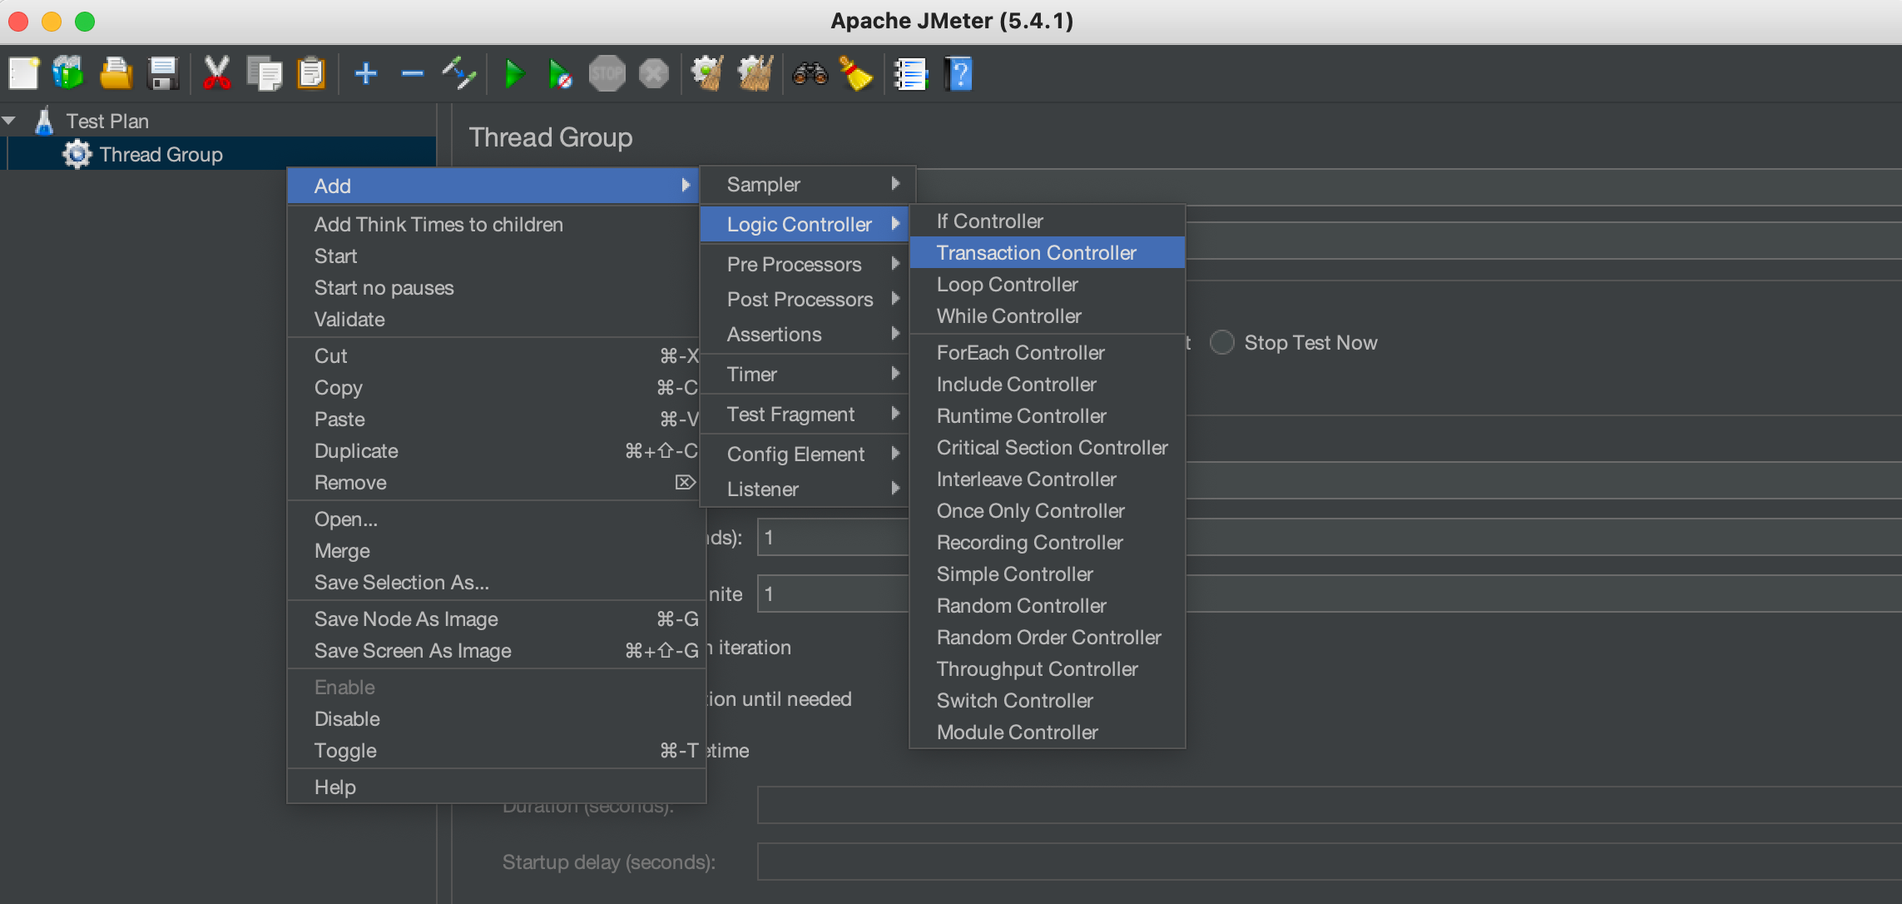
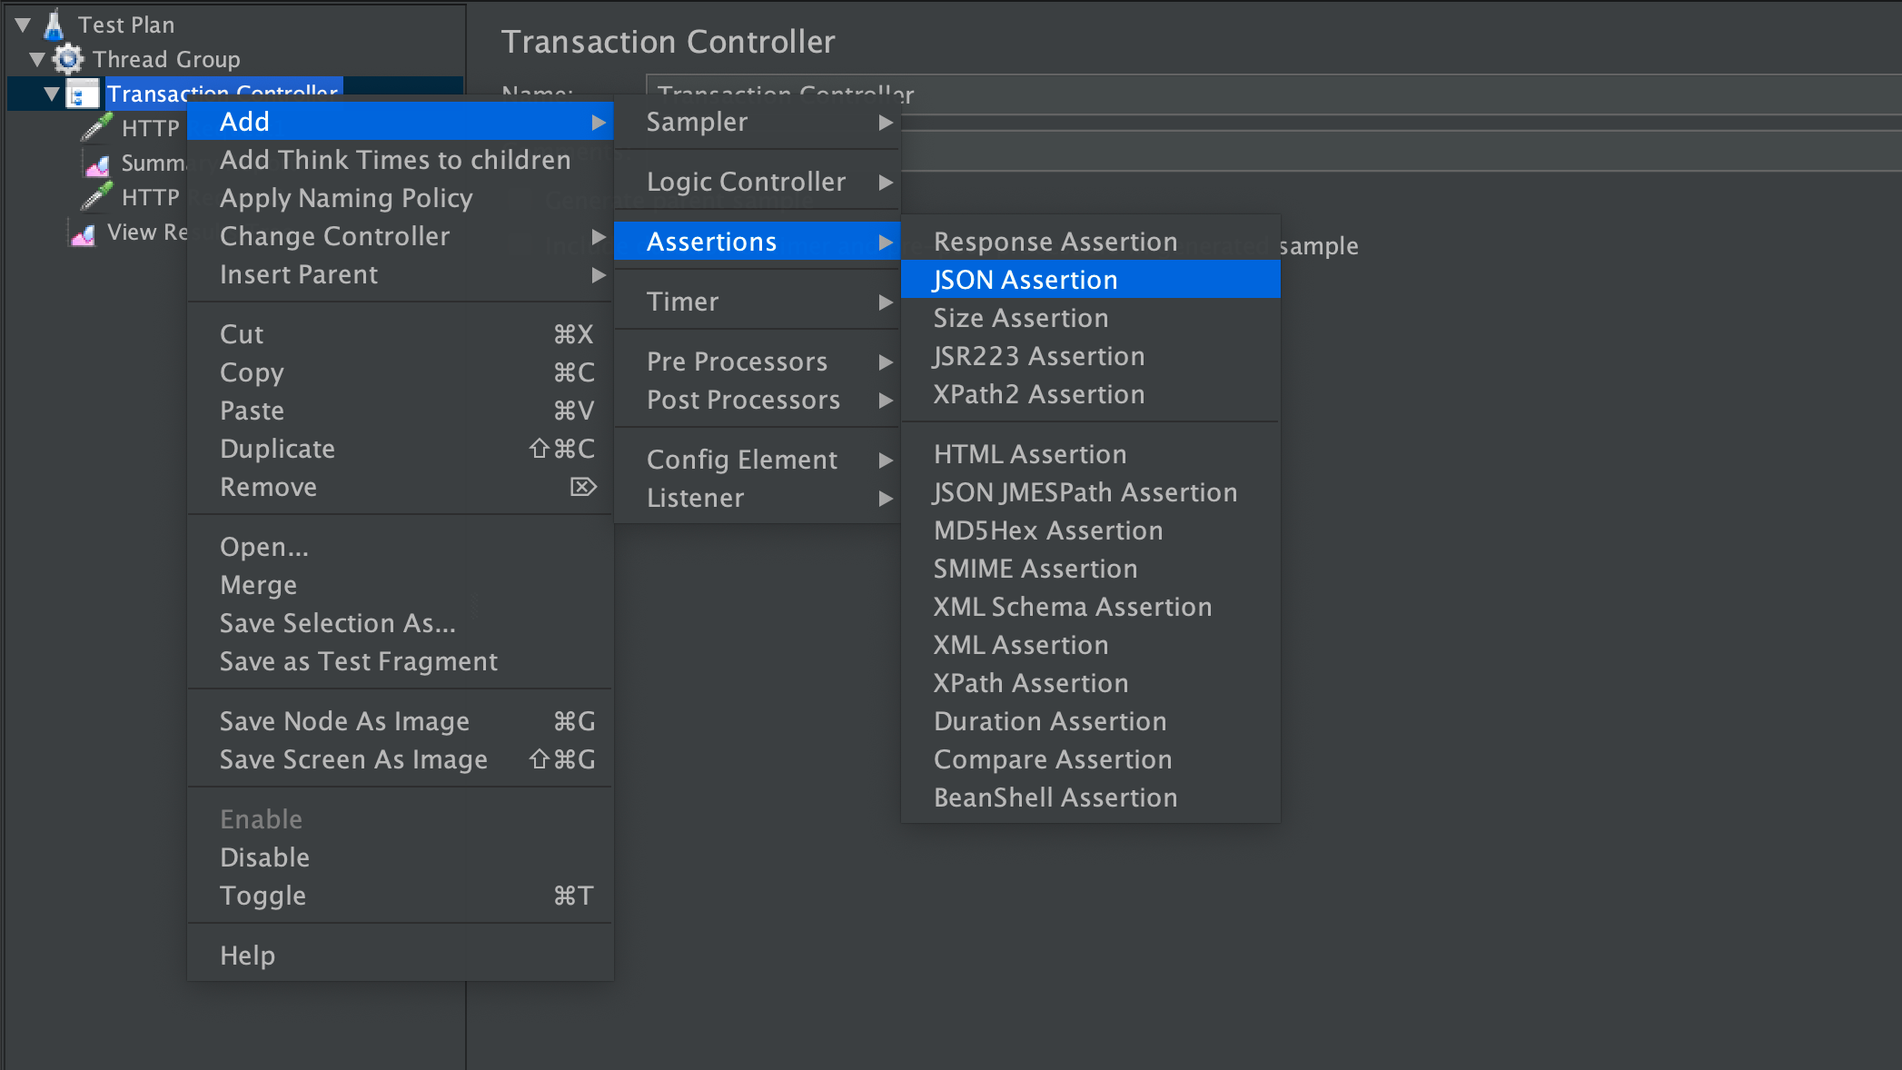
Transaction Controller
Sometimes, you want to count the overall response time of a group of related requests. In this case, you need to use a Transaction Controller.
The Transaction Controller counts the sampler execution time of all child nodes under the controller. If multiple samplers are defined under the Transaction Controller, then the transaction is considered successful only when all samplers run successfully.
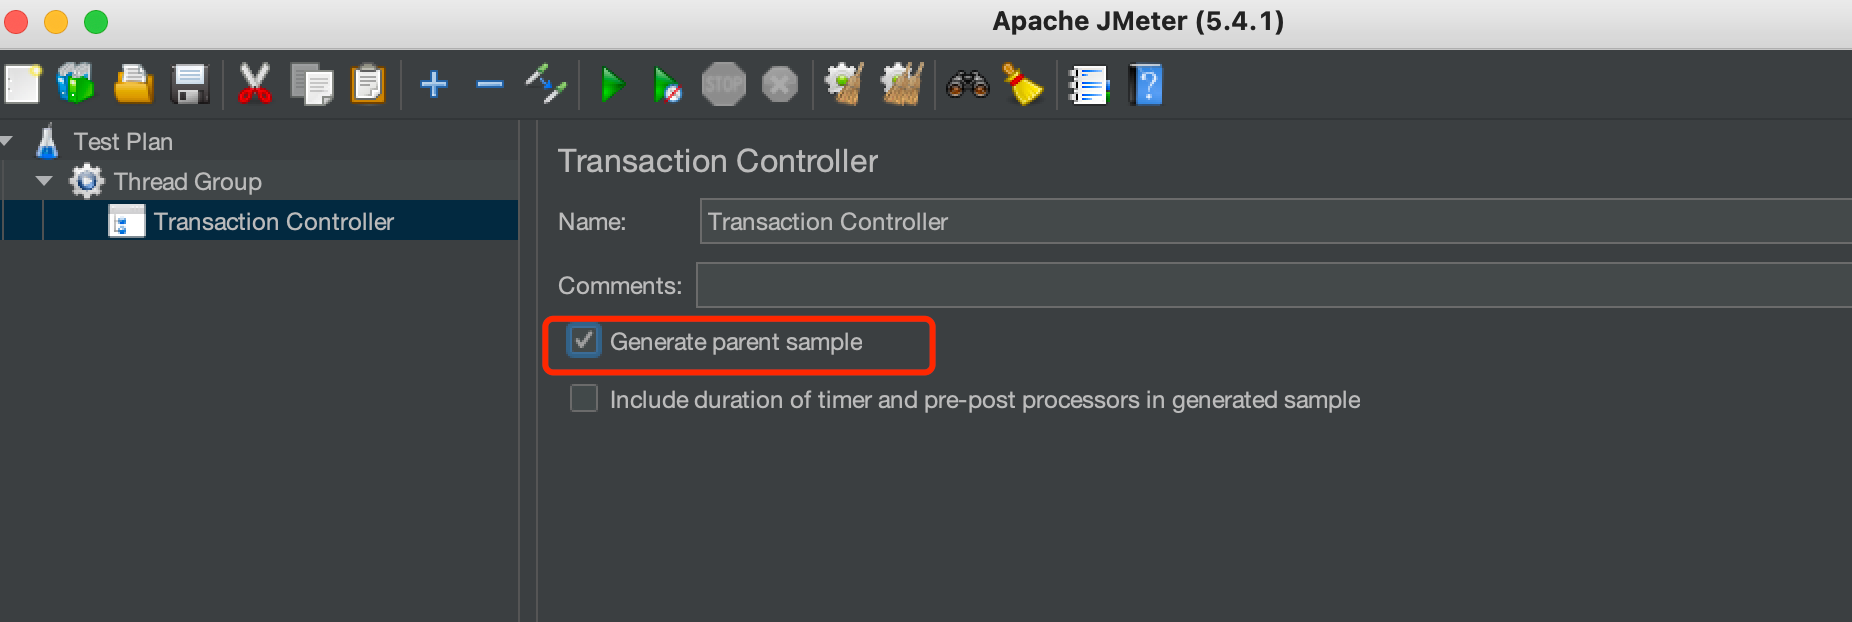
Add a transaction controller using the contextual menu:
Generate parent sample: If enabled, the Transaction Controller is used as a parent sample for other samplers. Otherwise, the Transaction Controller is only used as an independent sample.
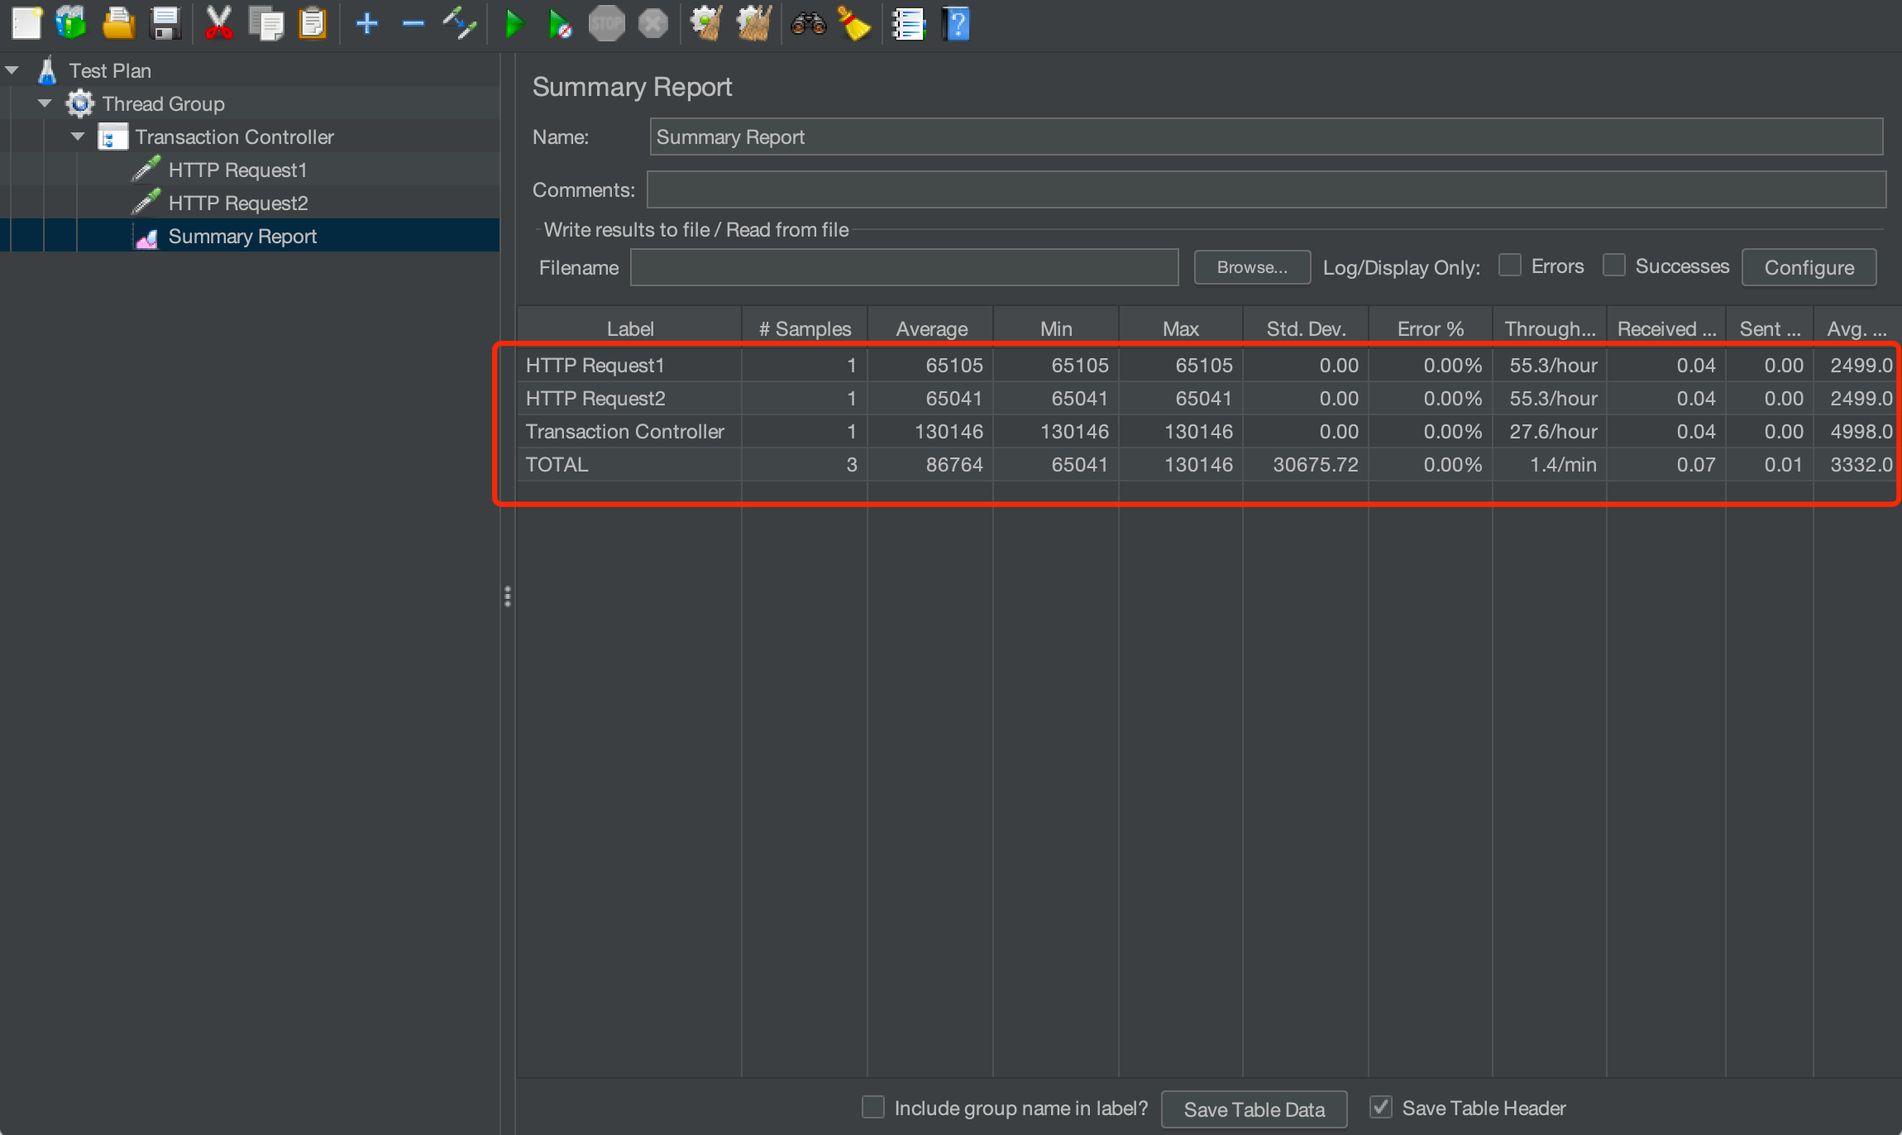
For example, the unchecked Summary Report is as follows:
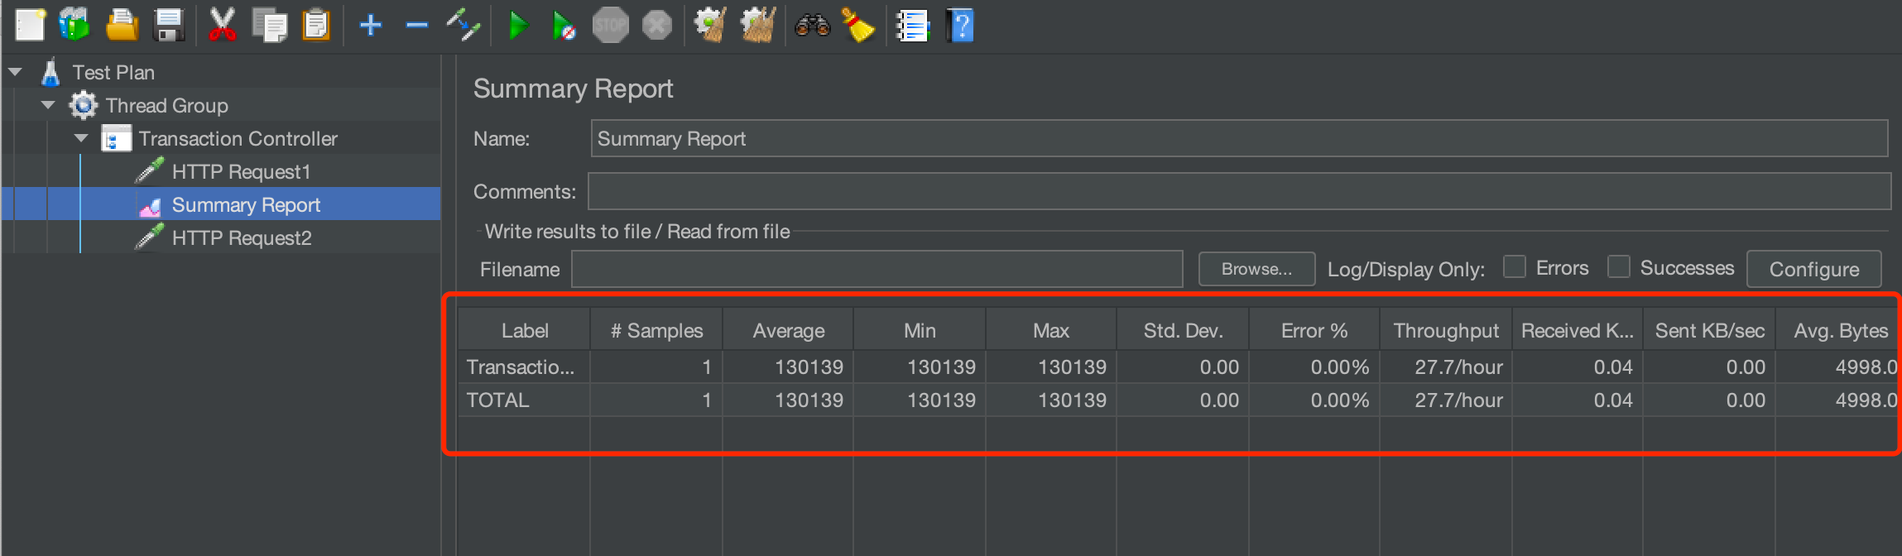
If checked, the Summary Report is as follows:
Include duration of timer: If enabled, include a timer (a delay is added before and after the sampler runs).
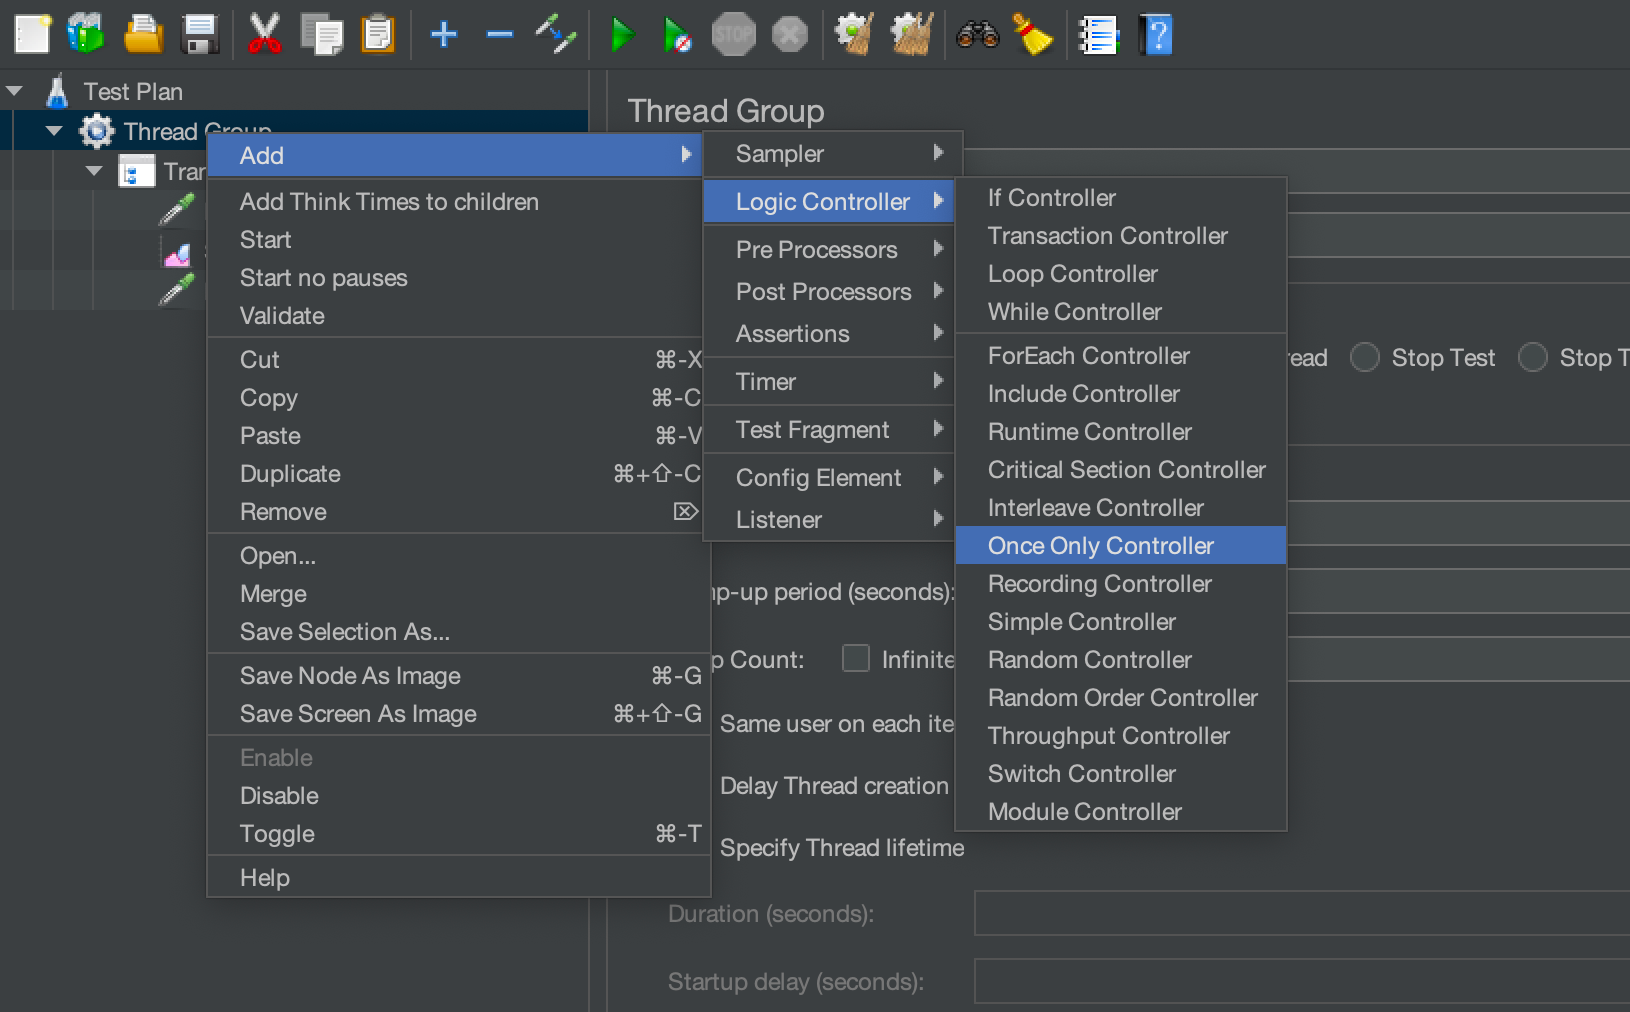
Once Only Controller
The Once Only Controller, as its name implies, is a controller that executes only once. The request under the controller is executed only once during the loop execution process under the thread group. For tests that require a login, you can consider putting the login request in a Once Only Controller because the login request only needs to be executed once to establish a session.
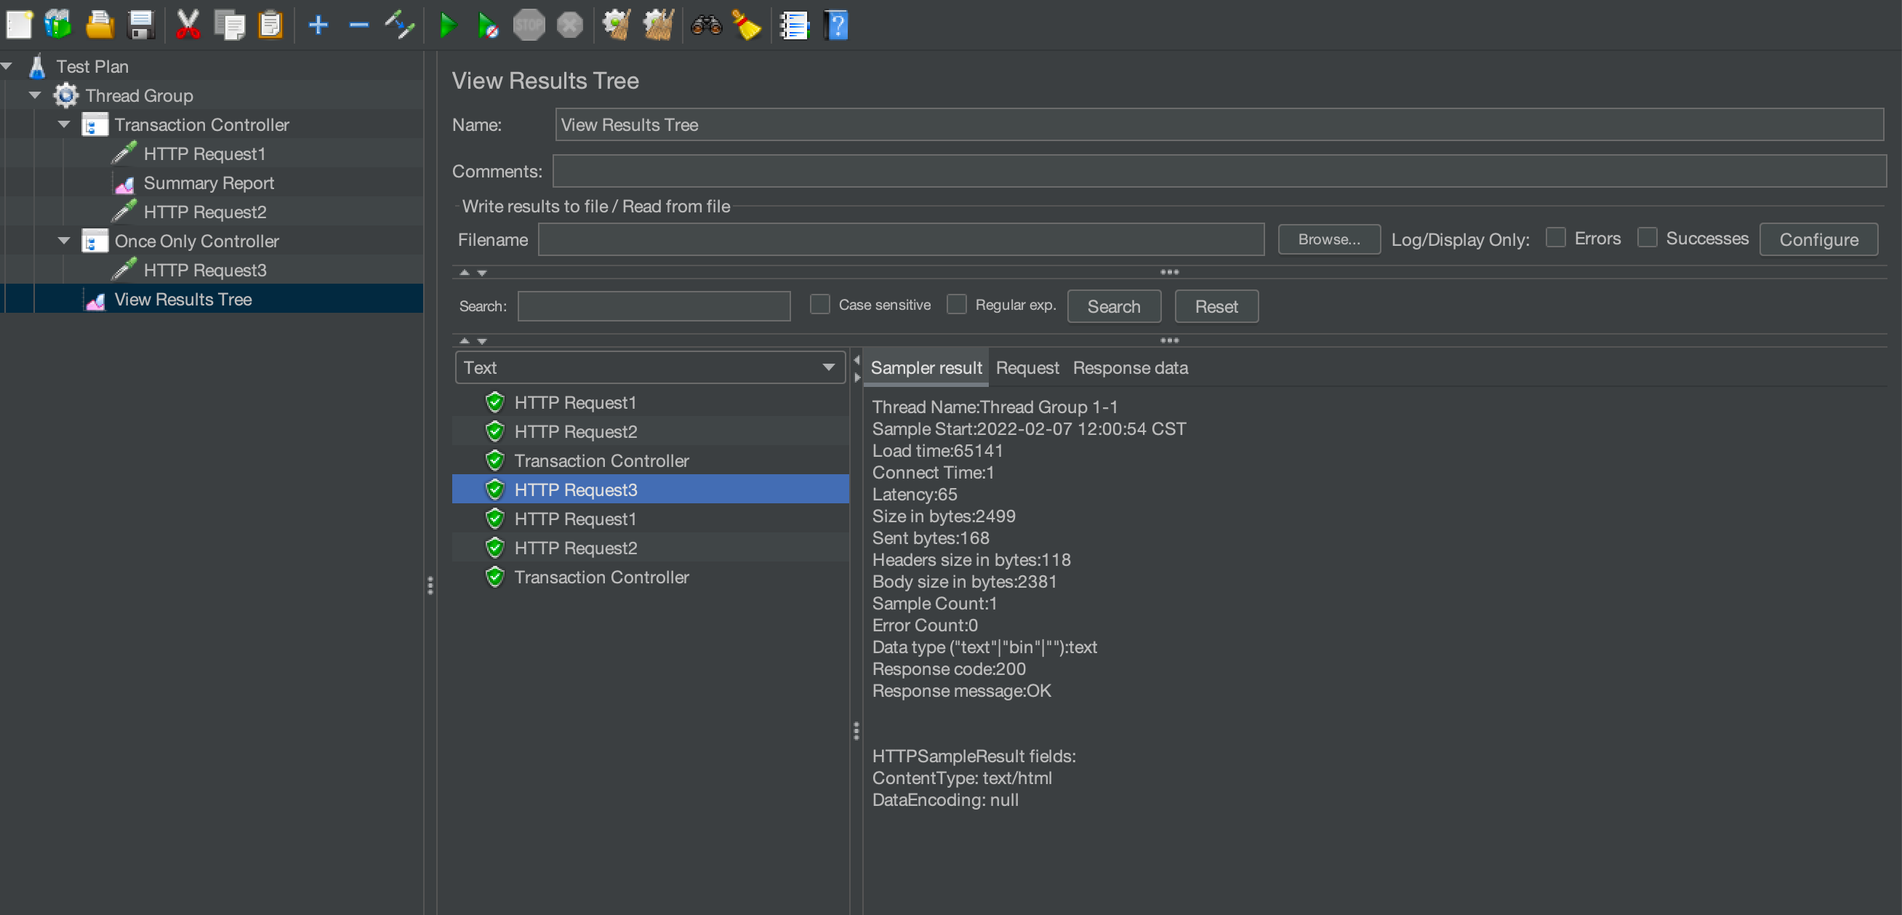
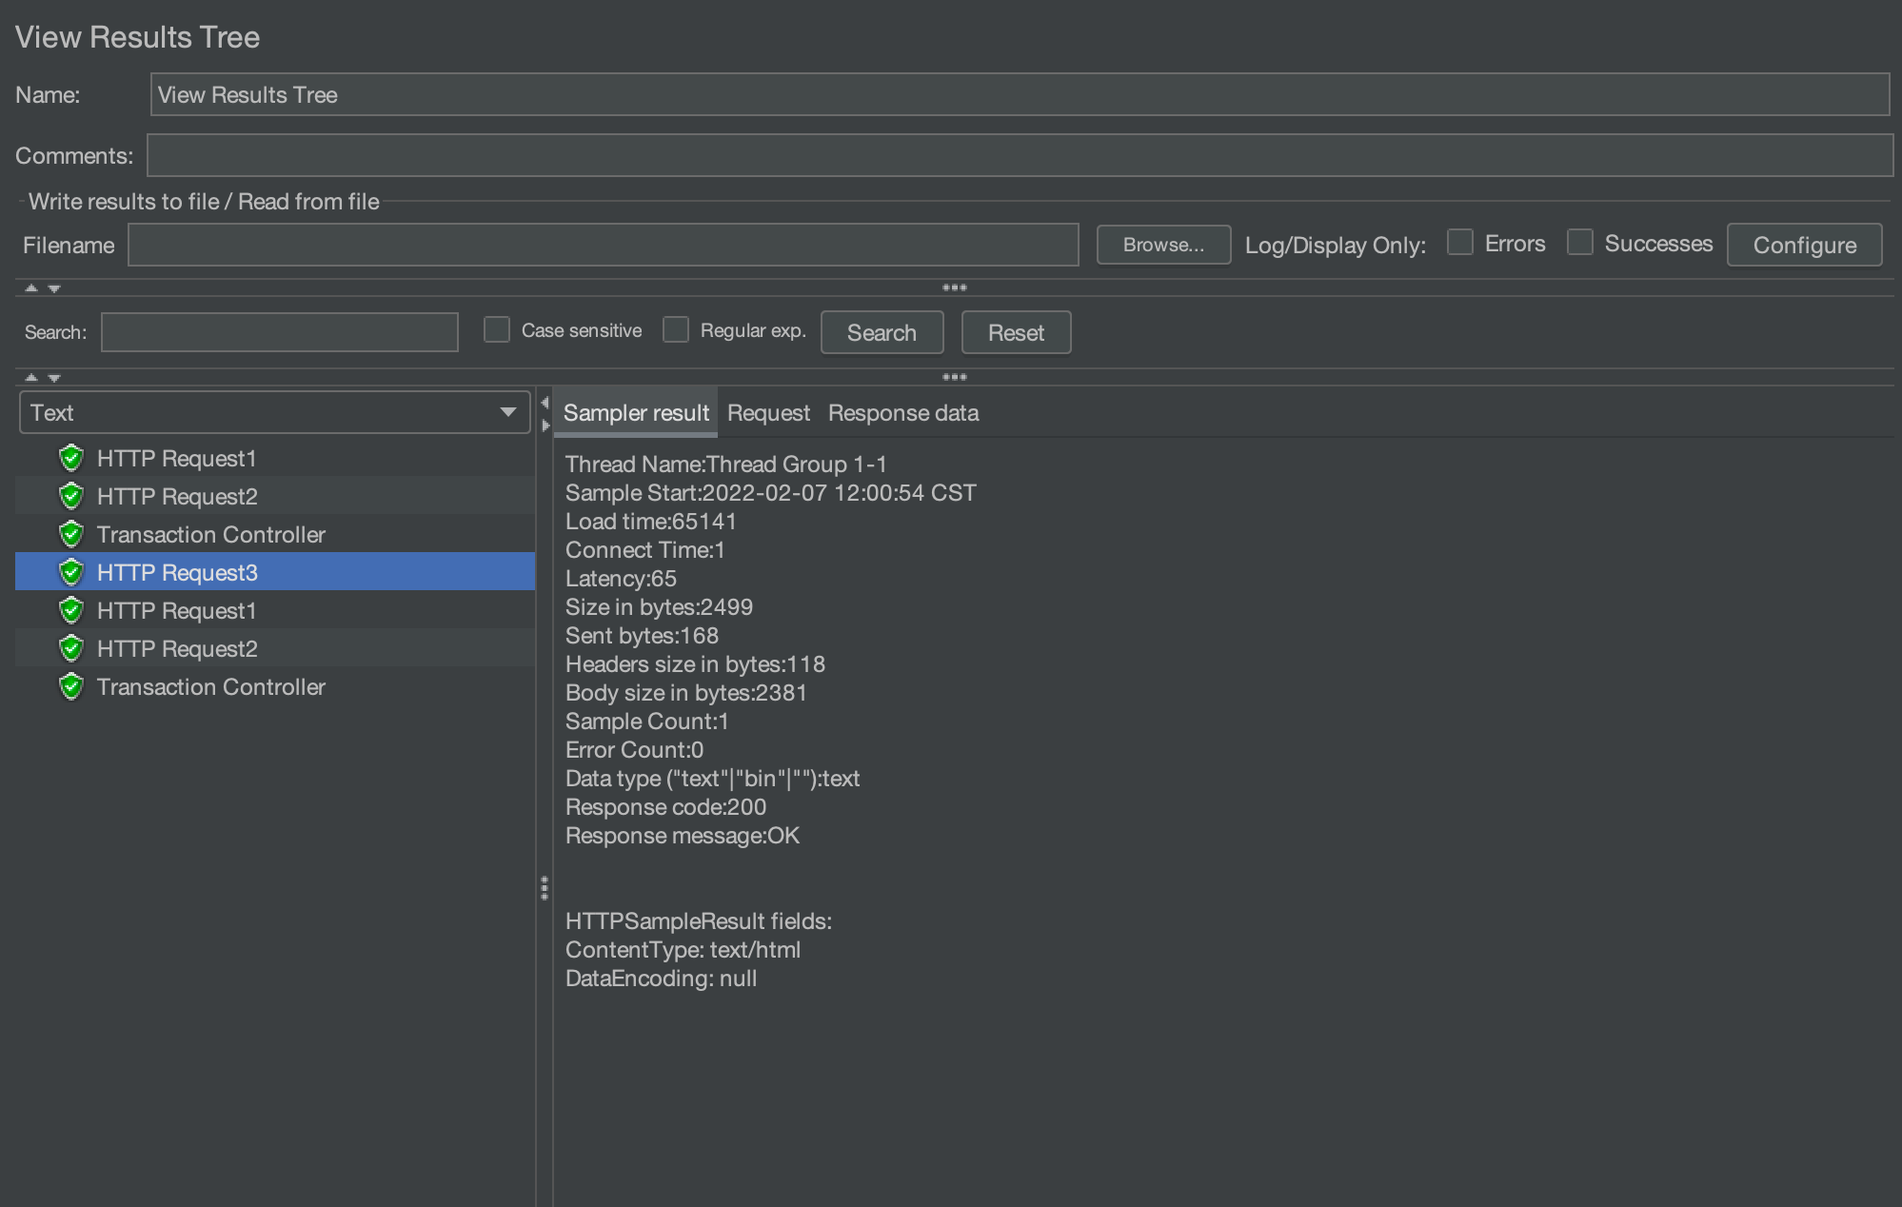
If you set the loop count to 2 and check the result tree after running, you can see that the HTTP request 3under the Once Only Controller is only executed once, and other requests are executed twice.
Listeners
A listener is a series of components that process and visualize test result data. View Results Tree, Graph Results, and Aggregate Report are common listener components.
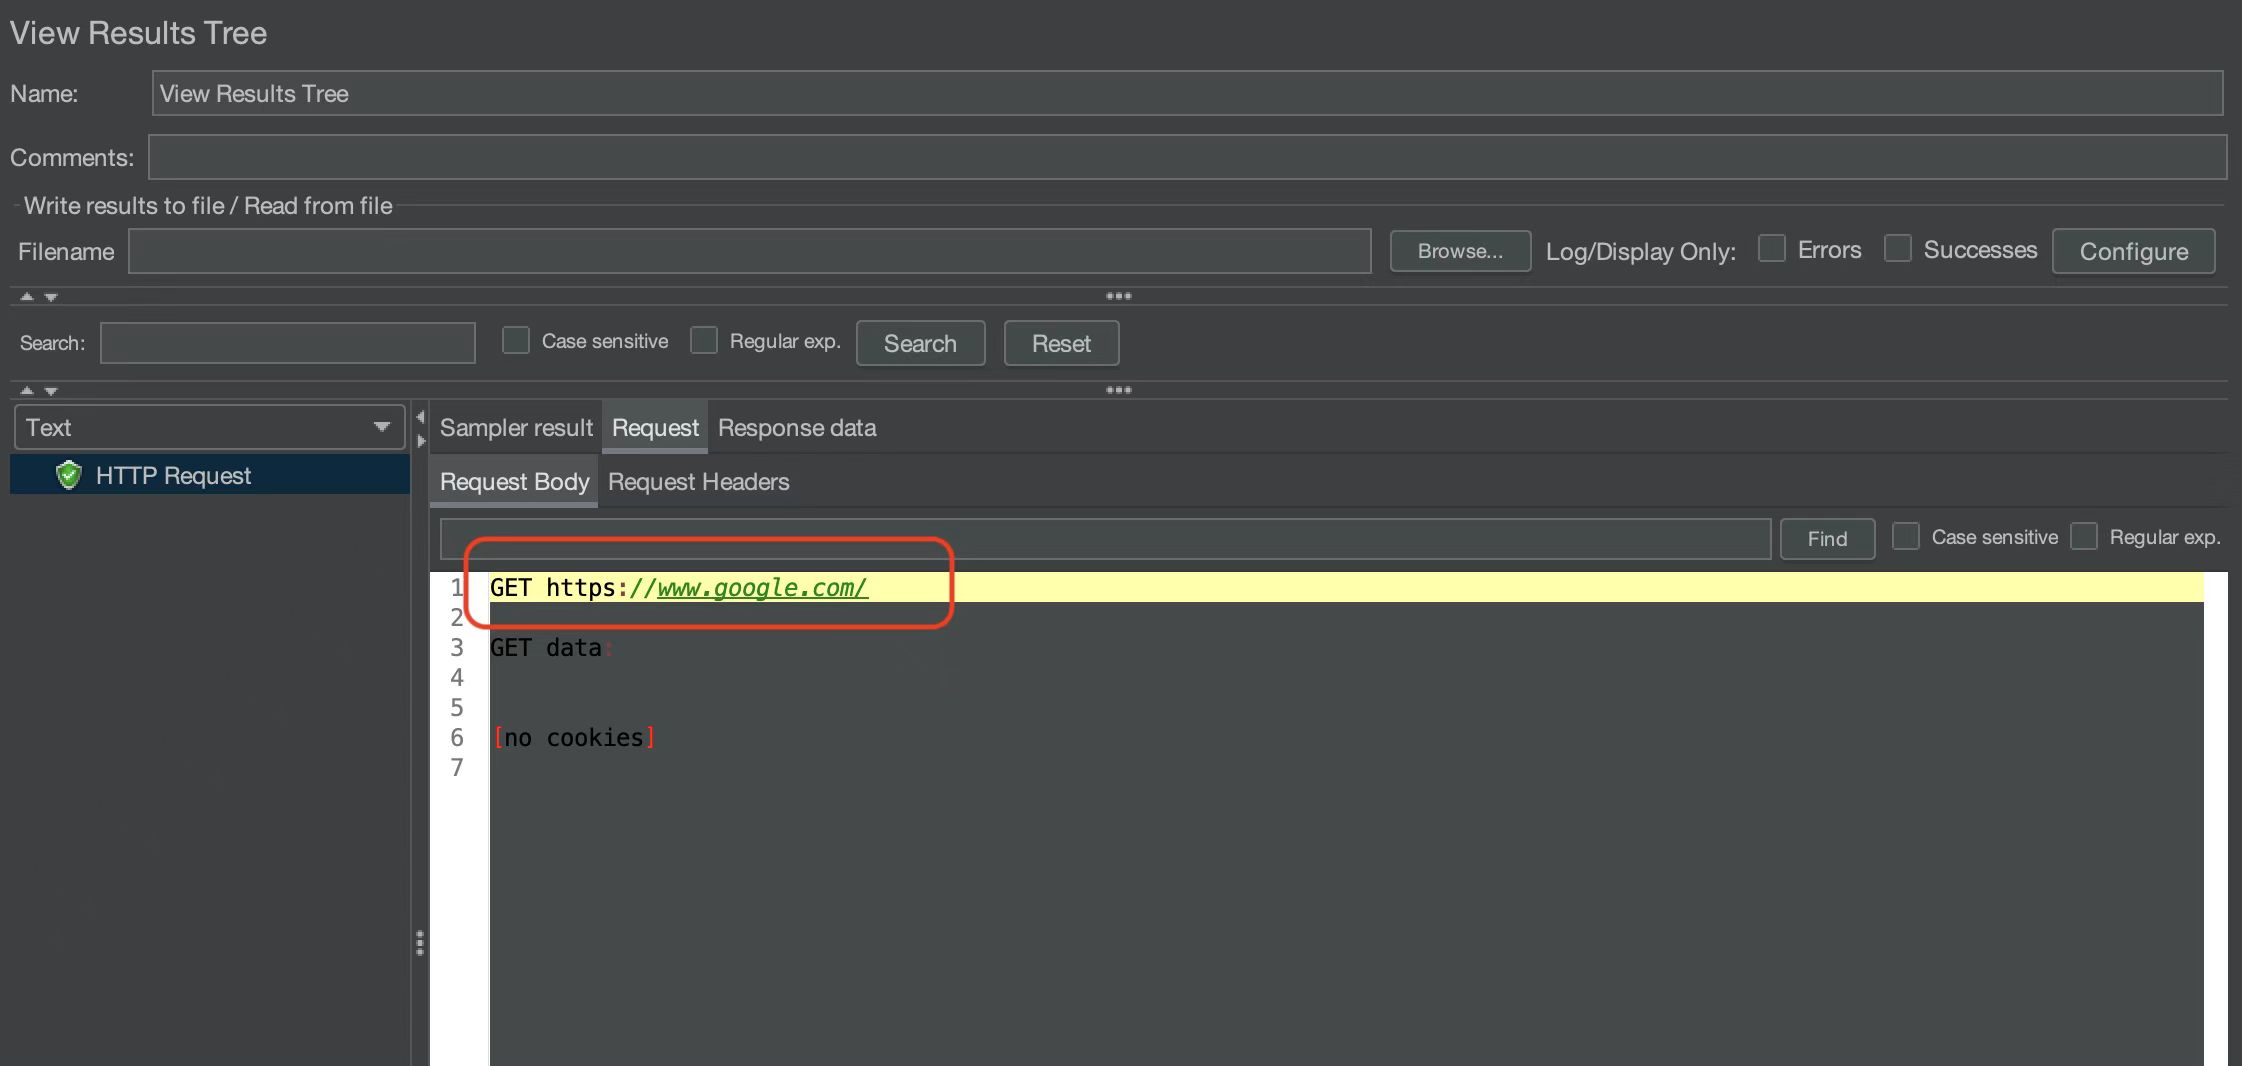
View Results Tree
This component displays the result, request content, response time, response code, and response content of each sampler in a tree structure. Viewing the information can assist in analyzing whether there is a problem. It provides various viewing formats and filtering methods and can also write the results to specified files for batch analysis and processing.
Configuration Element
Configuration element provides support for static data configuration. It can be defined at the test plan level, or at the thread group or sampler level, with different scopes for different levels. Configuration elements mainly include User Defined Variables, CSV Data Set Config, TCP Sampler Config, HTTP Cookie Manager, etc.
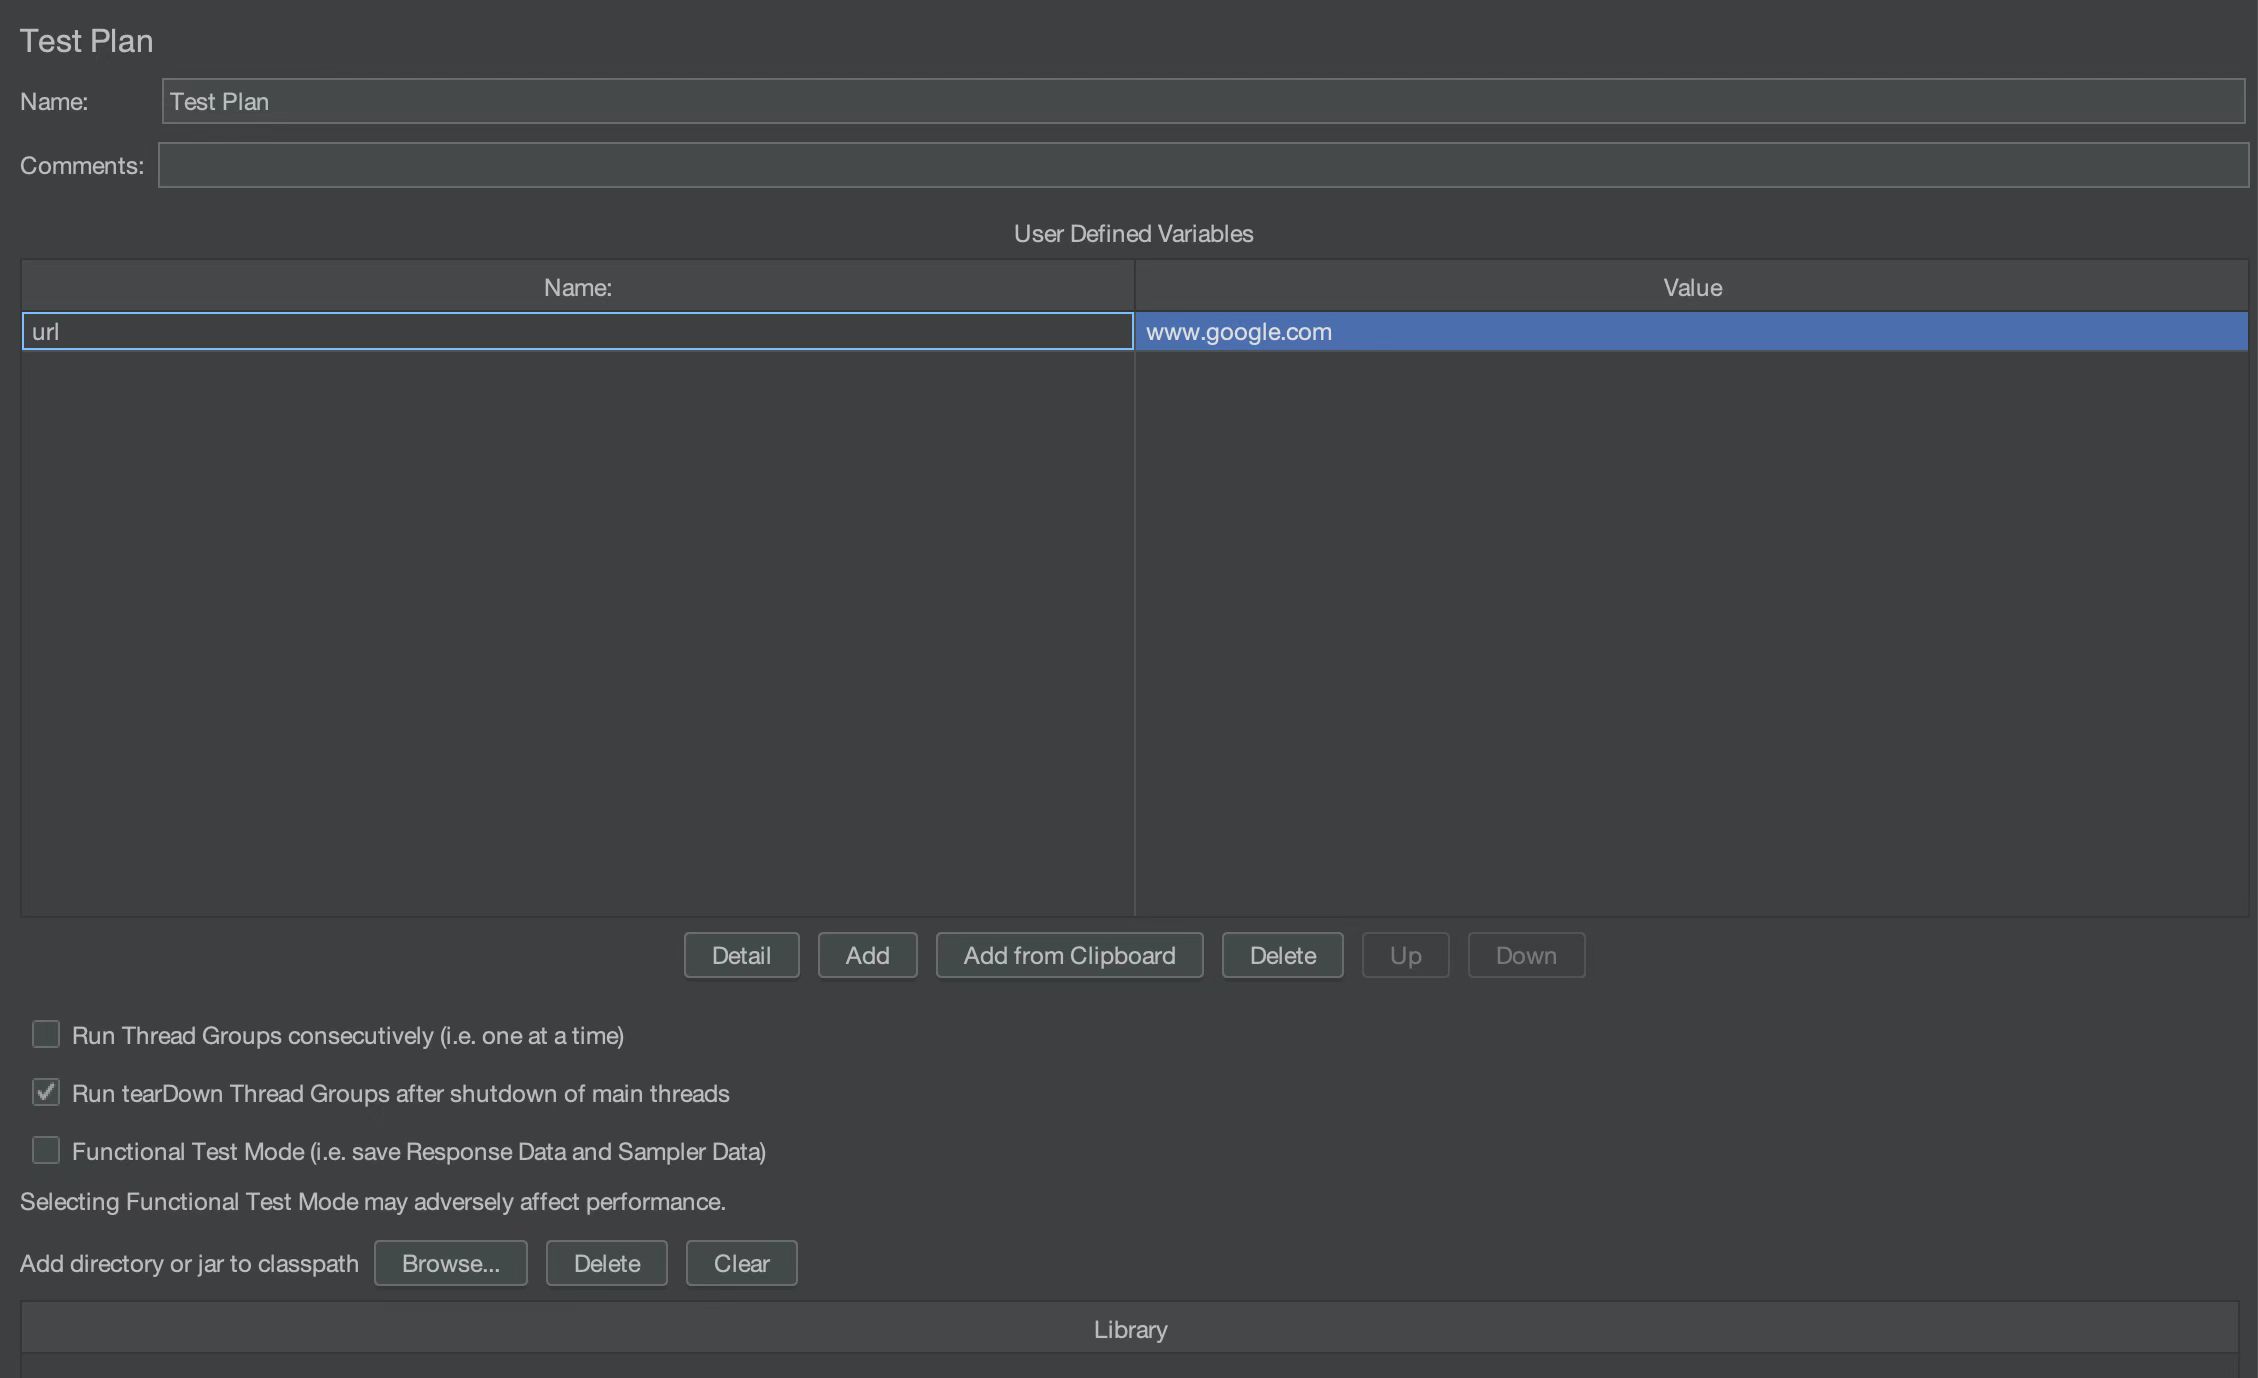
User-Defined Variables
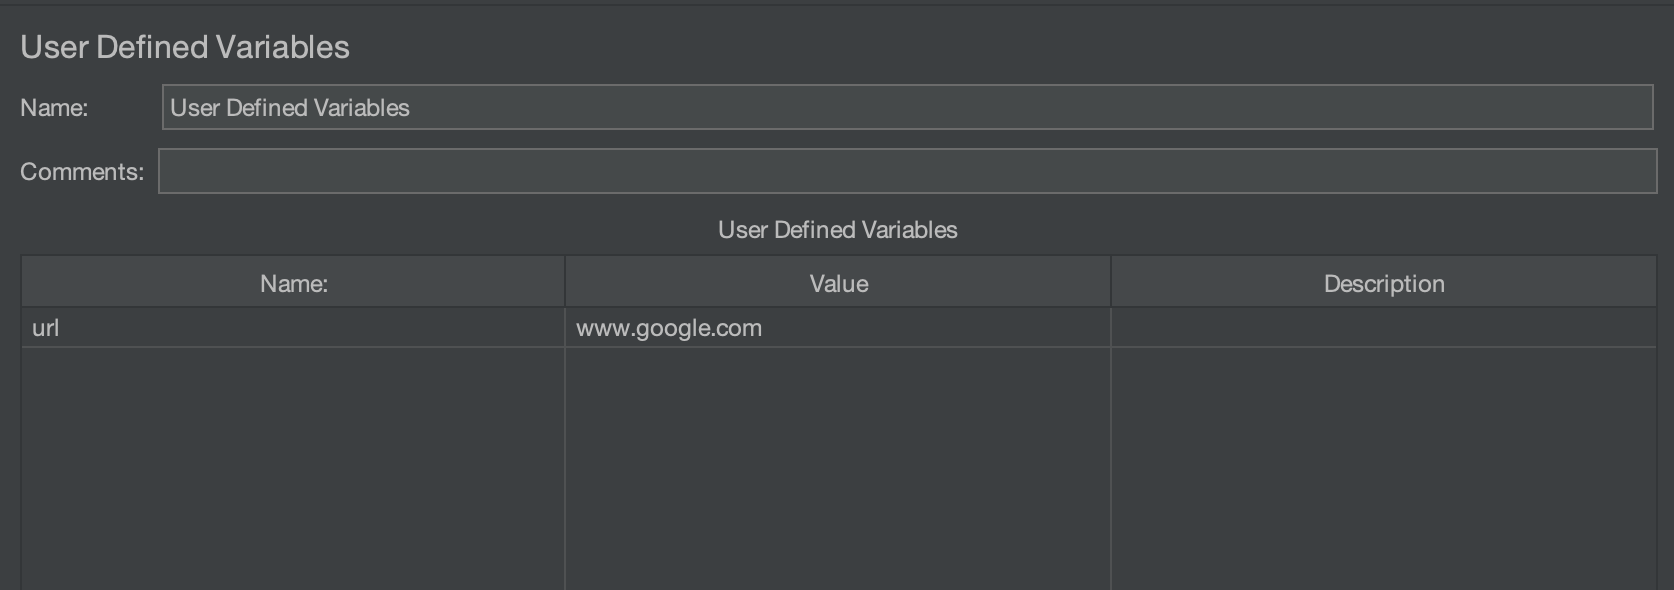
By setting a series of variables, you cause a random selection of values to be used in the performance test. Variable names can be referenced within the scope, and variables can be referenced as ${variable name}.
In addition to the User Defined Variables component, variables can also be defined in other components, such as Test Plans and HTTP Requests:
Viewing the execution results, you can see that the value of the variable has been obtained:
CSV Data Set Config
During a performance test, you may need parameterized input, such as the username and password, in the login operation. When the amount of concurrency is relatively large, the data generation at runtime causes a heavy burden on the CPU and memory. The CSV Data Set Config can be used as the source of parameters required in this scenario.
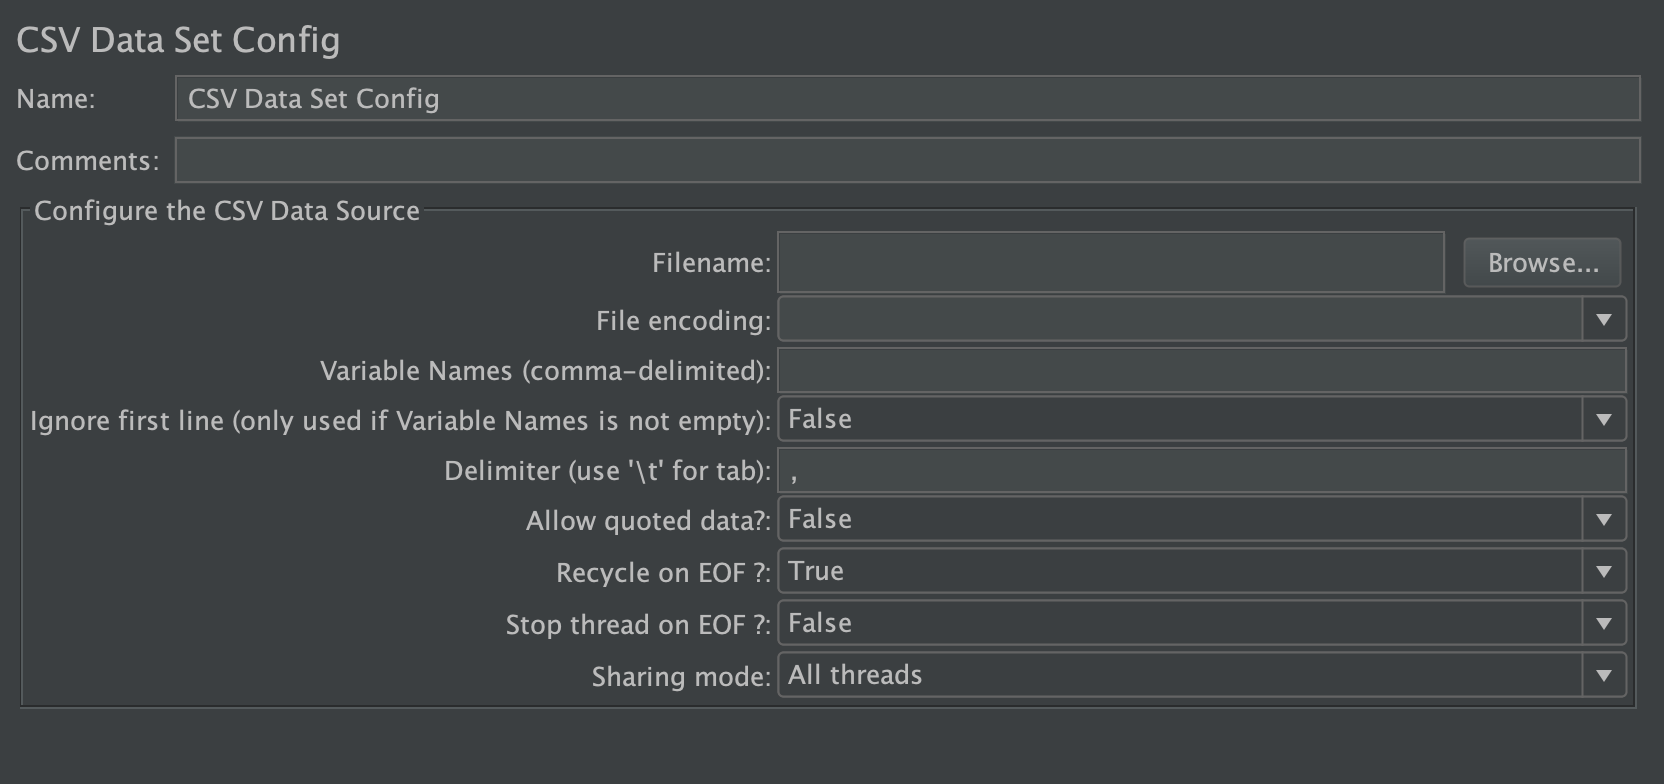
The descriptions of some parameters in the CSV Data Set Config:
- Variable name: Defines the parameter name in the CSV file, which the script can reference as
${variable name}. - Recycle on EOF: If set to True, this allows looping again from the beginning when reaching the end of the CSV file.
- Stop thread on EOF: If set to True, this stops running after reading the last record in the CSV file.
- Sharing mode: Sets the mode shared between threads and thread groups.
Assertions
The Assertion checks whether the request is returned as expected. Assertions are an important part of automated test scripts, so you should pay great attention to them.
JMeter commonly used assertions include Response Assertion, JSON Assertion, Size Assertion, Duration Assertion, Beanshell Assertion, and so on. Below I introduce the frequently-used JSON Assertion.
JSON Assertion
This is used to assert the content of the response in JSON format. A JSON Assertion is added on an HTTP Sampler in this example, as shown in the following image:
The root of the JSON path is always called $, which can be represented by two different styles: dot-notation (.) or bracket-notation ([]). For example; $.message[0].name or $['message'][0]['name'].
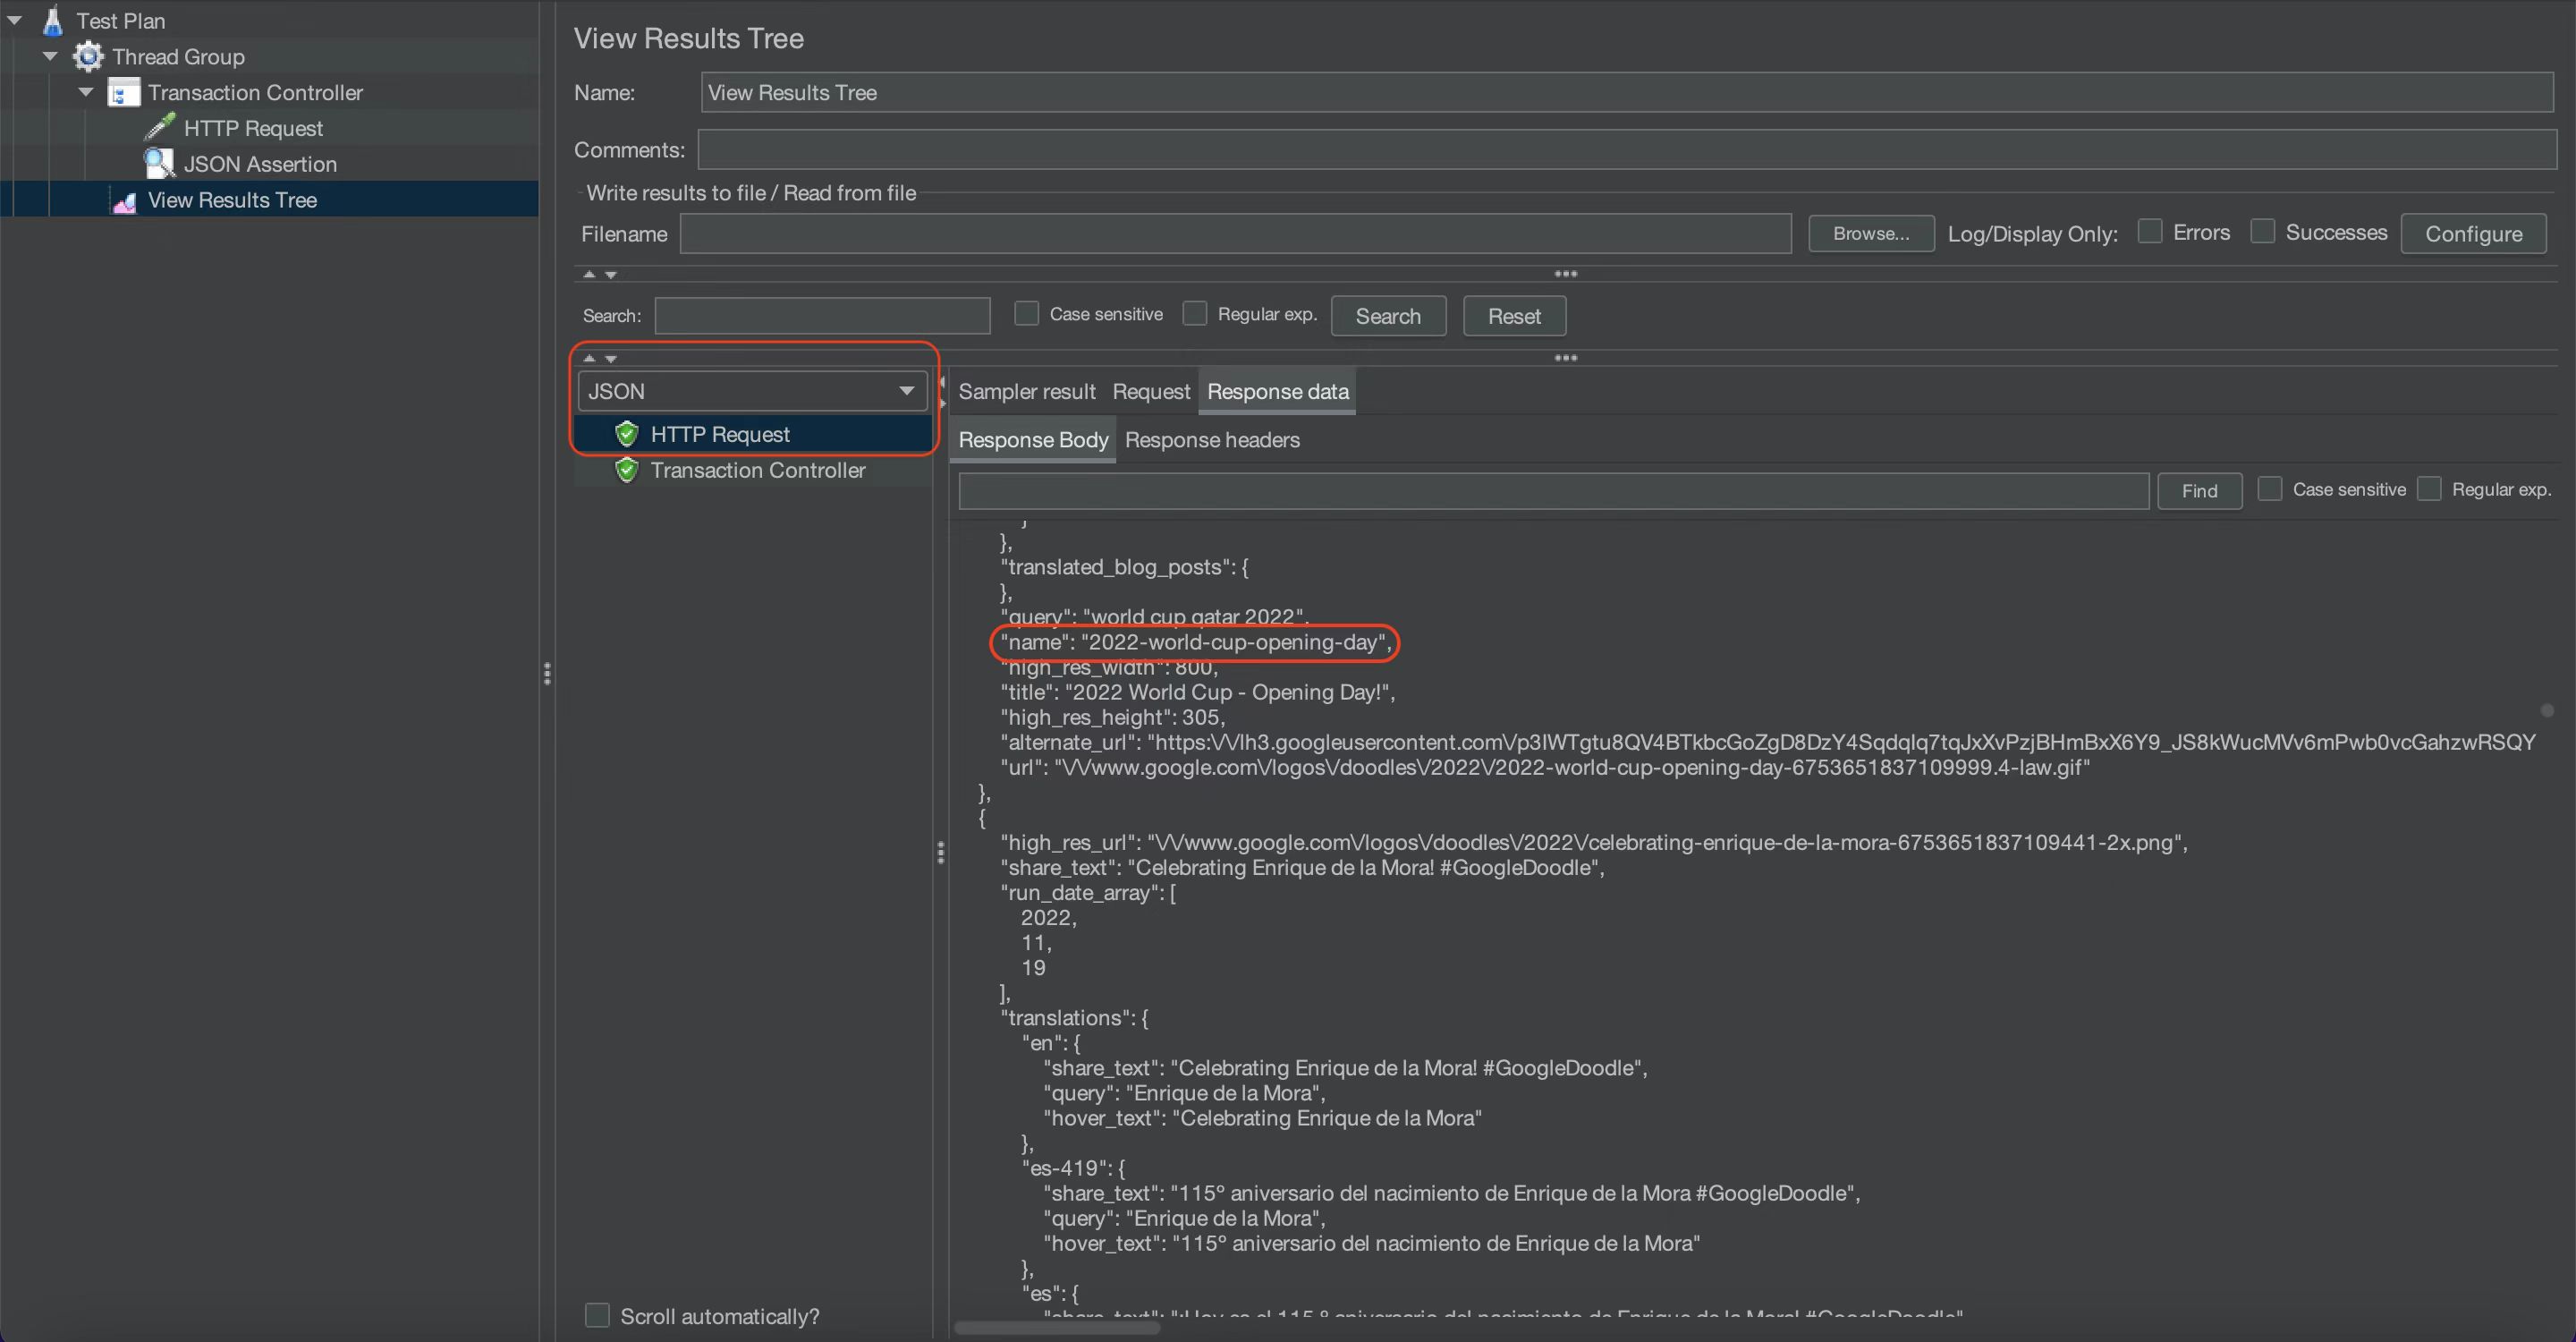
Here's an example of a request made to https://www.google.com/. The $[0].namevalue represents the 'name' part in the first array element in the response.
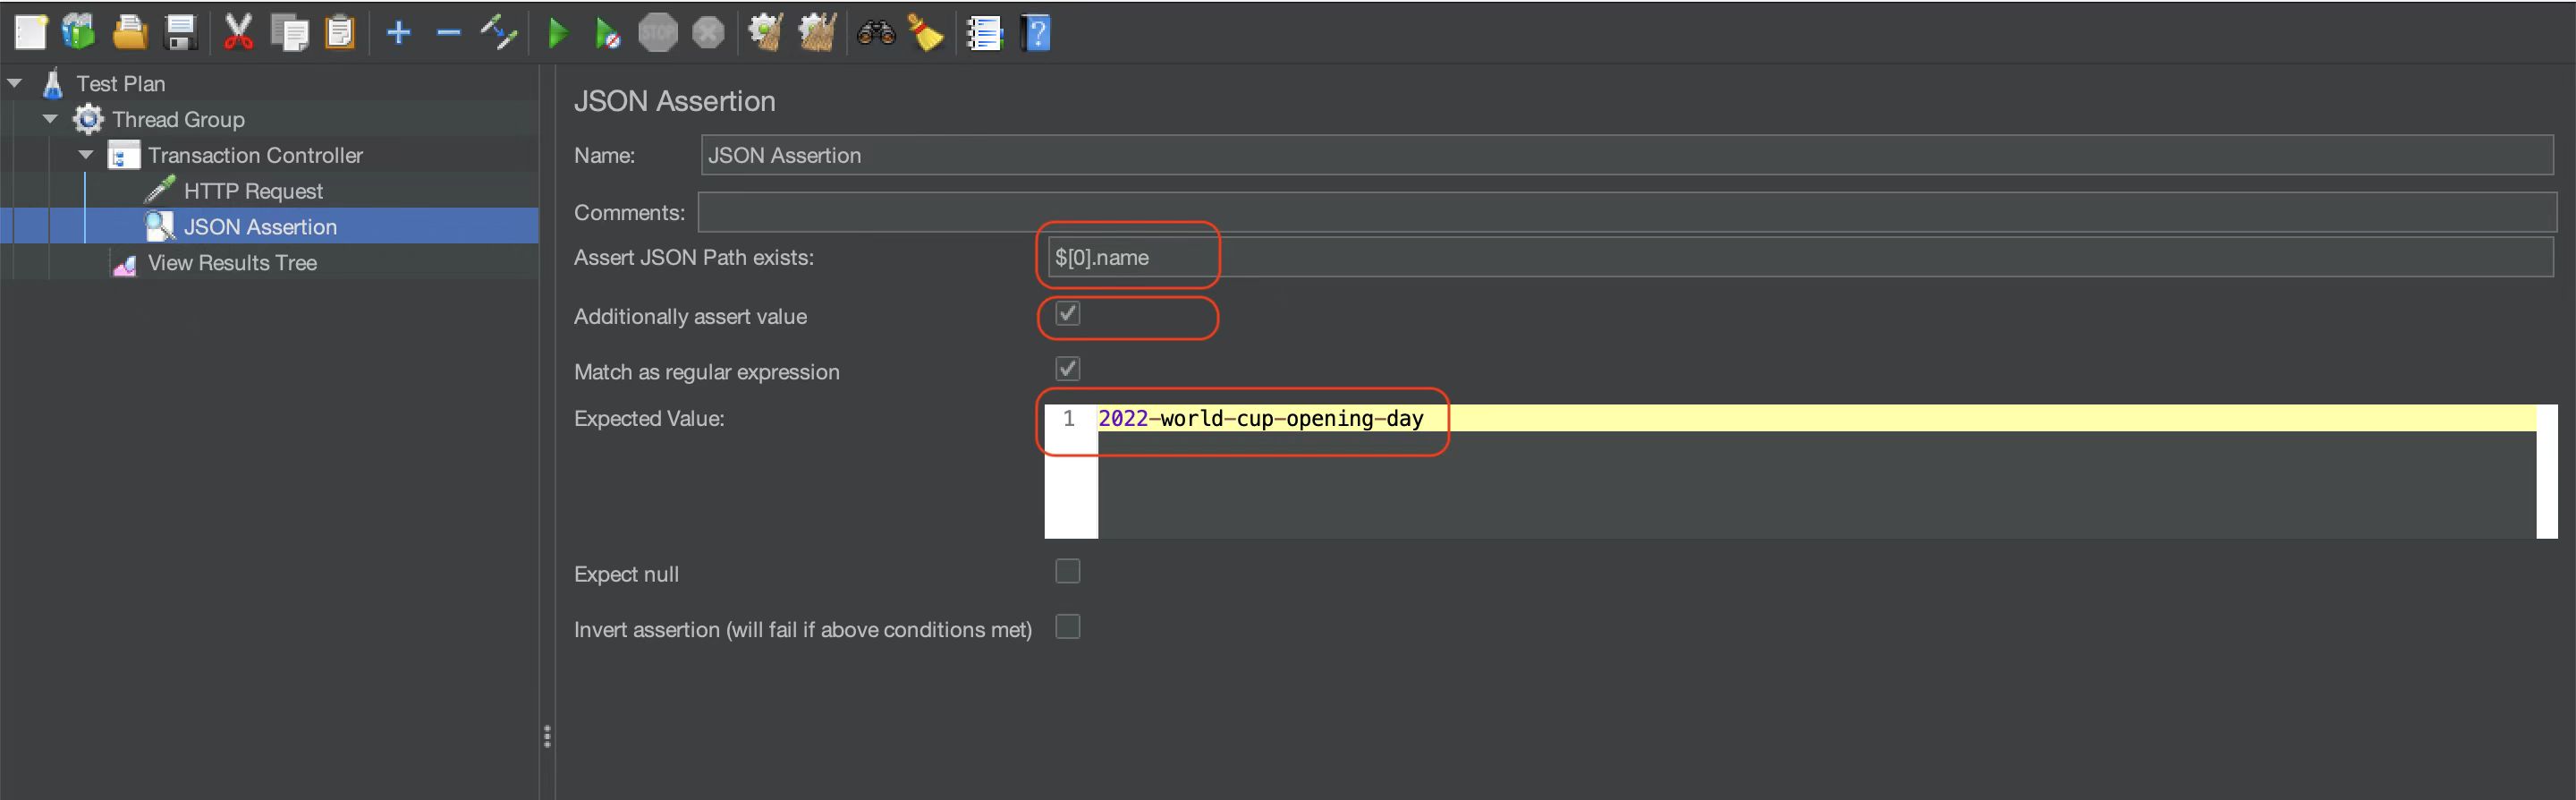
The Additionally assert value specifies that the value of 'name' is to be verified, and the Expected value is expected to be '2022-world-cup-opening-day'.
Run the script and look at the results. You can see that the assertion has passed.
Here are the possible conditions and how they're treated:
- If a response result is not in JSON format, it's treated as a failure.
- If the JSON path cannot find the element, it fails.
- If the JSON path finds the element, but no conditions are set, it passes.
- If the JSON path finds an element that does not meet the conditions, it fails.
- If the JSON path finds the element that meets the conditions, it passes.
- If the JSON path returns an array, it iterates to determine whether any elements meet the conditions. If yes, it passes. If not, it fails.
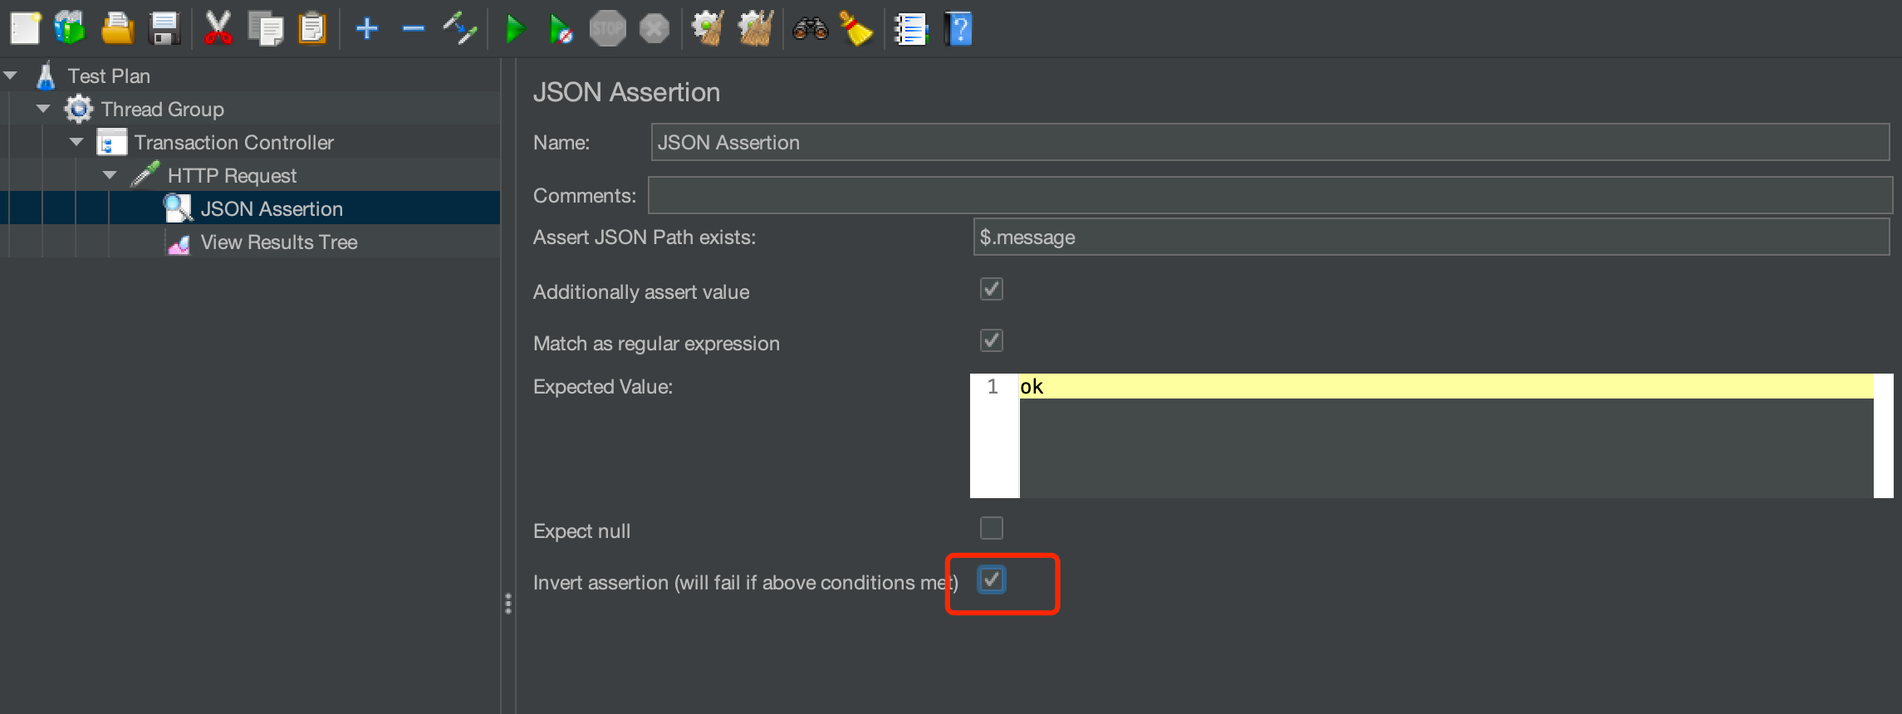
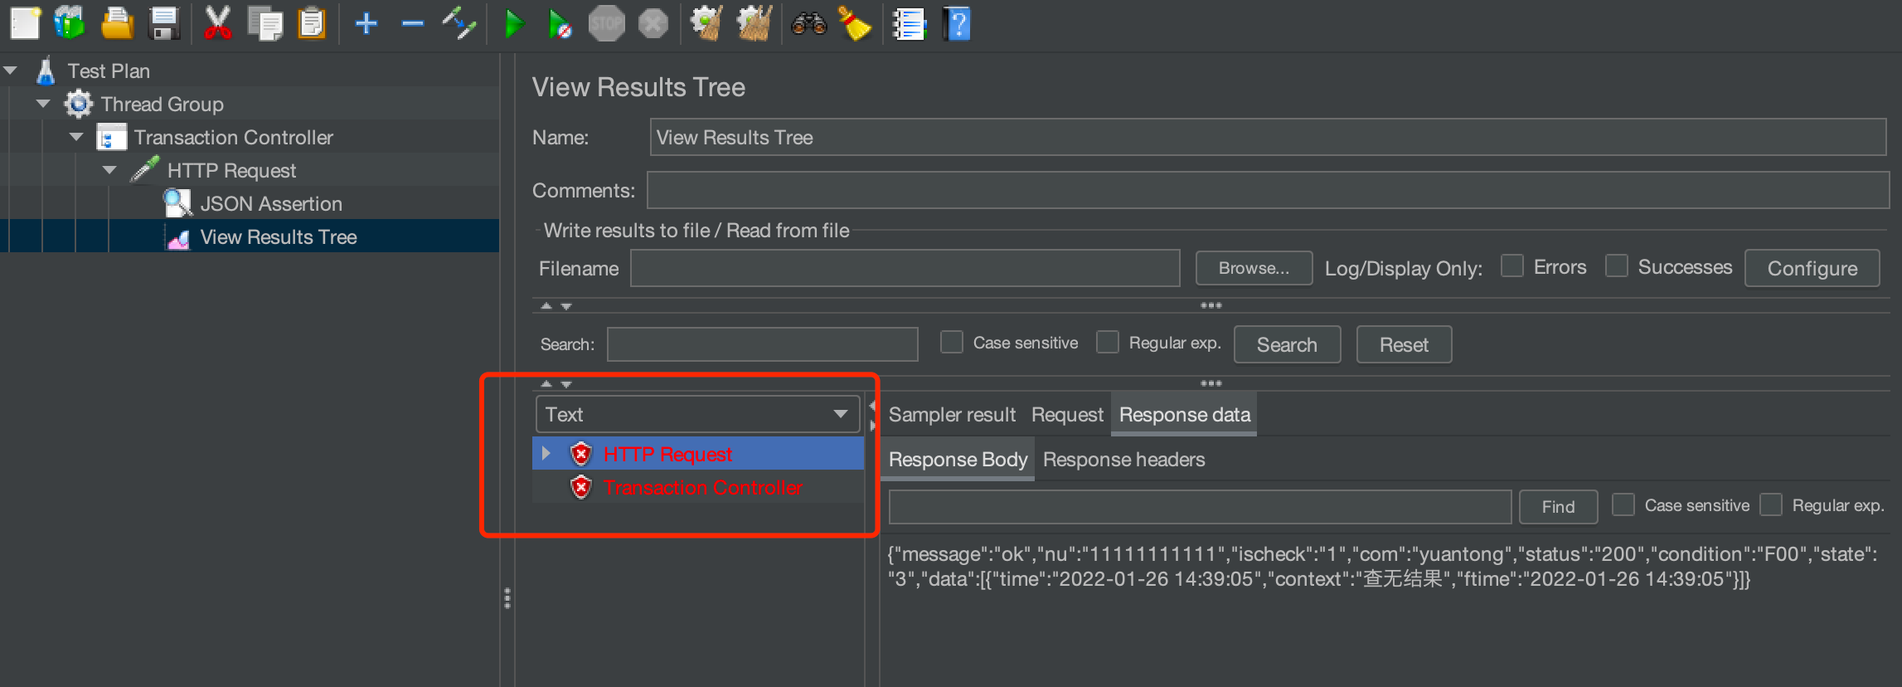
Go back to JSON Assertion and check the Invert assertion.
Timers
The pause time between requests in the performance test is called "thinking time." In the real world, the pause time can be spent on content search or reading, and the Timer simulates this pause.
All timers in the same scope are executed before the samplers.
If you want the timer to be applied to only one of the samplers, add the timer to the child node of the sampler.
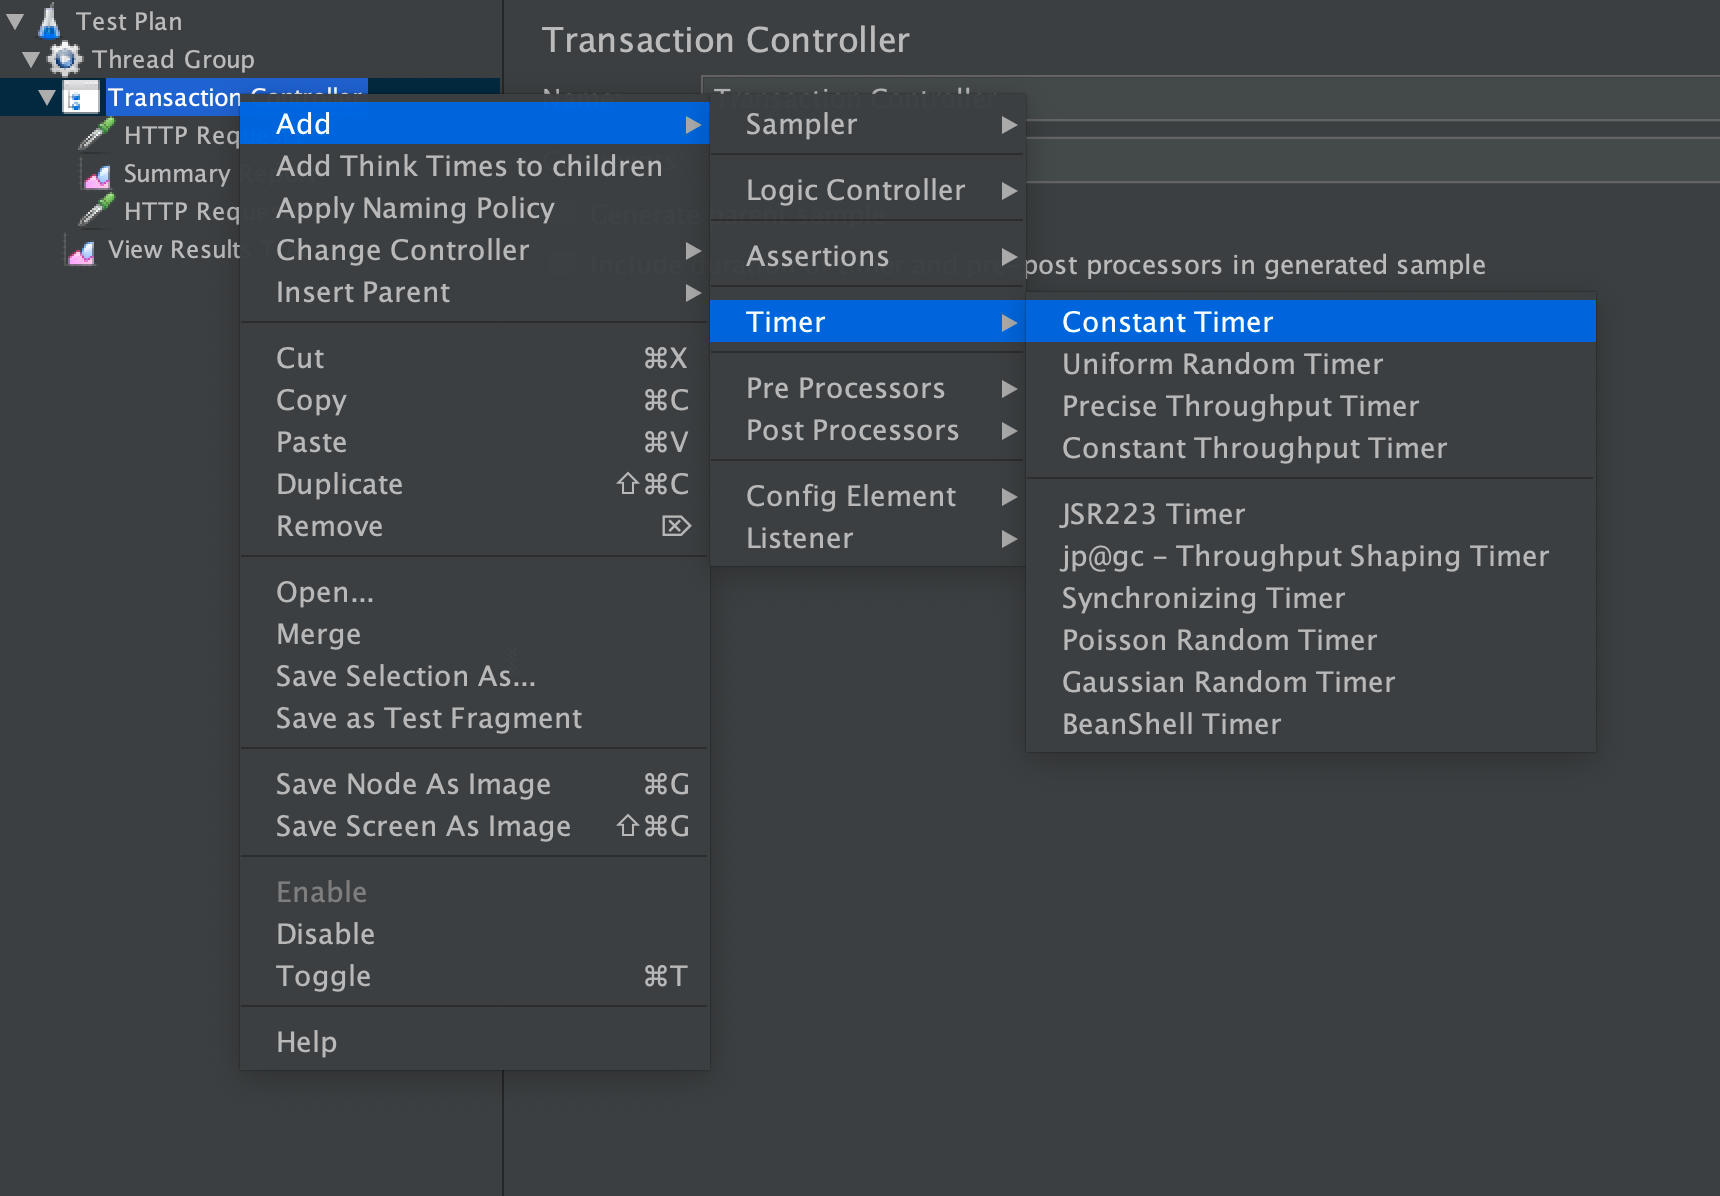
JMeter timers mainly include Constant Timer, Uniform Random Timer, Precise Throughput Timer, Constant Throughput Timer, Gaussian Random Timer, JSR223 Timer, Poisson Random Timer, Synchronizing Timer, and BeanShell Timer.
Constant Timer
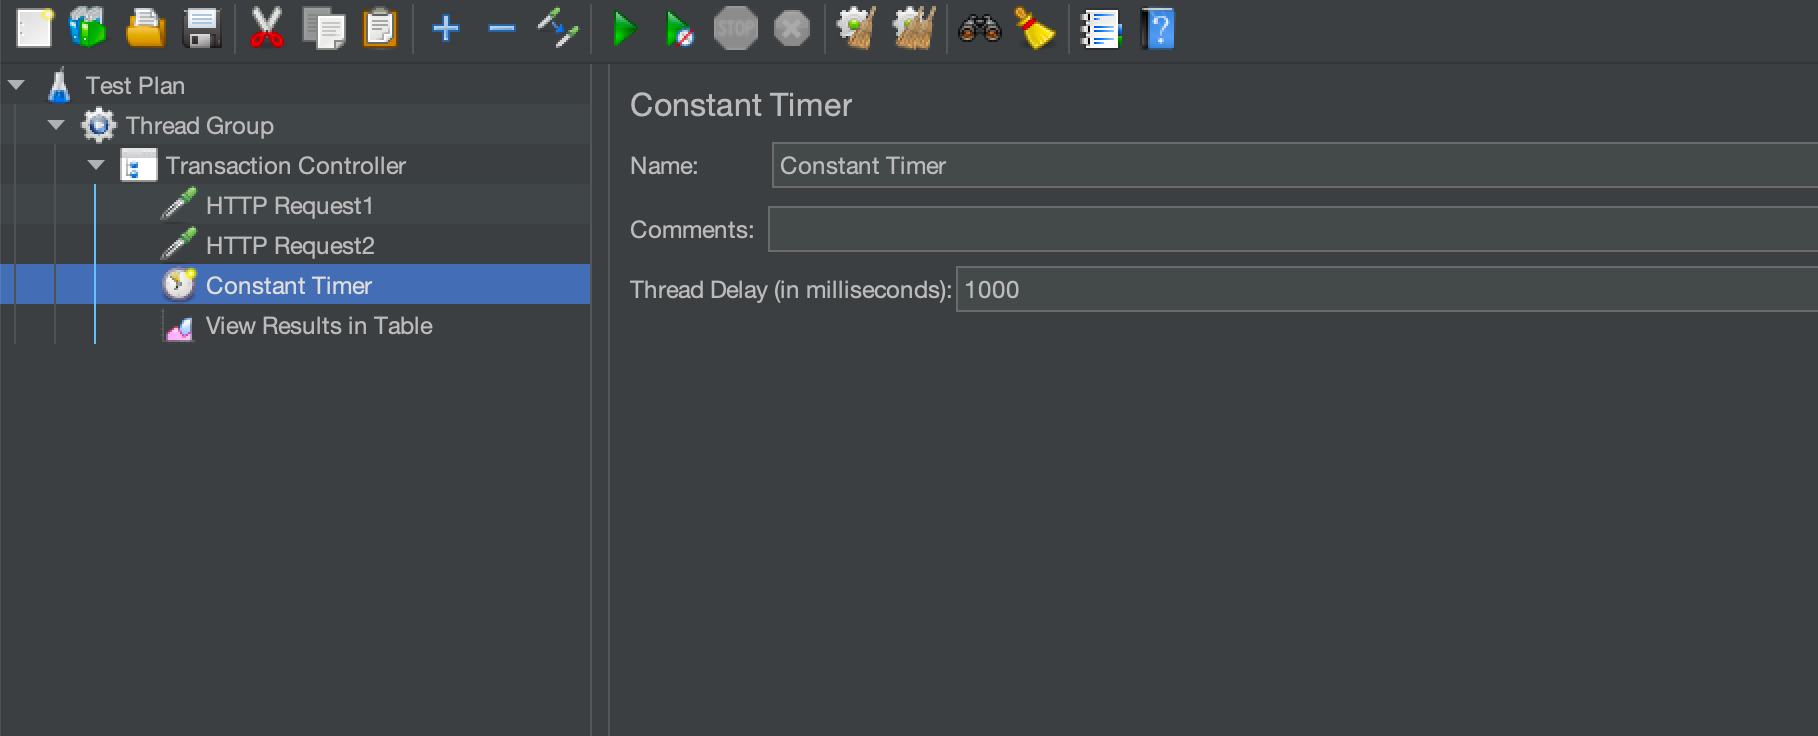
A Constant Timer means that the interval between each request is a fixed value.
After configuring the thread delay to 100 and 1000, respectively, run the script:
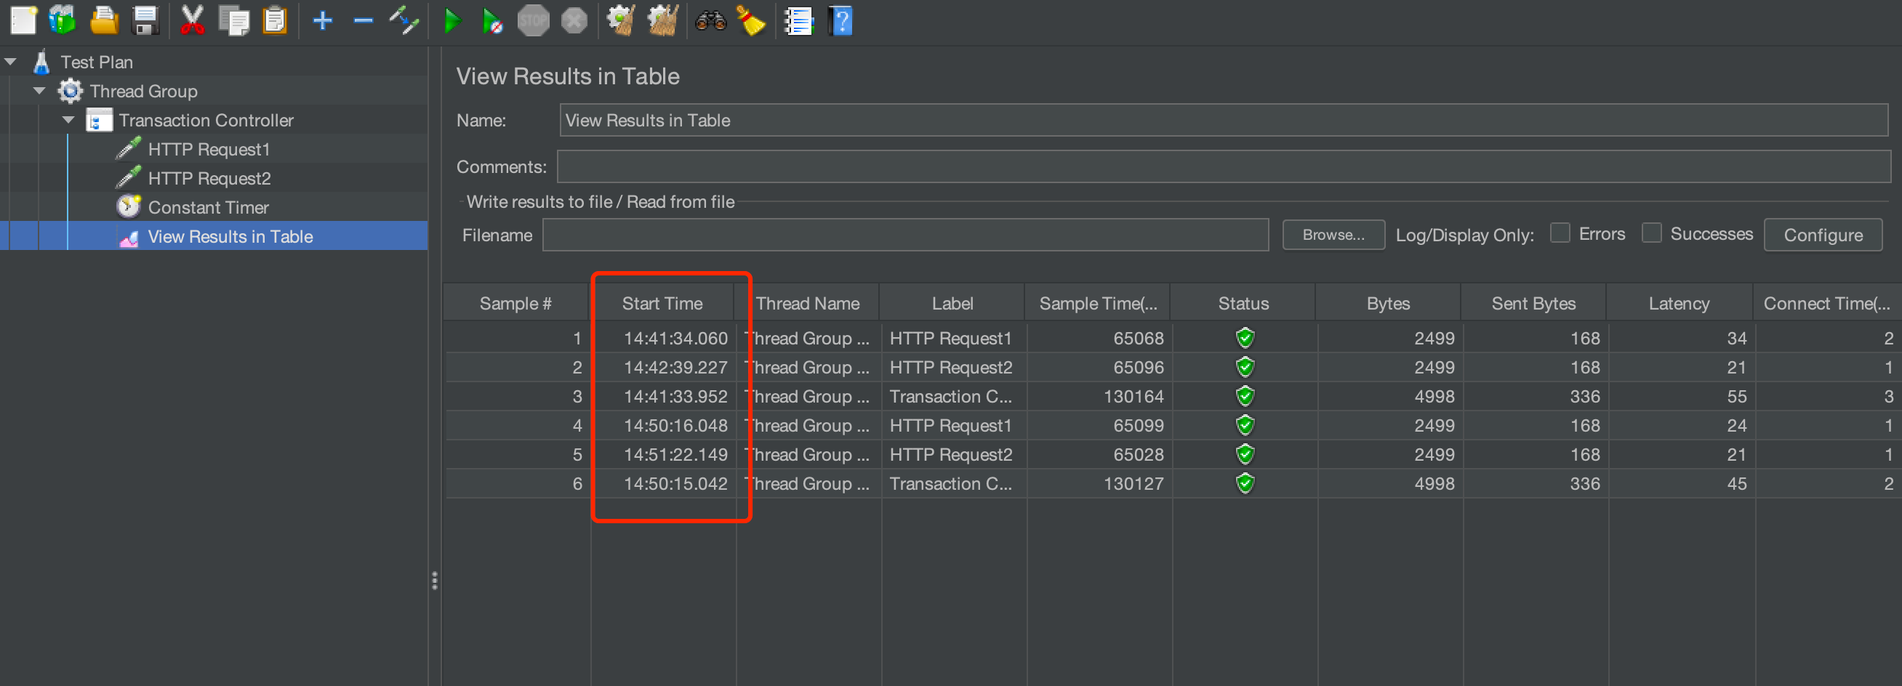
Check the data in the table, where #1 and #2 are the running results when the configuration is 100 milliseconds, and #4 and #5 are the running results when the configuration is 1000 milliseconds. You can see that the interval between #4 and #5 is significantly greater than that between #1 and #2:
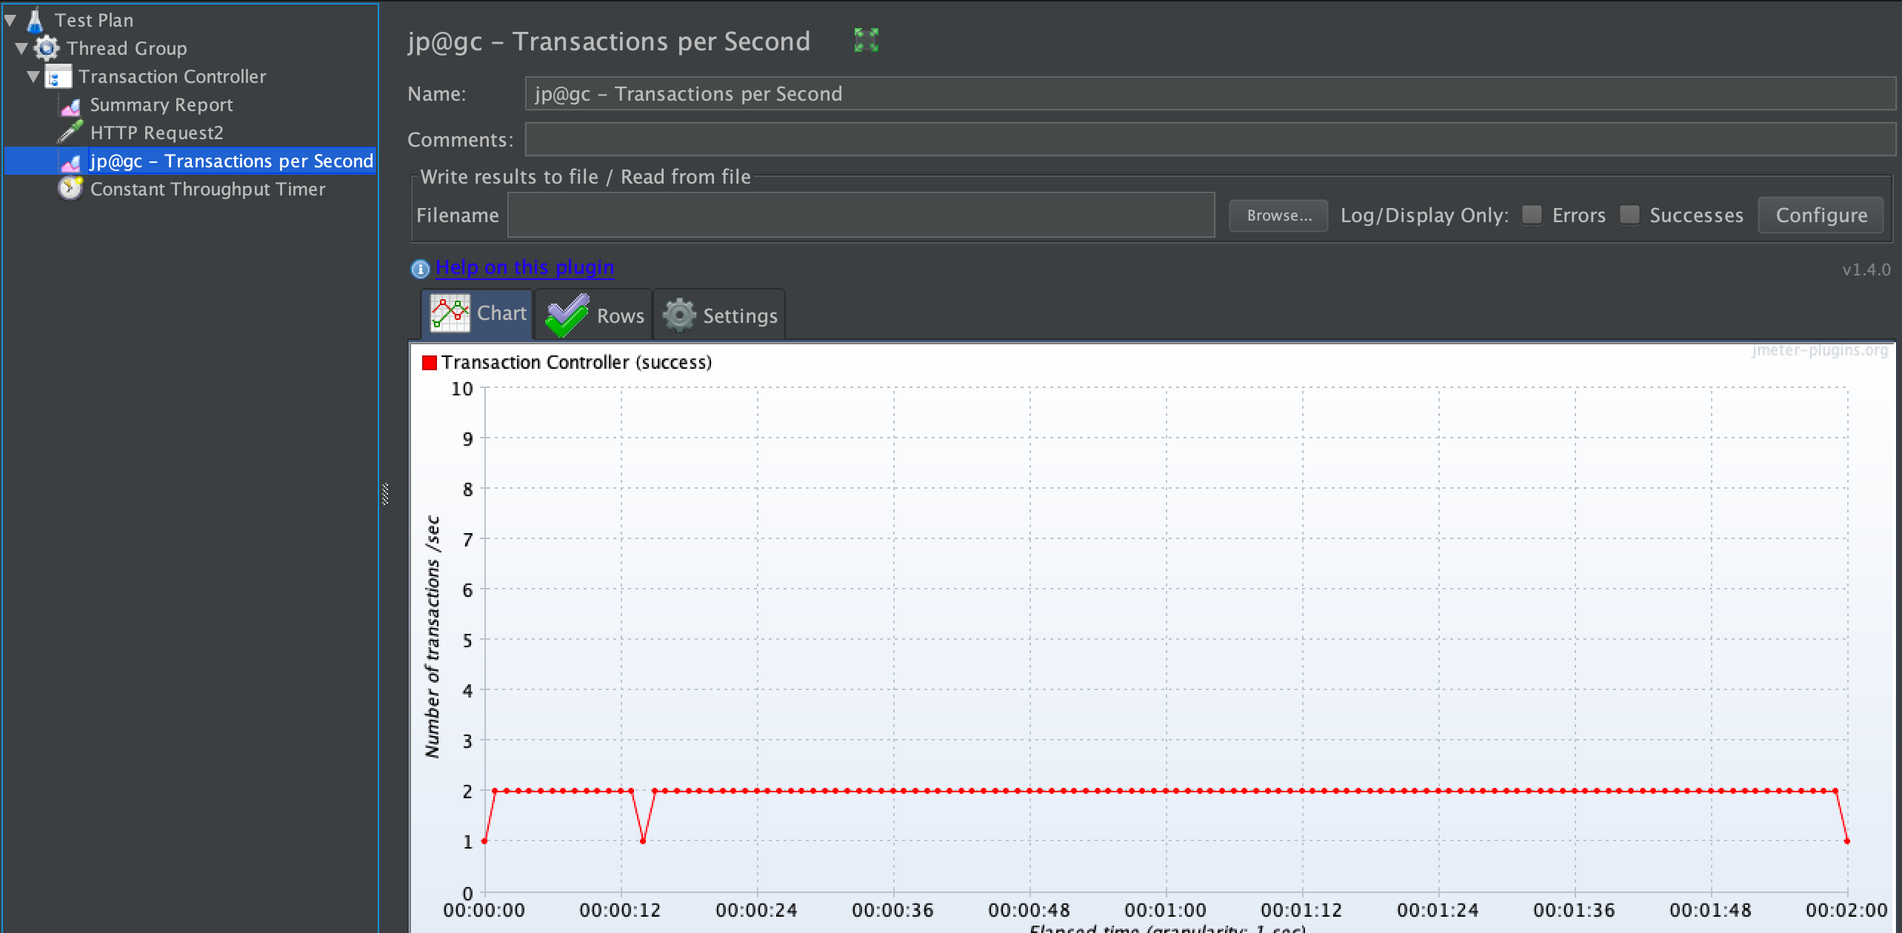
Constant Throughput Timer
The Constant Throughput Timer controls the execution of requests according to the specified throughput.
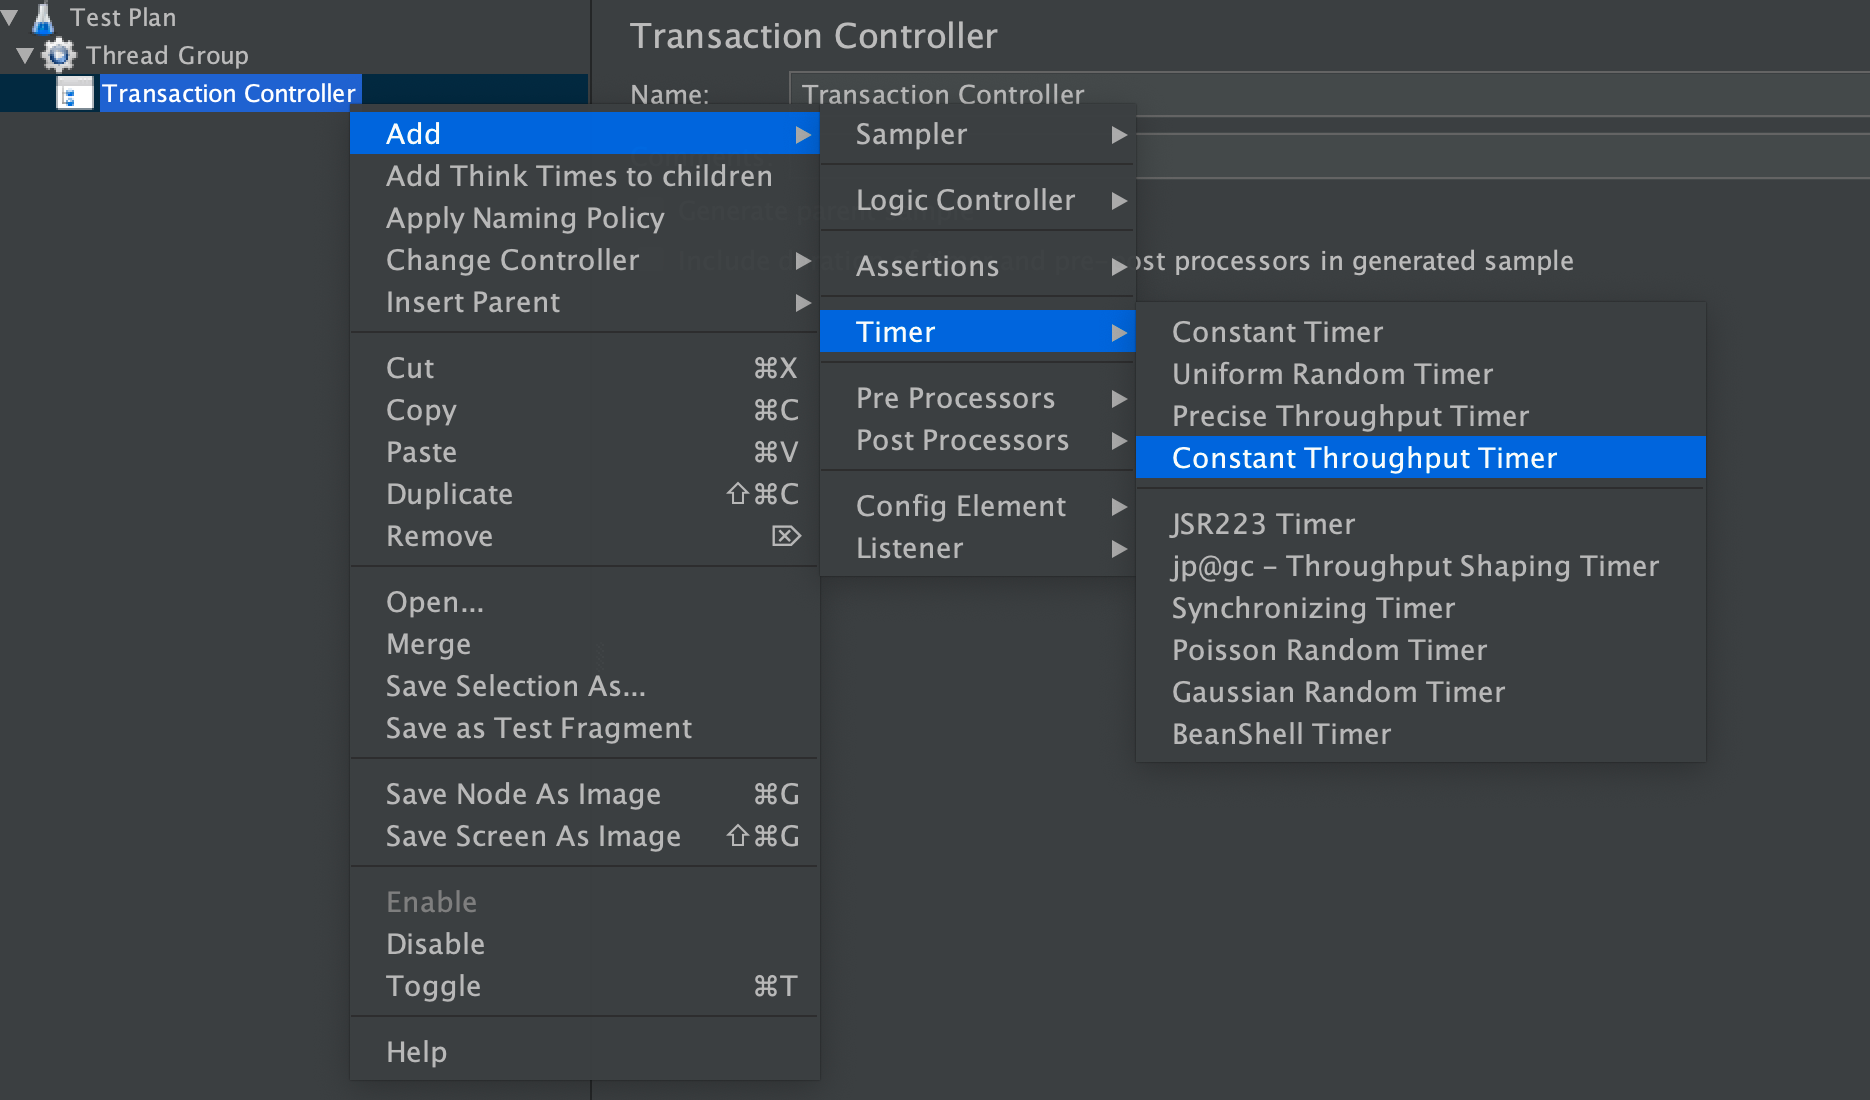
Configure the target throughput as 120 (note that the unit is minutes), and then select All active threads in current thread group (shared) based on the calculated throughput:
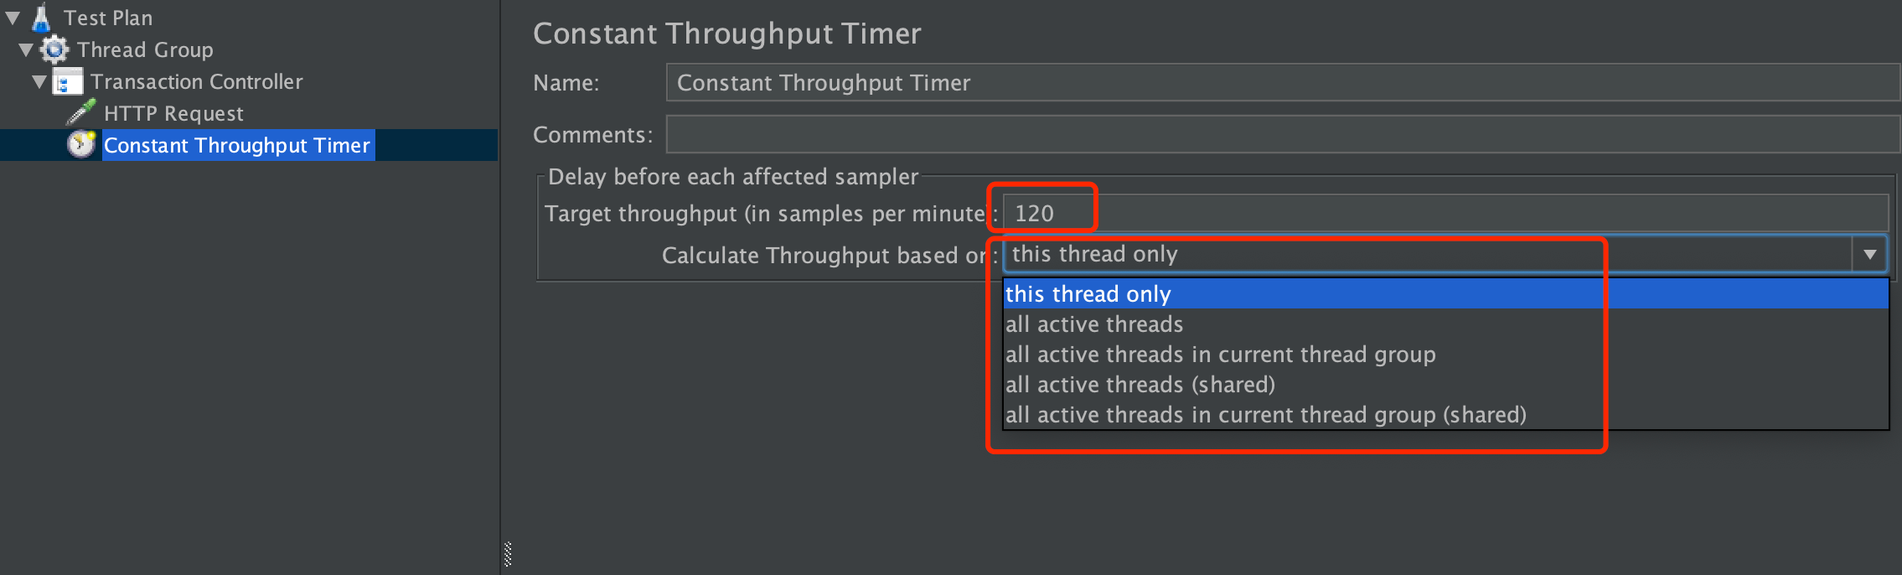
Run the script, check the results, and observe that the throughput is approximately 2/second (120/60).
Pre-Processors and Post-Processors
A pre-processor performs some operations before the sampler request. It's often used to modify parameters, set environment variables, or update variables.
Similarly, a post-processor performs some operations after the sampler request. Sometimes, the response data needs to be used in subsequent requests, and you need to process the response data. For example, if the jwt token in the response is obtained and used for authentication in subsequent requests, the post-processor is used.
Using JMeter
The above is the introduction to the main test components of JMeter, and now you can feel confident in starting your own tests. In another article, I will explain using the MQTT plugin in JMeter.
Published at DZone with permission of Chongyuan Yin. See the original article here.
Opinions expressed by DZone contributors are their own.
Comments