Building News Sentiment and Stock Price Performance Analysis NLP Application With Python
A short lab on how to engineer a machine learning (ML) NLP sentiment analysis web app using a market data API, Flask, and NLTK Python libraries.
Join the DZone community and get the full member experience.
Join For FreeIn this tutorial, I will explore a fintech idea that combines news sentiment analysis and stock trading to make news more actionable for algorithmic trading. This tutorial presents a step-by-step guide on how to engineer a solution that leverages market data API and a sentiment score to demonstrate any correlation between news sentiment and stock price performance.
Traders thrive on having instant access to information that enables them to make quick decisions. Consider a scenario where a trader can promptly identify and access news that directly impacts the performance of their stocks, referred to as investor sentiment. However, reading through articles and discerning the content can be time-consuming and may result in missed opportunities. Imagine if traders could receive immediate notifications within their order management software (OMS) whenever a stock they want to trade receives positive media coverage, which could potentially influence the stock price. This idea also presents the opportunity of automating buy/sell decisions by integrating real-time news sentiment scoring into algorithmic strategies.
To begin, let's take a look at a product demo showcasing the features and functionality of the application.
This application relies on a market data provider that offers stock price history and news feeds. An OMS-embedded market data solution that supports low-latency data streaming, such as Bloomberg Market Data Feed is best suited for a real-world scenario. The OMS can then highlight securities based on the real-time news and sentiment scores allowing a trader to make a fast decision.
For this tutorial, I will acquire a news feed and stock price history from the Mboum Finance API market data provider available on the Rapid API Hub. We will make use of two API endpoints: "stock/history/{stock}/{interval}" for retrieving stock price history (Figure 1) and "market/news/{stock}" for obtaining the stock news feed (Figure 2).

Figure 1.
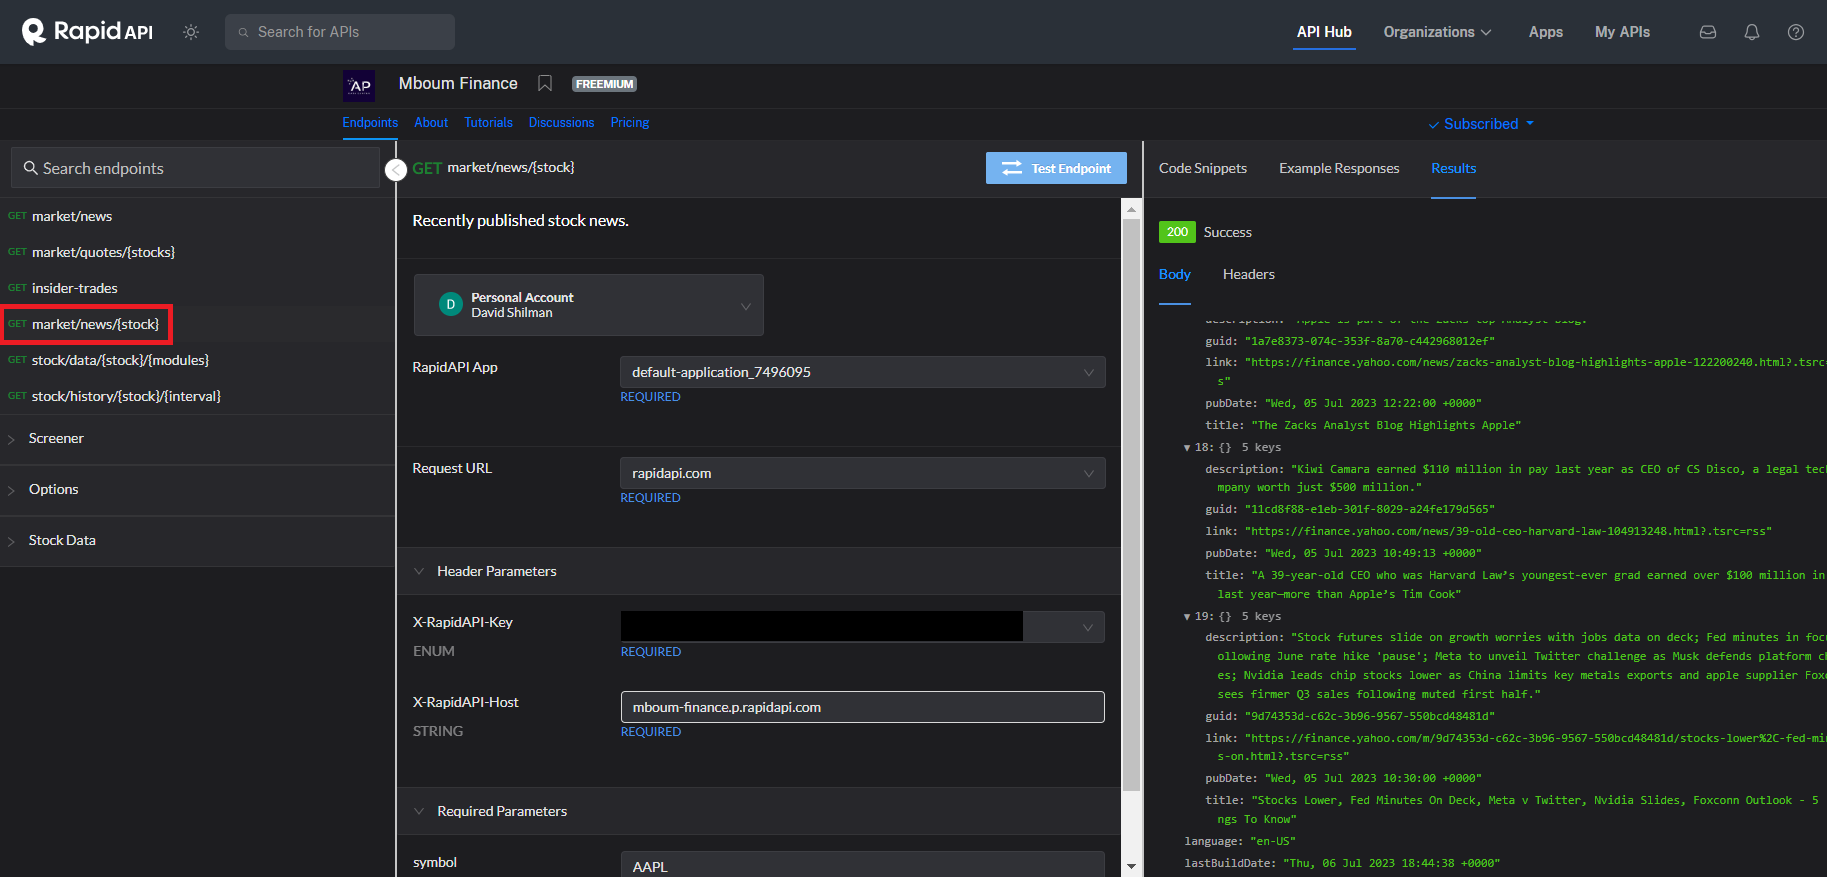
Figure 2.

Figure 3 illustrates the user input page, where users enter a stock ticker
Once the user submits the ticker, the form invokes the Python Flask analyze/ API route. Figure 4 shows its implementation and includes the following logic flow:
- Retrieve stock news feed from Mboum Finance API
- Calculate news sentiment scores using the Python Panda and Natural Language Processing (NLK) libraries
- Visualize sentiment scores using the Python Plotly library bar graph
- Retrieve the earliest news date to be used to filter out all stock prices outside that period (Figure 5)
- Retrieve stock price history from Mboum Finance API
- Visualize the stock price using the Plotly line graph (Figure 6)
- Change the Headline column to clickable links
- Render consolidated results in the analysis.html template
@app.route('/analyze', methods=['POST'])
def analyze():

    ticker = request.form['ticker'].strip().upper()
    # 1. get news feed
    news_df = get_news(ticker)
    # 2. calculate sentiment scores
    scored_news_df = score_news(news_df)
    # 3. create a bar diagram
    fig_bar_sentiment = plot_sentiment(scored_news_df, ticker)
    graph_sentiment = json.dumps(fig_bar_sentiment, cls=PlotlyJSONEncoder)
    # 4. get earliest data time from the news data feed
    earliest_datetime = get_earliest_date(news_df)
    # 5. get price history for the ticker, ignore price history earlier than the news feed
    price_history_df = get_price_history(ticker, earliest_datetime)
    # 6. create a linear diagram
    fig_line_price_history = plot_hourly_price(price_history_df, ticker)
    graph_price = json.dumps(fig_line_price_history, cls=PlotlyJSONEncoder)
    # 7. Make the Headline column clickable
    # scored_news_df['Headline'] = scored_news_df['Headline'].apply(lambda title: f'<a href="{title[1]}">{title[0]}</a>')
    scored_news_df = convert_headline_to_link(scored_news_df)

    # 8. render output
return render_template('analysis.html', ticker=ticker, graph_price=graph_price, graph_sentiment=graph_sentiment, table=scored_news_df.to_html(classes='mystyle', render_links=True, escape=False))def get_earliest_date(df: pd.DataFrame) -> pd.Timestamp:
date = df['Date Time'].iloc[-1]
py_date = date.to_pydatetime()
return py_date.replace(tzinfo=EST)
def get_price_history(ticker: str, earliest_datetime: pd.Timestamp) -> pd.DataFrame:
........
data_dict = []
print(f"earliest_datetime: {earliest_datetime}")
for stock_price in price_history.values():
date_time_num = stock_price["date_utc"]
utc_datetime = datetime.fromtimestamp(date_time_num, tz=pytz.utc)
est_datetime = utc_datetime.astimezone(tz=EST)
if est_datetime < earliest_datetime:
continue
price = stock_price["open"]
data_dict.append([est_datetime.strftime(date_format), price])
columns = ['Date Time', 'Price']
df = pd.DataFrame(data_dict, columns=columns)
df['Date Time'] = pd.to_datetime(df['Date Time'], format=date_format)
df.sort_values(by='Date Time', ascending=True)
df.reset_index(inplace=True)
df.drop('index', axis=1, inplace=True)
return dfimport pandas as pd
import plotly.express as px
import plotly.graph_objects as go
......
def plot_sentiment(df: pd.DataFrame, ticker: str) -> go.Figure:
df.drop(df[df['Sentiment Score'] == 0].index, inplace = True)
df = df.resample('H').mean(numeric_only=True)
fig = px.bar(data_frame=df, x=df.index, y='Sentiment Score',
title=f"{ticker} Hourly Sentiment Scores")
return fig
def plot_hourly_price(df, ticker) -> go.Figure:
fig = px.line(data_frame=df, x=df['Date Time'],
y="Price", title=f"{ticker} Price")
return fig 
Figure 7 shows the Flask analysis.html template output, which renders the sentiment scores and stock price charts displayed side-by-side for visual correlation.
If you want to explore the application source code, I recommend cloning this GitHub repository.
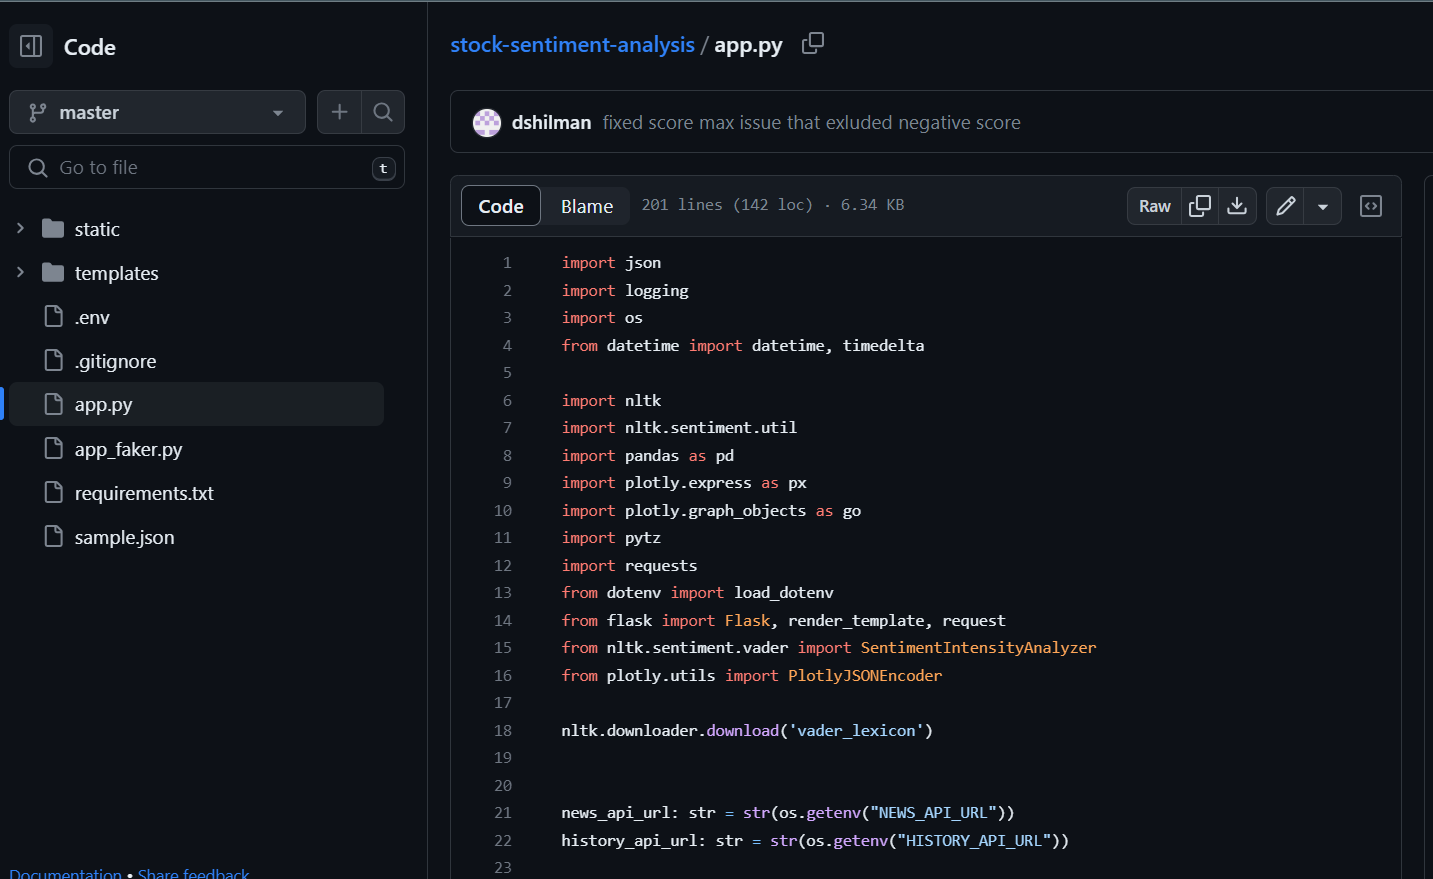
Figure 8.
Finally, I want to acknowledge Damian Boh and his excellent article on Medium, "Build a Stock Sentiment Web App with Flask and Deploy it Online." This detailed and informative article served as an inspiration for my project.
Published at DZone with permission of David Shilman. See the original article here.
Opinions expressed by DZone contributors are their own.
Comments