

Building Charts Using C3.js
It's time to visualize.
 CORE
·
CORE
·
Join the DZone community and get the full member experience.
Join For FreeIntroduction
C3.js is D3.js (D3 = Data-Driven Document) based JavaScript chart library. It is simple to use, customizable, and provides a nice API. It can be used to create visualizations using SVG, HTML, and CSS.
Why use C3.js
- C3.js is a simple wrapper around D3.js and is faster to render, has good cross-browser compatibility, and is very simple to integrate.
- Easy to use: C3.js make it easy to render D3 based charts by wrapping the code required to construct the entire chart.
- It is easy to customize.
- API/Controllable: C3 provides a variety of callbacks to access the state of the chart. By using these APIs and callbacks, you can update the chart, even after it is rendered.
Environment Setup
Option-1:
You can use the following link as an online C3 playground. This will allow you to quickly try C3 using a web browser without installing anything.
http://jsfiddle.net/7kYJu/4742/
Option-2:
This is the one, I will be using in this post. I will set up a project on my local machine. I am using Visual Studio Code for development.
- Starter Project. See this post about a Basic Front-end Dev Environment Setup for instructions.
- npm i c3 (to install c3 via npm, or see the getting started link for other options).
- npm i d3 (we also need d3, as c3 depends on it).
- Update the index.html page for the required references of JavaScript and CSS (see next image).
- If you clone the code repository of this demo, it is already setup for you.
Index.html
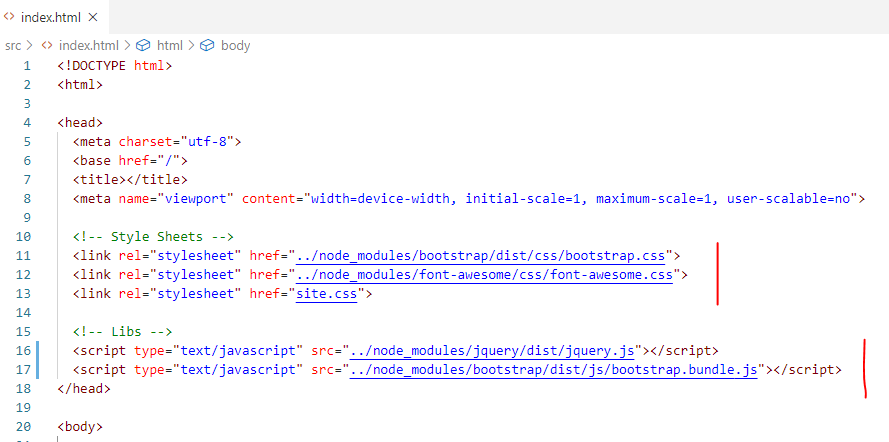
Here is the head section of index.html. It contains links to style sheets and JavaScript files for bootstrap and jQuery:
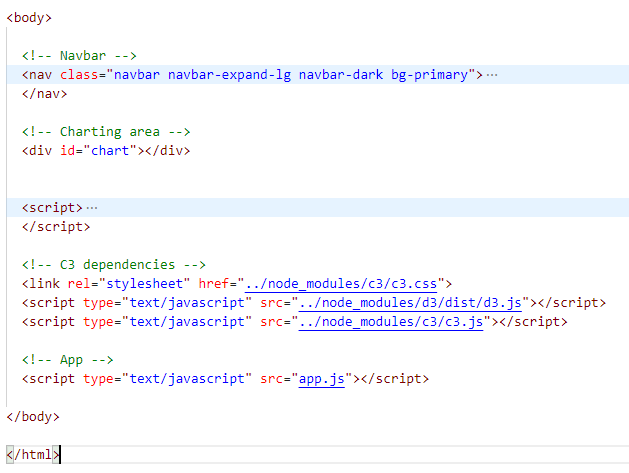
The following picture shows the body section for the page. We have a div for the chart we will be using for rendering. We also have some script references for C3.js and also one for our application i.e. app.js.
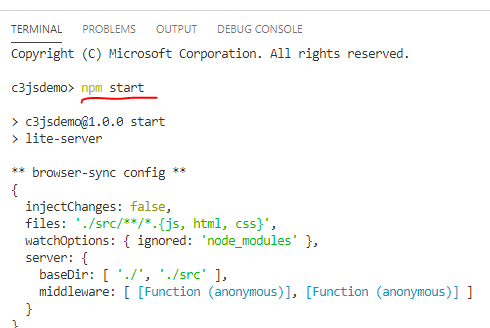
You can now run the application using npm start command and open a web browser and visit http://localhost:3000:

Generate a Pie Chart
Ok, let's start simple and create a pie chart.
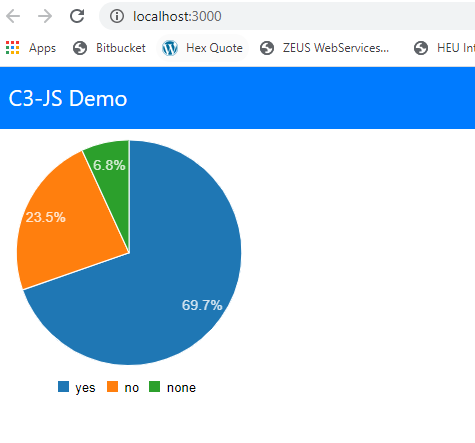
We did a survey and asked our customers if they like our app or not. The survey results came in, and now we want to show the results in nice visualization. We want to show how many users like the app, how many dislike the app, and how many even did not prefer to answer. In this case, using a pie chart is really useful.
In app.js, update the code as follows:
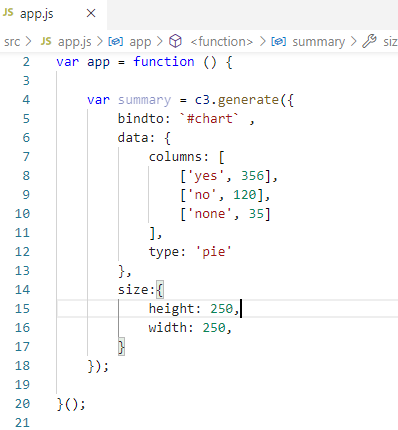
We are using the generate function from c3. We provide it a target-div (chart), which we already have in index.html. Then, the data object contains information about our survey result and we define the type of chart ‘pie’. This is c3 style, and we have to provide the data in this format. the size property contains the width and height of the chart.
And here is the output of this code:
Generating a Line Chart
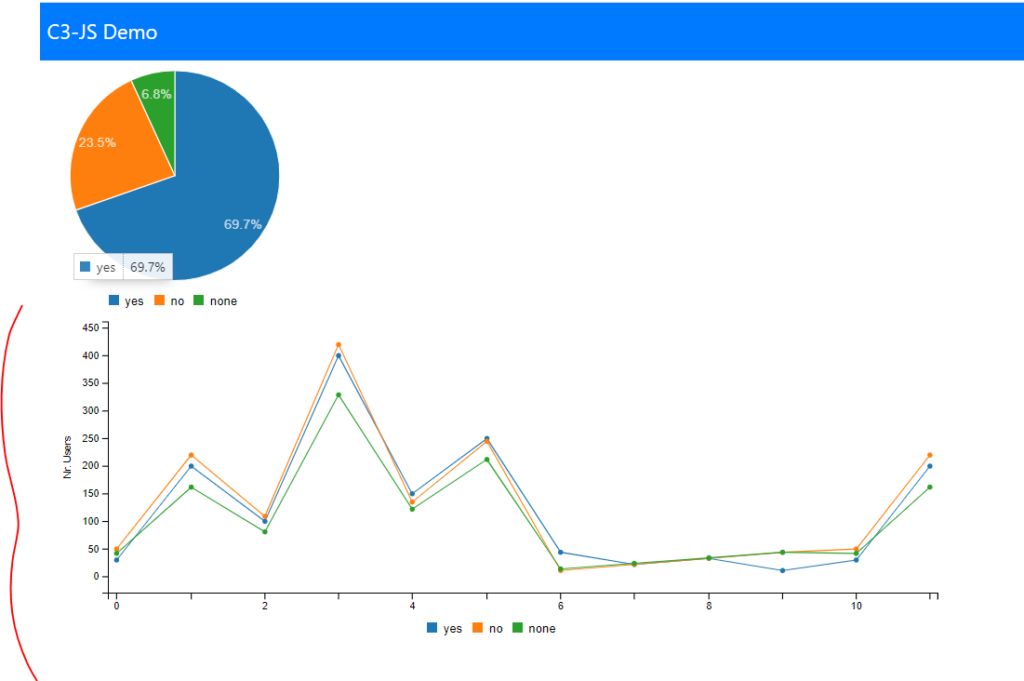
Line charts are more convenient for timeline visualization. In this case, we want to see user feedback over the last 12 months.
This type of chart is useful to show how data changes over time.
Here is the JavaScript code (in the app.js file) that generates the chart and bind it to a div on index.html:
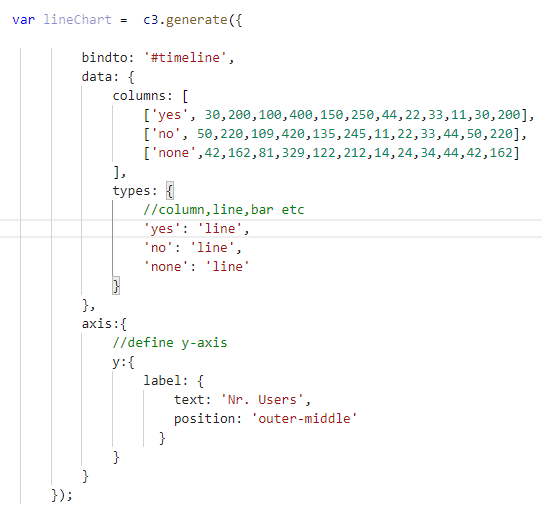
You can see, that this code is a little bit more complex than the pie chart example. We still have the bindto attribute, and the data attribute now contains more data and types. The axis attribute allows us to customize the y-axis in this example. The following is the output of the chart generated by this code.
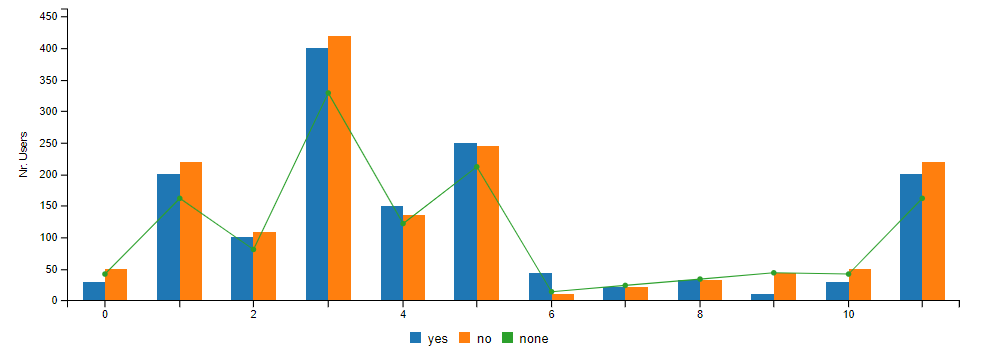
We can further customize it, for example, by changing the type attribute as shown below:
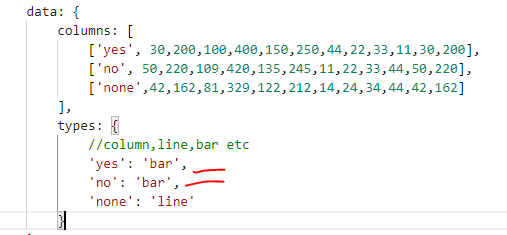
And now the visualization will be as shown below (we have now both the bar and line types):
Now, let's take it one step further and consider that we want to show the month values instead of numbers on the x-axis of our survey result data. We can achieve this by changing our code slightly as shown below:
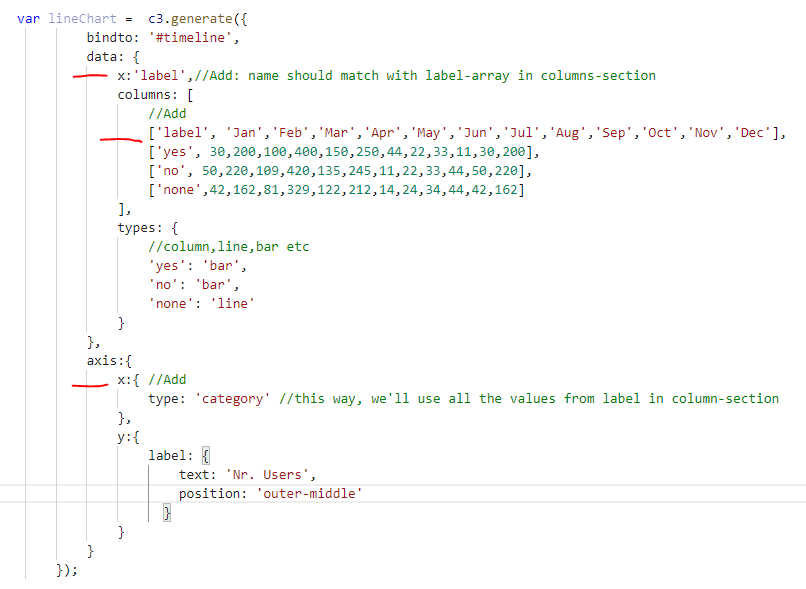
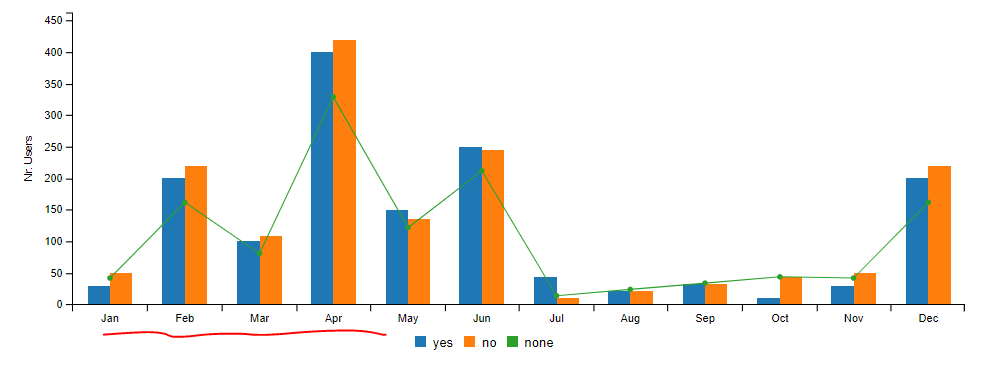
Notice the marked lines for the updated code, and here is the output of the changes. You can see that now the chart is showing month names instead of numbers on the x-axis:
CSS Customization
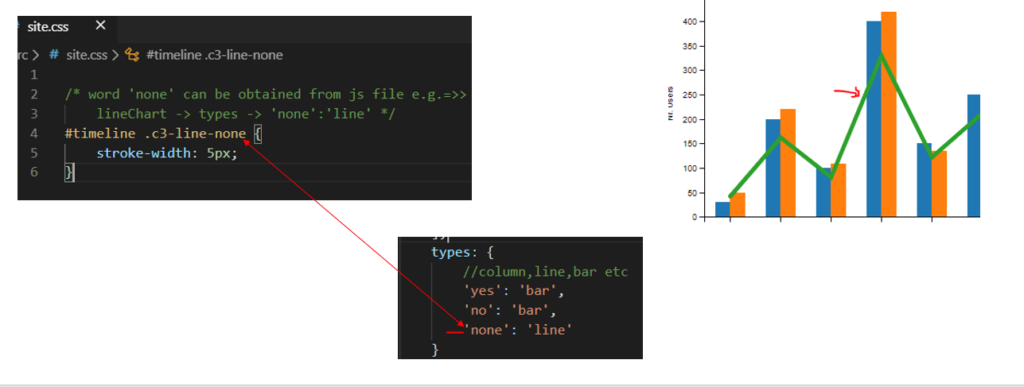
Customizing Line Charts (Size of Lines)
We will use CSS for this customization.
Add the following style to site.css. Here we are targeting the line type on our chart, and with this simple style, we are able to customize the size of the line.
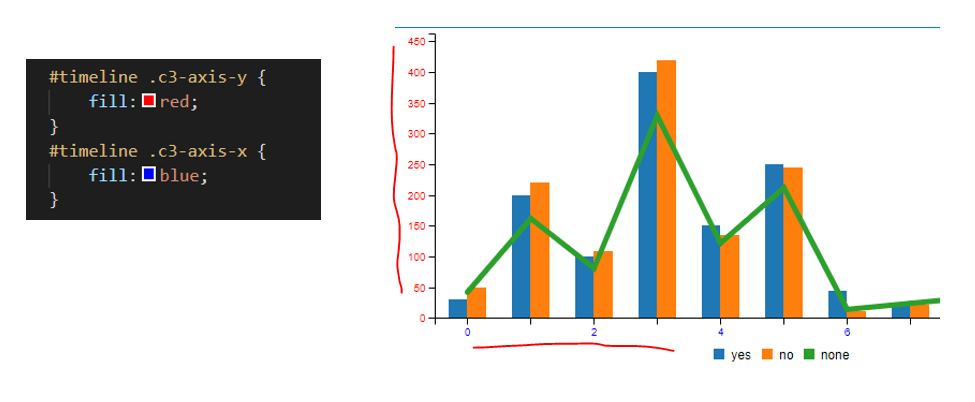
Customizing the Axes
Here is an example of how can you change the color of the x- and y-axis
Summary
This was a basic introduction to the C3.js charting library. We learned that it is based on D3 and it simplifies a lot of effort required to build visualizations. There are a lot of chart types that you can use in your web applications. You can learn more about those on the official website at this link.
Related Links
Published at DZone with permission of Jawad Hasan Shani. See the original article here.
Opinions expressed by DZone contributors are their own.
Comments