Calculating AUC and GINI Model Metrics for Logistic Classification
In this code-heavy tutorial, learn how to build a logistic classification model in H2O using the prostate dataset to calculate AUC and GINI model metrics.
Join the DZone community and get the full member experience.
Join For FreeAUC (Area under curve) is an abbreviation for Area Under the Curve. It is used in classification analysis to determine which of the used models predicts the classes best. An example of its application is ROC curves. Here, the true positive rates are plotted against false positive rates. You can learn more about AUC in this Quora discussion.
AUC refers to area under ROC curve. ROC stands for Receiver Operating Characteristic. AUC is not always area under the curve of a ROC curve. In the situation where you have imbalanced classes, it is often more useful to report AUC for a precision-recall curve. You can learn more about AUC and ROC here.
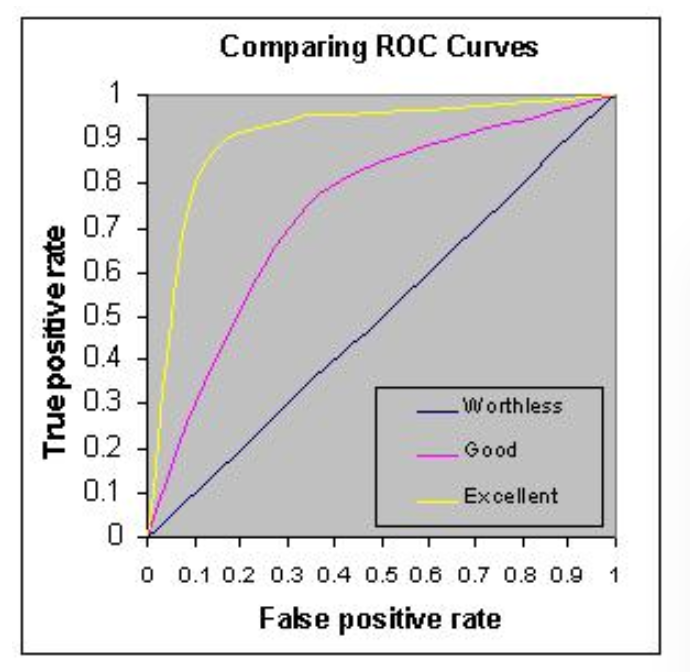
For logistics classification problems, we use AUC metrics to check model performance. Higher is better; however, any value above 80% is considered good and over 90% means the model is behaving great.
We will also look for GINI metrics, which you can learn from Wiki. In this example, we will learn how AUC and GINI model metrics are calculated using True Positive Results (TPR) and False Positive Results (FPR) values from a given test dataset.
You can get the full working Jupyter Notebook here from my GitHub.
Let's build a logistic classification model in H2O using the prostate dataset.
Prepare the H2O environment and dataset:
## Importing required libraries
import h2o
import sys
import pandas as pd
from h2o.estimators.gbm import H2OGradientBoostingEstimator

## Starting H2O machine learning cluster
h2o.init()

## Importing dataset
local_url = "https://raw.githubusercontent.com/h2oai/sparkling-water/master/examples/smalldata/prostate/prostate.csv"
df = h2o.import_file(local_url)

## defining feaures and response column
y = "CAPSULE"
feature_names = df.col_names
feature_names.remove(y)

## setting our response column to catagorical so our model classify the problem
df[y] = df[y].asfactor()
Split the dataset into three sets for training, validating, and testing:
df_train, df_valid, df_test = df.split_frame(ratios=[0.8,0.1])
print(df_train.shape)
print(df_valid.shape)
print(df_test.shape)
Set the H2O GBM estimator and build the GBM model:
prostate_gbm = H2OGradientBoostingEstimator(model_id = "prostate_gbm",
 ntrees=500,
 learn_rate=0.001,
 max_depth=10,
 score_each_iteration=True)

## Building H2O GBM Model:
prostate_gbm.train(x = feature_names, y = y, training_frame=df_train, validation_frame=df_valid)

## Understand the H2O GBM Model
prostate_gbm
Generate model performance with training, validating, and testing datasets:
train_performance = prostate_gbm.model_performance(df_train)
valid_performance = prostate_gbm.model_performance(df_valid)
test_performance = prostate_gbm.model_performance(df_test)
Look at the AUC metrics provided by model performance:
print(train_performance.auc())
print(valid_performance.auc())
print(test_performance.auc())
print(prostate_gbm.auc())
Look at the GINI metrics provided by model performance:
print(train_performance.gini())
print(valid_performance.gini())
print(test_performance.gini())
print(prostate_gbm.gini())
Generate the predictions using the test dataset:
predictions = prostate_gbm.predict(df_test)
## Here we will get the probability for the 'p1' values from the prediction frame:
predict_probability = predictions['p1']
Import the required scikit-learn libraries to generate AUC manually:
from sklearn.metrics import roc_curve, auc
import matplotlib.pyplot as plt
import random
Get the real response results from the test DataFrame:
actual = df_test[y].as_data_frame()
actual_list = actual['CAPSULE'].tolist()
print(actual_list)
Get the result probabilities from the prediction frame:
predictions_temp = predict_probability_x['p1'].as_data_frame()
predictions_list = predictions_temp['p1'].tolist()
print(predictions_list)
Now, let's calculate FPR (false positive rate), TPR (true positive rate), and threshold metrics from the predictions and from the original DataFrame:
fpr, tpr, thresholds = roc_curve(actual_list, predictions_list)
roc_auc = auc(fpr, tpr)
print(roc_auc)
print(test_performance.auc())Note: Above, you will see that our calculated ROC values are exactly the same as given by the model performance prediction for the test dataset.
Let's plot the AUC curve using matplotlib:
plt.title('ROC (Receiver Operating Characteristic)')
plt.plot(fpr, tpr, 'b',
label='AUC = %0.4f'% roc_auc)
plt.legend(loc='lower right')
plt.plot([0,1],[0,1],'r--')
plt.xlim([-0.1,1.2])
plt.ylim([-0.1,1.2])
plt.ylabel('True Positive Rate (TPR)')
plt.xlabel('False Positive Rate (FPR)')
plt.show()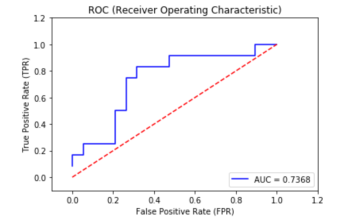
This is how the GINI metric is calculated from AUC:
GINI = (2 * roc_auc) - 1
print(GINI)
print(test_performance.gini())Note: Above, you will see that our calculated GINI values are exactly same as given by the model performance prediction for the test dataset.
That's it; enjoy!
Published at DZone with permission of Avkash Chauhan. See the original article here.
Opinions expressed by DZone contributors are their own.
Comments