Understanding the Mandelbrot Set: A Beautiful Benchmark for Computing Power
Explore how the Mandelbrot set, a complex fractal generated by simple math, serves as a benchmark for testing computing power memory and parallel processing.
Join the DZone community and get the full member experience.
Join For FreeImagine a mathematical object so complex that it can push computers to their limits, yet so beautiful that it has captivated mathematicians and artists alike. Welcome to the world of the Mandelbrot set—a fascinating fractal that doubles as a powerful benchmark for computing performance.
Have you ever wondered how to compare the performance of different programming languages? While there are many benchmarking tools available, the Mandelbrot set offers a uniquely compelling approach that combines mathematical elegance with computational challenge.
What is the Mandelbrot Set?
Imagine you're embarking on a Mathematical Journey with these steps:
- Start with zero
- Square your current number
- Add your special "journey number"
- Repeat steps 2-3 many times
Some journey numbers create paths that stay close to the starting point forever, while others lead to explosive growth. The Mandelbrot set is the collection of all journey numbers that keep the path within a distance of 2 from the start.
Let's explore two different journeys:
| Step | Well-Behaved Journey (0.2) | Explosive Journey (2) |
|---|---|---|
| Start | 0 | 0 |
| 1 | 0² + 0.2 = 0.2 | 0² + 2 = 2 |
| 2 | 0.2² + 0.2 = 0.24 | 2² + 2 = 6 |
| 3 | 0.24² + 0.2 = 0.2576 | 6² + 2 = 38 |
| 4 | 0.2576² + 0.2 = 0.26635 | 38² + 2 = 1,446 |
| Result | Stays close to origin | Grows wildly |
| Impact | Part of Mandelbrot set (black region in visualization) | Not in Mandelbrot set (colored region, color depends on growth rate) |
The Mathematical Definition
In mathematical terms, the Mandelbrot set is defined in the complex plane. For each point c in this plane, we iterate the function f(z) = z² + c, starting with z = 0. If the absolute value of z remains bounded (typically below 2) after many iterations, the point c is in the Mandelbrot set.
Here's the same example using mathematical notation:
| Iteration | Well-Behaved Point (c = 0.2) | Divergent Point (c = 2) |
|---|---|---|
| Start | z₀ = 0 | z₀ = 0 |
| 1 | z₁ = 0² + 0.2 = 0.2 | z₁ = 0² + 2 = 2 |
| 2 | z₂ = 0.2² + 0.2 = 0.24 | z₂ = 2² + 2 = 6 |
| 3 | z₃ = 0.24² + 0.2 = 0.2576 | z₃ = 6² + 2 = 38 |
| 4 | z₄ = 0.2576² + 0.2 = 0.26635 | z₄ = 38² + 2 = 1,446 |
| Result | Likely in Mandelbrot set (|z₄| ≈ 0.26635 < 2) | Not in Mandelbrot set (|z₄| = 1,446 > 2) |
This mathematical representation shows how the same process defines the Mandelbrot set, creating a bridge between the intuitive journey analogy and the formal mathematical concept.
Visualization Example
To help visualize what we’re discussing, I’ve created an interactive Mandelbrot set Visualization Playground.
You can explore the fractal in real-time and find the complete implementation in my GitHub repository:
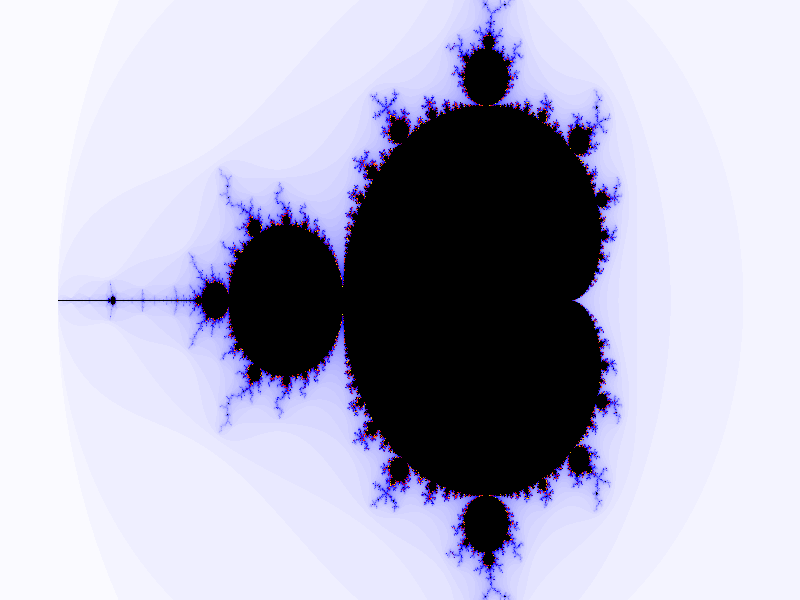
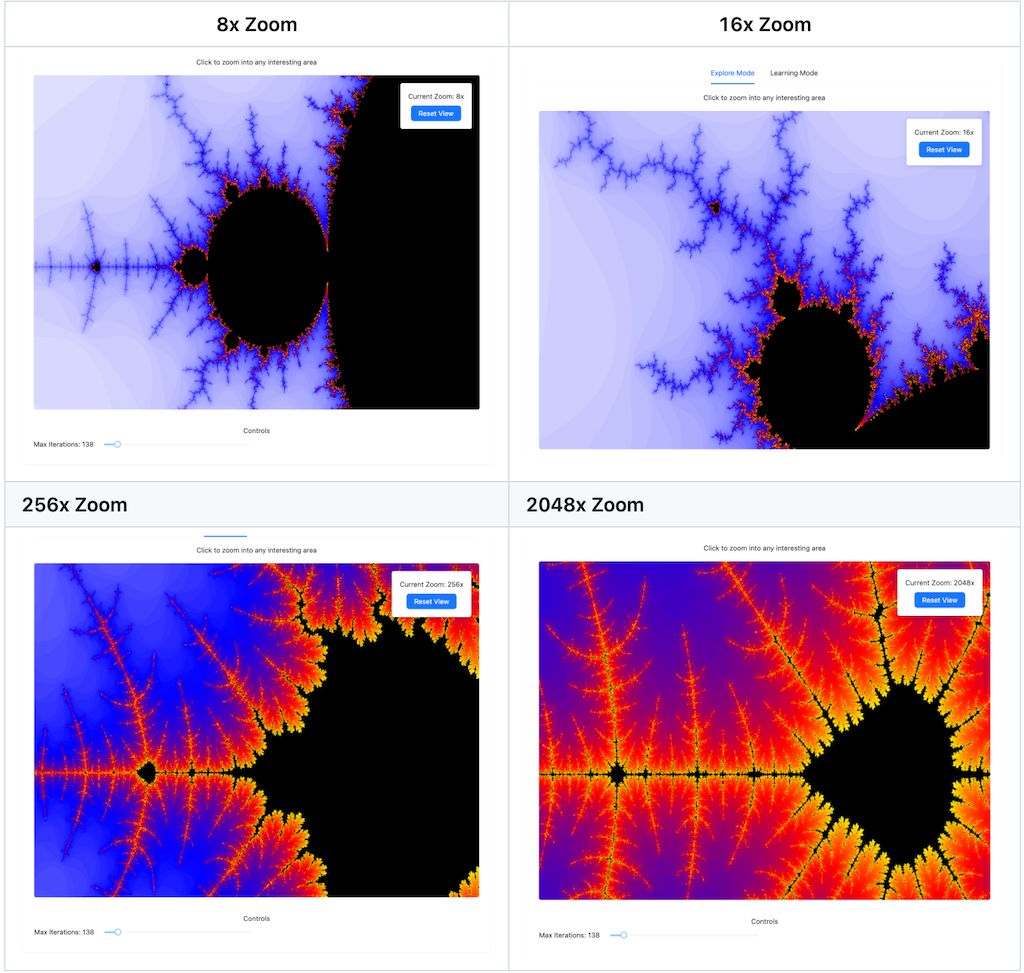
This visualization demonstrates the concepts we've discussed:
- Black region: Points that stay bounded (the Mandelbrot set)
- Colored regions: Points that grow beyond bounds, with colors indicating growth speed
- Blue/Purple: Slower growth
- Red/Yellow: Faster growth
Creating the Visual Magic
The stunning visuals of the Mandelbrot set come from how we color each pixel based on its calculation results.
Here's a quick note on the mathematics behind it:
- The set is bounded within (-2.5, 1.0) on the x-axis and (-1.0, 1.0) on the y-axis because these boundaries capture all points that stay bounded under iteration.
- If a sequence stays bounded (below 2) after many iterations, that point is part of the Mandelbrot set and appears black in our visualization.
- All other points are colored based on how quickly their sequences grow beyond this boundary.
Let's break down the coloring process with a practical example using an 800x600 image:
-
Coordinate Mapping: Each pixel maps to a unique point in the Mandelbrot space:
Python# The Mandelbrot set exists within these mathematical boundaries: # x-axis: from -2.5 to 1.0 (total range of 3.5) # y-axis: from -1.0 to 1.0 (total range of 2.0) # For pixel (400, 300) in an 800x600 image: x_coordinate = (400/800) * 3.5 - 2.5 # Maps 0-800 to -2.5 to 1.0 y_coordinate = (300/600) * 2.0 - 1.0 # Maps 0-600 to -1.0 to 1.0 -
Color Assignment:
Pythondef get_color(iteration_count, max_iter=100): # Points that stay bounded (part of Mandelbrot set) if iteration_count == max_iter: return (0, 0, 0) # Black # Convert iteration count to a percentage (0-100%) percentage = (iteration_count * 100) // max_iter # Map percentage to color ranges (0-255) # First third (0-33%): Blue dominates if percentage < 33: blue = 255 red = percentage * 7 # Gradually increase red return (red, 0, blue) # Example: (70, 0, 255) for 10% # Second third (33-66%): Purple to red transition elif percentage < 66: blue = 255 - ((percentage - 33) * 7) # Decrease blue return (255, 0, blue) # Example: (255, 0, 128) for 50% # Final third (66-100%): Red to yellow transition else: green = (percentage - 66) * 7 # Increase green return (255, green, 0) # Example: (255, 128, 0) for 83%
Why Is It Computationally Intensive?
Creating a visual representation of the Mandelbrot set requires performing these calculations for every pixel in an image. This is computationally demanding because:
- Volume of Calculations: A typical HD image has over 2 million pixels, each requiring its own sequence of calculations with hundreds or thousands of iterations.
- Precision Matters: Small numerical errors can lead to completely different results, necessitating high-precision arithmetic to maintain the fractal's integrity.
- No Shortcuts: Each pixel's calculation is independent and must be fully computed, as we can't predict if a sequence will stay bounded without performing the iterations.
Using the Mandelbrot Set as a Benchmark
The Mandelbrot set is an excellent choice for comparing programming language performance for several reasons:
- Easily Comparable: The output should be identical across all implementations, making verification straightforward through visual comparison.
- Scalable Complexity: Adjustable parameters for image size and iteration count create varying workloads for different testing scenarios.
- Tests Multiple Aspects: It evaluates floating-point arithmetic performance, loop optimization, memory management, and potential for parallelization.
Implementation for Benchmarking
Here's a basic structure that you could implement in any programming language:
def calculate_mandelbrot(width, height, max_iter):
    # Convert each pixel coordinate to Mandelbrot space
    for y in range(height):
        for x in range(width):
            # Map pixel to mathematical coordinate
            x0 = (x / width) * 3.5 - 2.5
            y0 = (y / height) * 2.0 - 1.0

            # Initialize values
            xi = yi = iter = 0

            # Main calculation loop
            while iter < max_iter and (xi * xi + yi * yi) <= 4:
                # Calculate next values
                tmp = xi * xi - yi * yi + x0
                yi = 2 * xi * yi + y0
                xi = tmp
                iter += 1

            # Color pixel based on iteration count
            result[y * width + x] = iter
Tips for Effective Benchmarking
When using the Mandelbrot set as a benchmark:
- Parameter Standardization: Establish uniform test conditions by fixing image dimensions, iteration limits, and precision requirements across all benchmark implementations.
- Performance Metrics: Comprehensively evaluate performance by measuring calculation time, memory consumption, and computational resource utilization.
- Holistic Evaluation: Assess not just technical performance, but also implementation complexity, code quality, and optimization potential across different programming environments.
Conclusion
The Mandelbrot set isn't just a mathematically fascinating object—it's also a powerful tool for comparing programming language performance. Its combination of intensive computation, precision requirements, and visual verification makes it an ideal benchmark candidate. Whether you're choosing a language for a performance-critical project or just curious about relative language speeds, implementing the Mandelbrot set can provide valuable insights into computational efficiency.
The most effective benchmark aligns with your specific use case. While the Mandelbrot set excels at measuring raw computational power and floating-point performance, supplementing it with additional benchmarks will provide a more complete picture of language performance for your particular needs.
Published at DZone with permission of Vivek Vellaiyappan Surulimuthu. See the original article here.
Opinions expressed by DZone contributors are their own.
Comments