Comparison of JavaScript Pivot Grids for Developers
We take a look at some interesting tools that allow web developers to quickly make pivot grids so their team can ingest and comb through data easier.
Join the DZone community and get the full member experience.
Join For FreeIn this article, I’d like to consider the most popular JavaScript pivot grid components. During this review, I won’t dive into the coding since each grid has exhaustive and well-written documentation (at least, I hope so). Instead, I’ll focus on the core features of each pivot grid. Since I believe that there are some beginner developers among the readers, I’ll pay particular attention to documentation and demo pages. It’s a pretty convenient way to learn something while having a working example before your eyes. Therefore, demo pages with code examples and detailed descriptions will be a plus.
The principle of pivots selection is simple. I’ll check the most popular of those that can be used as stand-alone components. The reason is that I’m looking for relatively cheap and lightweight options leaving complex solutions for the future articles. So, let’s take a look at the list of JavaScript pivot grids I’m going to review today:
1. Flexmonster
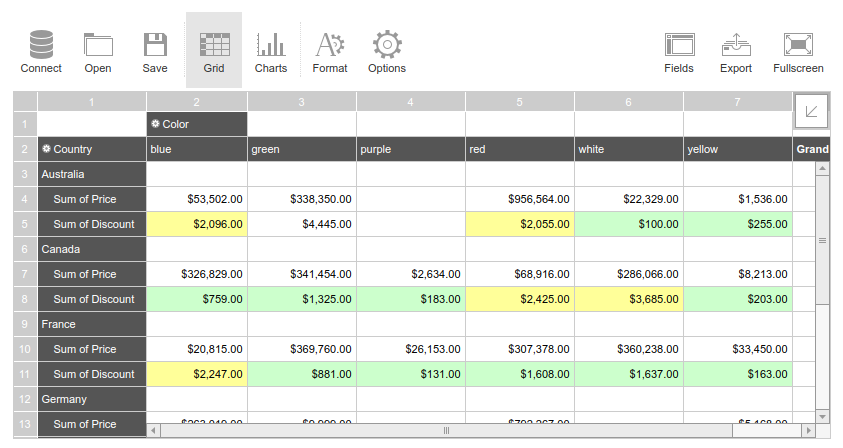
Flexmonster is a pivot table component that works on main desktop and mobile operating systems such as Windows, macOS, Linux, iOS, and Android. The cross-browser support allows running Flexmonster based applications in Chrome, Firefox, Internet Explorer, Safari, or Opera without any additional plugins such as Flash or Java. The list of supported server-side technologies includes .NET, Java, PHP, Ruby, and many others. If you work with one of the popular frameworks such as jQuery, Angular, React, RequireJS, or PhoneGap, you’ll like the integration possibilities. Another distinctive feature is the availability of wrappers for TypeScript, C#, and Java. As you can see, this pivot table can be integrated with almost any project due to wide support of modern web development technologies. One of the main intentions of developers was to provide the possibility to work with huge amounts of data. As a result, using this JavaScript pivot grid, you can work with big data sets from SQL DBs or files up to 100 MB. You can be assured that rendering even millions of rows won’t cause any freezes or lags.
The number of supported data formats won’t disappoint you either. You can work with CSV, JSON, SQL databases (Oracle, MySQL, etc.), XMLA providers (MS Analysis Services, Mondrian, and icCube). This component is fully customizable due to its rich API. There’s the possibility to define what features will be enabled or disabled. As well, you can build your custom scenarios around the component. API covers every aspect of data presentation. All settings can be stored in a report object which can be saved and restored if needed.
Flexmonster provides users with dozens of handy features. For example, there are three ways of filtering:
Filtering by members’ names, users can choose which exact members will be shown for a particular field.
Filter by value returns top X results.
Report filter can be used for convenient data representation in reports. It allows you to focus on important data subsets and avoid overloading with large amounts of unnecessary info.
The sorting feature allows placing rows and columns in alphabetical or numeric order. The grouping feature allows saving some screen space which is especially helpful in the case of mobile devices. The built-in exporting feature allows exporting your table to the following formats: HTML, CSV, Excel, PDF, and PNG.
This component supports different types of formatting:
Conditional formatting allows highlighting cells depending on particular values.
Number formatting is convenient for changing the appearance of numbers, without actual changing of value. You can add currency symbols or decimal separators.
The demo page contains a lot of examples each of which is explained in detail. The source code for each demo is available on JSFiddle. The documentation page is pretty detailed and contains a lot of step-by-step guides, code examples, and some screenshots. Looks like a great component indeed! But unfortunately, it’s not a free tool. The annual subscription will cost you $799. Perpetual license, in its turn, costs $1999.
You may also like: 4 Free Web Pivot Tables You Should Try for Your Web Reporting.
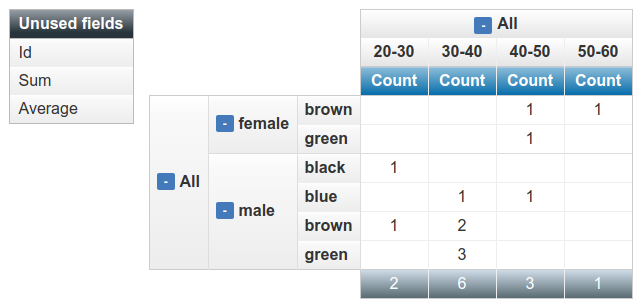
2. PivotTable.js
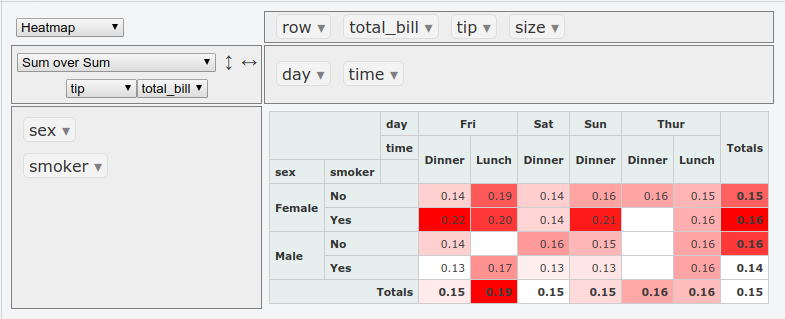
PivotTable.js is a lightweight open-source JavaScript Pivot Table with the drag-n-drop support. This component allows changing the appearance by re-defining the initial color set and using a custom color scale. Almost every part of this pivot grid can be customized with ease. For example, the localization process is quite simple and well-described in the documentation. The input data is a set of records with attributes. It can be passed to the app in different ways: CSV files, arrays of objects, arrays of arrays, functions that call back, or jQuery references to simple tables.
In addition to the built-in table, heat map, and table-bar chart renderers, PivotTable.js allows creating different types of charts. You can use either C3 Charts, D3 Visualizations, or Google Charts for such tasks. Unfortunately, currently, there’s no feature that allows you to export to an Excel file. But you can generate TSV output similar to the Table Renderer, which, in turn, can be copy-pasted to Excel. This component was initially designed to be a client-side component. It requires all the data to be supplied up front in the browser. Thus, you can integrate this library with any server-side technology which is able to provide data in a compatible format, but there is no ‘deep’ integration beyond the original data load.
The main page of the project contains a bunch of demos, each of which has the basic description and source code. The documentation wiki describes the use of the main parameters and features. In general, I can say that the documentation is rather modest. But since PivotTable.js is a pretty simple and minimalistic component, it’s unlikely that you will face any difficulties. This pivot grid is a free-to-use tool and distributed under the MIT license.
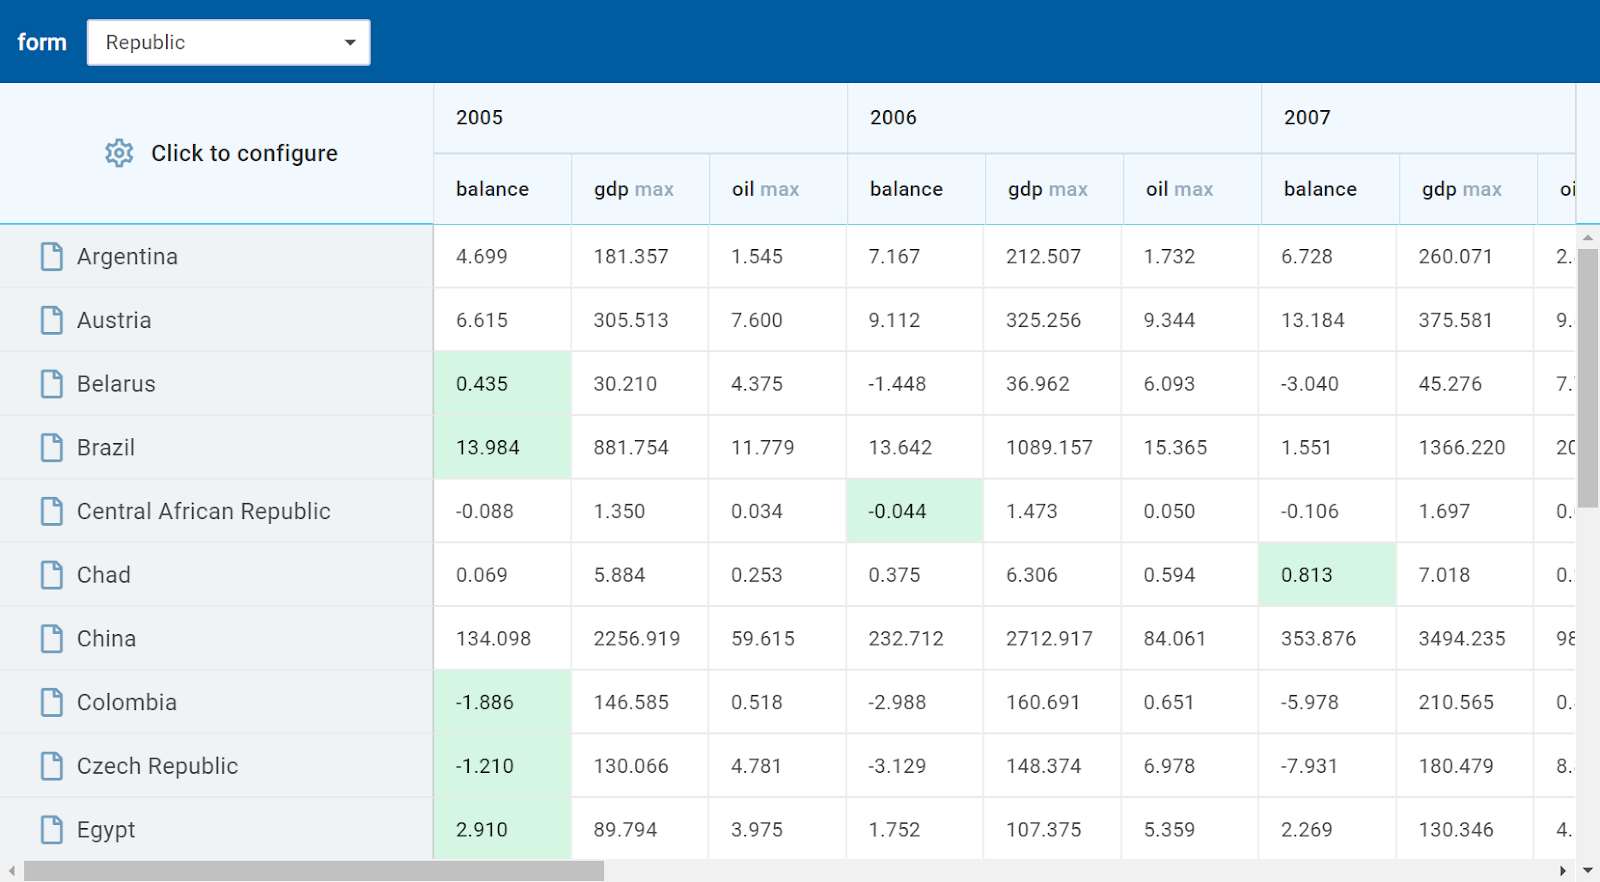
3. dhtmlxPivot
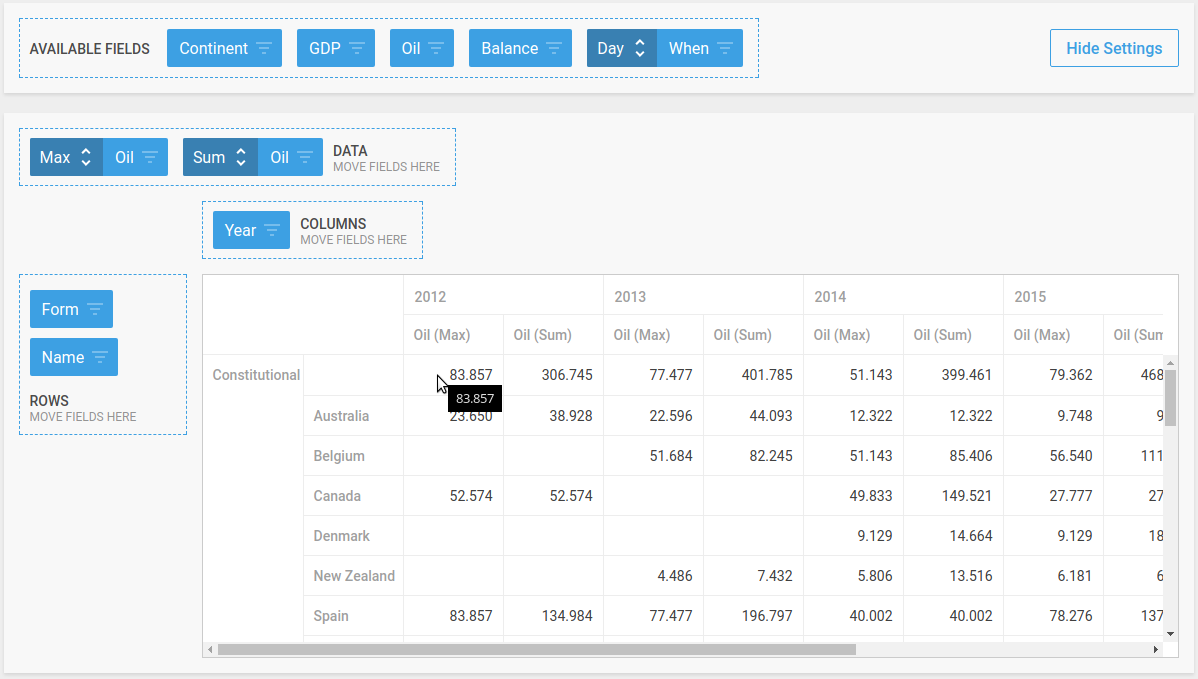
The dhtmlxPivot JavaScript component is a fully-customizable pivot grid intended for rendering huge amounts of data. Despite the size of the dataset used, your app will run smoothly on all browsers. You can customize each aspect of this pivot by modifying one of the available attributes. To simplify the work with this component, developers are provided the possibility to load data in JSON format. Besides that, you can use CSV, the same format that the Google Spreadsheet uses. To load data that is stored on the server, you can use Java, .NET, PHP, Node.js, and other technologies.
Using aliases, you can make a data set more compact by reducing the number of duplicate data values. Conditional cell formatting allows for the highlighting those cells that have particular values. You can filter the content of cells in accordance with the type of data they contain. There are three different filters:
String filter
Number filter
Dates filter
By default, dhtmlxPivot supports four basic operations (sum, max, min, and count), but if needed, you can add custom ones. When you click on the header of the row, a sorting icon will appear on the screen in order to help you to sort the listed data according to your needs. The exporting feature allows exporting your tables to the Excel files. It’s worth noting that all custom styles that were added during the work with the table will be exported as well.
The documentation page is quite exhaustive. It has a step-by-step Getting Started guide for those who are just starting to work with this component, a bunch of more advanced guides, and detailed API references. The demos page contains samples that demonstrate the most important features of this pivot table. I can say that dhtmlxPivot is the most well-documented JavaScript component among the other ones mentioned in this article. If you decide to try it, there’s the Free Trial edition available. Besides that, there are two more options. The Commercial license for teams of five or fewer developers will cost you $299. The Enterprise license, which includes extended support, costs $499 at the moment. Among the pivot components that are distributed under a commercial license, dhtmlxPivot is the most affordable option.
4. Orb.js
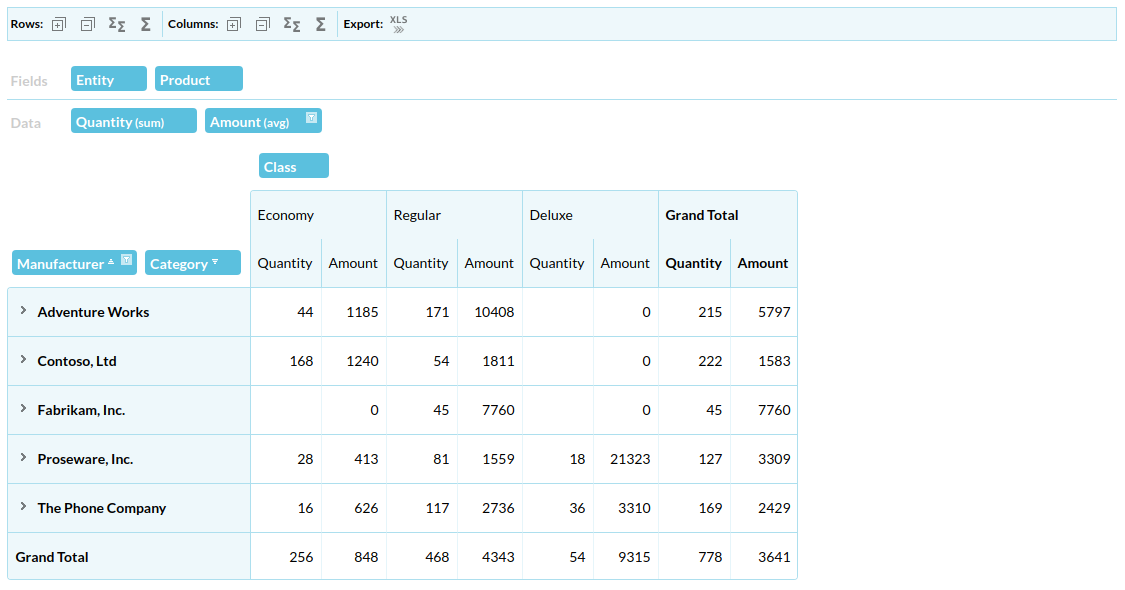
Orb.js is a React-based library for creating pivot grid apps. It provides users with all the required features. The drag-and-drop oriented interface allows for the moving of fields between the axes using the cursor. You can sort the content of a column, use filtering, and drill down into the pivot grid data. Orb.js can evaluate grand totals and subtotals. You can enable fixed headers. The exporting feature allows you to export your table to Excel. This component is fully customizable.
As you can see, there’s nothing fancy here. Only the basic features required for developing a neat, minimalistic, and fast pivot grid. The documentation is not very extensive and does not contain any demos or screenshots that demonstrate what result you’ll get following the instructions. As you might have guessed, this component is a free-to-use tool and distributed under the MIT license.
5. WebPivotTable
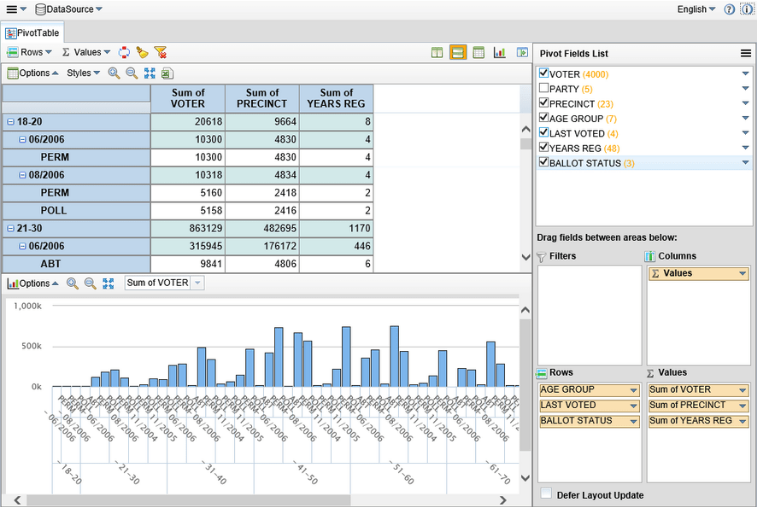
The WebPivotTable component is a pivot table for data analysis and report creation that mimics the behavior of Microsoft Excel. It works in all modern browsers such as Firefox, Chrome, Opera, Safari, and Internet Explorer. Among the supported operating systems, there are Windows, iOS, and Android. The drag-and-drop interface, along with the familiar user interface, makes it pretty easy to use for those who have some experience with Excel. It can run independently, or you can integrate it with your website or web application. This component supports different types of data such as CSV/XLS/XLSX data and Google spreadsheet. As well, you can load CSV data from a local drive, the Internet, or cloud drives. WebPivotTable allows you to create visualizations in the form of charts and it has great basic features such as filtering, sorting, formatting, and layout changes. The exporting feature supports a wide variety of file formats: PDF, Excel HTML, JPEG, and PNG. You can drill through the data by just clicking.
To be honest, I can’t say that the documentation page is able to answer all the questions that may appear during the work with this component. It includes a Quick Start Guide, important info on customization and other aspects, but it’s not as detailed as one can expect. WebPivotTable is distributed under two licenses. You can choose a free edition with limited functionality or go for the Component Edition which will cost you $1,499.
6. jbPivot
jbPivot is a simple jQuery pivot table widget. This one is, probably, the most minimalistic pivot table component among the other examples. You can install it using the npm package manager, and it doesn’t require much effort to get started. The drag-and-drop oriented user interface allows dragging the fields to any axis. There’s the possibility to add records to the table dynamically if needed. The sorting feature allows you to specify whether you want to sort the table items in ascending or descending order. There’s also the possibility to define the custom grouping criteria.
The documentation page does not contain any deep explanations. You’ll only learn how to initialize the component on the page. If you don’t have any previous experience with the pivot tables, it’ll be hard to understand how everything works. However, it’s a pretty good choice if you’re looking for a fast jQuery plugin for creating a pivot table on the page. There’s no exporting or any other complex feature of such kind. But if you’re dealing with small amounts of data, jbPivot will work just fine for you. This component is a free-to-use tool. It’s distributed under the GPLv3 license.
7. Webix Pivot Table
Webix JavaScript Pivot Table widget performs data aggregation. It extracts significant information from extensive datasets. Pivot easily arranges, compares and summarizes complex data. The component is fully customizable. It's possible to change datatable settings, create custom functions for data structuring, adjust filters, customize the configuration window, etc. With Webix Pivot widget you can export data to a number of formats such as PNG, Excel, CSV, PDF. Moreover, you can apply a custom locale to the page and set a different language.
Webix Pivot has a variety of advanced features such as filtering, sorting, cell highlighting, quick configuring, row and column totals, and many others.
The widget supports all platforms and browsers. The widget can be integrated with Vue.js, AngularJS, jQuery, React, and other third-party libraries. There is a backend integration with .NET, PHP, and Node.js.
Webix is available as a free outsource library but you can also buy a Commercial license.
Further Reading
- Top 9 JavaScript Charting Libraries.
- Getting Started With ReGraph — The Graph Visualization Toolkit for React.
- Network Graphs.
Opinions expressed by DZone contributors are their own.
Comments