Creating Dynamic Charts With PHP and PostgreSQL
Walk through the step-by-step process of creating charts by fetching chart data from a database using a PostgreSQL database.
Join the DZone community and get the full member experience.
Join For FreeIn my previous article, we saw how you can create charts in PHP.
In this article, I will walk you through the step-by-step process of creating charts by fetching chart data from a database.
We will be using a PostgreSQL database because of its advantages like reliability, stability, extensibility, cross-platform, and immunity from over-deployment. With this, we will use FusionCharts — a comprehensive, JavaScript-charting library — and its PHP wrapper.
For a better understanding of what I am going to talk about, I will first show you the chart that we will be creating as the sample. This is how our output will look (source code here).
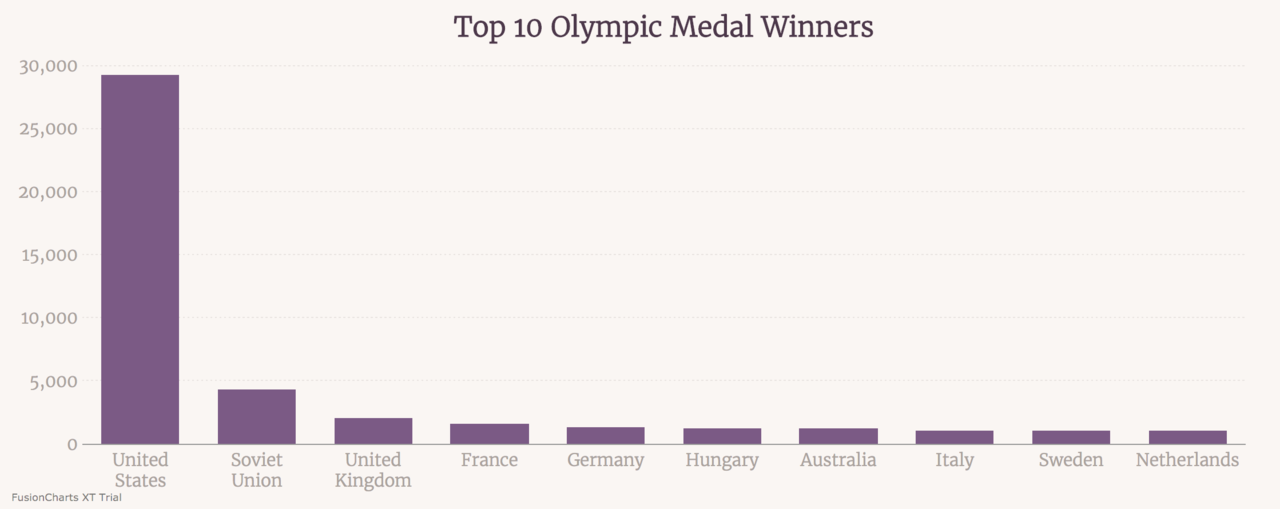
Below is the six-step process that I will be following to create above chart:
Including dependencies.
Establishing and validating the database connection.
Fetching data via SQL query.
Forming the JSON chart data array.
Creating the chart container.
Creating a chart instance and closing the database connection.
Step 1: Including Dependencies
To render charts in PHP, we need to include two dependencies, as listed below:
FusionCharts PHP Wrapper (download it here). It will be included in the PHP code.
FusionCharts core package JS files (download them here). It will be included in the HTML code using the
<script>tag.
Including the FusionCharts PHP Wrapper
Given below is the code to include the FusionCharts PHP Wrapper (fusioncharts.php) in the PHP code:
<?php
   // including FusionCharts PHP wrapper
   include("path/to/fusioncharts.php");
?>
Including the FusionCharts Core Package JS Files
Given below is the code to include the FusionCharts core package JS files (fusioncharts.js and fusioncharts.charts.js) in the HTML code:
<html>
  <head>
    <!-- including FusionCharts core package JS files -->
    <script src="path/to/fusioncharts.js"></script>
    <script src="path/to/fusioncharts.charts.js"></script>
  </head>
</html>
Step 2: Establishing and Validating the Database Connection
Once all the dependencies have been included in the code, we need to establish the connection with our PostgreSQL database to fetch data for the chart.
Given below is the PHP code for establishing a connection with the database:
<?php

    // establishing DB connection
    $host = "host=localhost";
    $port = "port=5432";
    $dbname = "dbname=databasename";
    $dbuser = "user=databaseuser";
    $dbpwd = "password=dbuserpassword";

    // connection string
    // pg_connect() is native PHP function for PostgreSQL
    $dbconn = pg_connect("$host $port $dbname $dbuser $dbpwd");

    // validating DB connection
    if(!$dbconn) {
    exit("There was an error establishing database connection");
    }

?>
You need to replace values for the variables $host, $port, $dbname, $dbuser, and $dbpwd used in the above code with the actual values for your Postgres database and database host server. The $dbconn variable is used to establish the connection with the database. If there is a problem while establishing the connection, the above code will throw an error message.
Note: To use PostgreSQL in PHP, please make sure you have enabled the necessary extensions by including extension=php_pdo_pgsql.dll and extension=php_pgsql.dll in your php.ini configuration file.
Tip: You can also create a separate .php file for the above step and include it using the include() PHP function (like we included the FusionCharts PHP wrapper above), instead of writing it every time.
Step 3: Fetching Data via SQL Query
Now that we have established the connection to our Postgres database, we will write the SQL query to fetch data for our chart.
The query is shown below:
$result = ($dbconn, "SELECT country_name, medals FROM top_medals;"); or exit("Error - Querying Database");After the above code is executed successfully, the $result variable will hold the data fetched from the database. This data will be used to form the JSON array for the chart data, as shown in the next step.
Step 4: Forming the JSON Chart Data Array
FusionCharts understands both XML and JSON data formats. Since we will be using JSON, we will now append the data (fetched from database in the $result variable) along with FusionCharts chart configuration and parse the end result as an associative JSON array.
Given below the is code needed to append the chart data fetched from the database:
if ($result) {

  // creating an associative array to store the chart attributes
  $arrData = array(
    "chart" => array(
            // caption and sub-caption customization
            "caption"=> "Top 10 Olympic Medal Winners",
            "captionFontSize"=> "24",
            "captionFontColor"=> "#4D394B",
            "captionPadding"=> "20",

            // font and text size customization
            "baseFont"=> "Merriweather, sans-serif",
            "baseFontColor"=> "#ABA39D",
            "outCnvBaseColor"=> "#ABA39D",
            "baseFontSize"=> "15",
            "outCnvBaseFontSize"=> "15",

            // div line customization
            "divLineColor"=> "#ABA39D",
            "divLineAlpha"=> "22",
            "numDivLines"=> "5",

            // y-axis scale customization
            "yAxisMinValue"=> "0",
            "yAxisMaxValue"=> "30000",

            // tool-tip customization
            "toolTipBorderColor"=> "#ABA8B7",
            "toolTipBgColor"=> "#F5F3F1",
            "toolTipPadding"=> "13",
            "toolTipAlpha"=> "50",
            "toolTipBorderThickness"=> "2",
            "toolTipBorderAlpha"=> "30",
            "toolTipColor"=> "#4D394B",
            "plotToolText"=> "<div style='text-align: center; line-height: 1.5;'>\$label<br>\$value Medals<div>",


            // other customizations
            "theme"=> "fint",
            "paletteColors"=> "#7B5A85",
            "showBorder"=> "0",
            "bgColor"=> "#FAF6F3",
            "canvasBgColor"=> "#FAF6F3",
            "bgAlpha"=> "100",
            "showValues"=> "0",
            "formatNumberScale"=> "0",
            "plotSpacePercent"=> "33",
            "showcanvasborder"=> "0",
            "showPlotBorder"=> "0"
    )
  );

    $arrData["data"] = array();
    // iterating over each data and pushing it into $arrData array
    while($row = pg_fetch_array($result)) {
        array_push($arrData["data"], array(
            "label" => $row["country_name"],
            "value" => $row["medals"]
            )
        );
    }

  $jsonEncodedData = json_encode($arrData);

}
In this code, we are first using the if statement to ensure that the value of the $result variable is valid. If it is valid, then we create an associative JSON array to form data for the chart. Thechart object under the $arrData variable contains the chart configuration options like caption, sub-caption, background color, font, display format for values, data plot color and so on.
Tip: To know more about customizing a chart's look and feel, you can refer to this developer documentation page.
The data object contains the data for the chart to be rendered; this data is pushed into the associative array created using the $result variable. Finally, $arrData —the associative array created—is encoded into JSON using the json_encode PHP function. The result is stored in the $jsonEncodedData variable.
Tip: You can echo the resultant JSON data array ($jsonEncodedData) to check if the array has been formed correctly, according to the FusionCharts data format.
Step 5: Creating the Chart Container
Every chart displayed on a web page is rendered within a unique HTML container. We will be using the <div> element for creating the HTML container for our chart.
Given below is the code for creating the chart container:
<body>
    <!-- chart container -->
 <div id="postgres-chart">A beautiful chart is on its way!</div>
</body>
Step 6: Creating Chart Instance and Closing the Database Connection
Now that we have the JSON data and the chart container in place, we will create the FusionCharts instance. Details needed to render the chart, like the chart type, chart ID, chart dimensions, the HTML container ID, and so on, will be passed to this chart instance.
The format used to create the chart instance is shown below:
// syntax to create the chart instance
$chartVar = new FusionCharts("type of chart", "unique chart ID", "chart width", "chart height", "HTML container ID", "data format (JSON/XML)", "chart data");
Given below is the actual code used to create the FusionCharts instance:
// chart instance
$postgresChart = new FusionCharts("column2d", "topMedalChart" , '100%', 450, "postgres-chart", "json", $jsonEncodedData);
Now we will call the render() method and close connection to the database.
The render() method is a PHP Class function that invokes the JavaScript render() method, which in turn is used to render the chart.
Given below is the code used to call the render() method and close the database connection:
// calling render method
$postgresChart->render();

// closing DB connection
pg_close($dbconn);
If you have followed the above steps, then you must have a working chart with you now. If you are having trouble rendering the chart, you can download the source code from this GitHub repo.
Got questions? Leave a comment or feel free to say hi on Twitter!
Opinions expressed by DZone contributors are their own.
Comments