Dates in Pandas Cheatsheet
Check out a large collection of not-so-sloppy snippets for doing scientific computing and data visualization in Python with pandas.
Join the DZone community and get the full member experience.
Join For FreeLately, I've been working a lot with dates in Pandas, so I decided to make this little cheatsheet with the commands I use the most.
Importing a CSV using a custom function to parse dates:
import pandas as pd

def parse_month(month):
    """
    Converts a string from the format M in datetime format.
    Example: parse_month("2007M02") returns datetime(2007, 2, 1)
    """
    return pd.datetime(int(month[:4]), int(month[-2:]), 1)

temperature = pd.read_csv('TempUSA.csv', parse_dates=['Date'],
                          date_parser=parse_month,
                          index_col=['Date'], # will become an index
                          # use a subset of the columns
                          usecols=['Date',
                                   'LosAngelesMax', 'LosAngelesMin'])
print temperature
LosAngelesMax LosAngelesMin
Date
2000-01-01 19.6 10.0
2000-02-01 18.9 10.1
2000-03-01 18.6 10.1
2000-04-01 20.2 12.5
2000-05-01 21.9 14.2Format the dates in a chart:
import matplotlib.pyplot as plt
import matplotlib.dates as mdates
plt.plot(temperature['LosAngelesMax'])
plt.gca().xaxis.set_major_formatter(mdates.DateFormatter('%Y-%m'))
plt.show()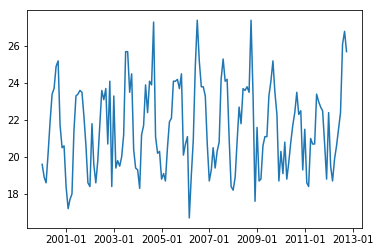
Here's the reference of the date format directives. ISO compliant format: %Y-%m-%dT%H:%M:%S.
Group the DataFrame by month:
print temperature.groupby([temperature.index.month]).mean() LosAngelesMax LosAngelesMin
Date
1 20.092308 8.992308
2 19.223077 9.276923
3 19.253846 10.492308
4 19.992308 11.461538
5 21.076923 13.761538
6 22.123077 15.800000
7 23.892308 17.315385
8 24.246154 17.530769
9 24.384615 16.846154
10 23.330769 14.630769
11 21.950000 11.241667
12 19.241667 8.683333The resulting DataFrame is indexed by month.
Merging two DataFrames indexed with timestamps that don't match exactly:
date_range_a = pd.date_range('2007-01-01 01:00',
                            '2007-01-01 3:00', freq='1h')
date_range_b = date_range_a + pd.Timedelta(10, 'm')
df_a = pd.DataFrame(np.arange(len(date_range_a)),
                    columns=['a'], index=date_range_a)
df_b = pd.DataFrame(['x', 'y', 'z'],
                    columns=['b'], index=date_range_b)

print 'left DataFrame'
print df_a
print '\nright DataFrame'
print df_b
print '\nmerge_AsOf result'
print pd.merge_asof(df_a, df_b, direction='nearest',
                    left_index=True, right_index=True)
left DataFrame
a
2007-01-01 01:00:00 0
2007-01-01 02:00:00 1
2007-01-01 03:00:00 2
right DataFrame
b
2007-01-01 01:10:00 x
2007-01-01 02:10:00 y
2007-01-01 03:10:00 z
merge_AsOf result
a b
2007-01-01 01:00:00 0 x
2007-01-01 02:00:00 1 y
2007-01-01 03:00:00 2 zThe DataFrames have been aligned according to the index on the left.
Aligning two DataFrames:
aligned = df_a.align(df_b)

print 'left aligned'
print aligned[0]
print '\nright aligned'
print aligned[1]
print '\ncombination'
aligned[0]['b'] = aligned[1]['b']
print aligned[0]
left aligned
a b
2007-01-01 01:00:00 0.0 NaN
2007-01-01 01:10:00 NaN NaN
2007-01-01 02:00:00 1.0 NaN
2007-01-01 02:10:00 NaN NaN
2007-01-01 03:00:00 2.0 NaN
2007-01-01 03:10:00 NaN NaN
right aligned
a b
2007-01-01 01:00:00 NaN NaN
2007-01-01 01:10:00 NaN x
2007-01-01 02:00:00 NaN NaN
2007-01-01 02:10:00 NaN y
2007-01-01 03:00:00 NaN NaN
2007-01-01 03:10:00 NaN z
combination
a b
2007-01-01 01:00:00 0.0 NaN
2007-01-01 01:10:00 NaN x
2007-01-01 02:00:00 1.0 NaN
2007-01-01 02:10:00 NaN y
2007-01-01 03:00:00 2.0 NaN
2007-01-01 03:10:00 NaN zThe timestamps are now aligned according to both the DataFrames and unknown values have been filled with NaNs. The missing value can be filled with interpolation when working with numeric values:
print aligned[0].a.interpolate() 2007-01-01 01:00:00 0.0
2007-01-01 01:10:00 0.5
2007-01-01 02:00:00 1.0
2007-01-01 02:10:00 1.5
2007-01-01 03:00:00 2.0
2007-01-01 03:10:00 2.0
Name: a, dtype: float64The categorical values can be filled using the fillna method:
print aligned[1].b.fillna(method='bfill') 2007-01-01 01:00:00 x
2007-01-01 01:10:00 x
2007-01-01 02:00:00 y
2007-01-01 02:10:00 y
2007-01-01 03:00:00 z
2007-01-01 03:10:00 z
Name: b, dtype: objectThe method bfill propagates the next valid observation, while ffil the last valid observation.
Convert a Timedelta in hours:
td = pd.Timestamp('2017-07-05 16:00') - pd.Timestamp('2017-07-05 12:00')
print td / pd.Timedelta(1, unit='h')
4.0 To convert in days, months, minutes, and so on, one just needs to change the unit. Here are the values accepted: D, h, m, s, ms, us, ns.
Convert pandas timestamps in Unix timestamps:
unix_ts = pd.date_range('2017-01-01 1:00',
                        '2017-01-01 2:00',
                        freq='30min').astype(np.int64) // 10**9
print unix_ts
Int64Index([1483232400, 1483234200, 1483236000], dtype='int64') To convert in milliseconds, divide by 10**6 instead of 10**9.
Convert Unix timestamps in pandas timestamps:
print pd.to_datetime(unix_ts, unit='s') DatetimeIndex(['2017-01-01 01:00:00', '2017-01-01 01:30:00',
'2017-01-01 02:00:00'],
dtype='datetime64[ns]', freq=None)To convert from timestamps in milliseconds, change the unit to ms.
Published at DZone with permission of Giuseppe Vettigli. See the original article here.
Opinions expressed by DZone contributors are their own.
Comments