Enabling Business Transaction Monitoring for App Connect Enterprise
This tutorial serves as a guide to setting up Business Transaction Monitoring for IBM's App Connect Enterprise.
Join the DZone community and get the full member experience.
Join For FreeIntroduction
IBM App Connect V12 introduced a new capability called Business Transaction Monitoring (BTM) which allows the user to record a message throughout its lifecycle and determine its outcome.
What Is Transaction Monitoring?
Transaction monitoring involves surveying each message that passes through your flows and ruling whether it was transmitted successfully or had failed to reach the destination. Monitoring each transaction through an integration ensures that developers are notified when a system fails, and output has not been received. However, simply monitoring if a message has reached its destination does not help identify the specific problem, which is where Business Transaction Monitoring can help.
How Business Transaction Monitoring Can Help
Monitoring integrations is crucial to maintain each integration's performance and to report when an issue has occurred, but it can often be frustrating due to obscure and broad error messages that do not pinpoint exactly what has gone wrong during the transaction. These issues can be resolved when using App Connect v12's Business Transaction Monitoring, which allows users to add different event triggers across message flows, each providing a signal reporting when a message has successfully reached a point in the flow, or that there has been an issue. This feature accurately depicts which aspects of your business transaction are running smoothly and which are failing.
There are four different types of monitoring events: start, end, failure, and progress.
- Start business transaction events are attributed to nodes at the beginning of a transaction.
- End business transaction events are attributed to nodes at the end of a transaction.
- Failure business transaction events are attributed to nodes that are reached when a failure has occurred within the flow.
- Progress business transaction events are attributed to any nodes within the flow that you may want to monitor messages reaching.
With these events placed throughout a transaction, App Connect can display each message's journey as In Progress, Complete, or Failed.
Before You Begin
Before setting up Business Transaction Monitoring, you will need to have prepared the following:
You will also need a functioning message flow that you wish to monitor.
Contents
- Add Events to your flow.
- Create an integration node and the servers, and deploy the flow to the server.
- Edit the server.conf.yaml and node.conf.yaml files to configure the servers for BTM.
- Create the database and connect via an ODBC connection.
- Check that SYSTEM.BROKER.DC.BACKOUT and SYSTEM.BROKER.DC.RECORD have been created through the queue manager. They’re created using the iib_createqueues script.
- Open the web UI and create the BTM definition using the events.
1. Adding the Events to Your Flow
To begin configuring Business Transaction Monitoring, monitoring events need to be added to the parts of the flow that you would like to monitor.
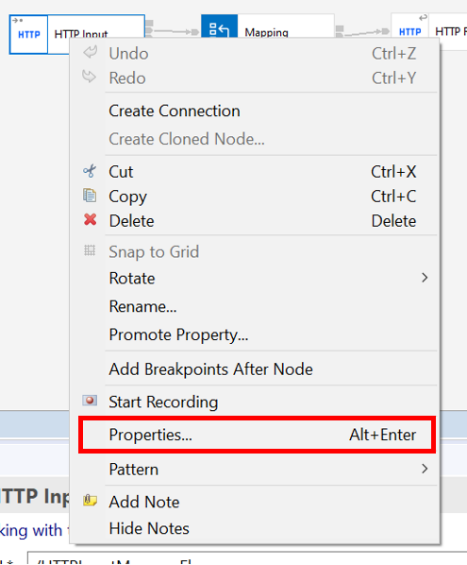
Right-click a node that you wish to add an event to and click Properties:
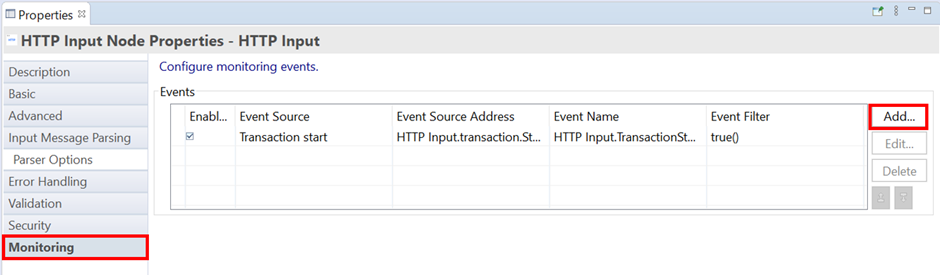
In the Properties tab, select Monitoring and then click Add to add a new event.
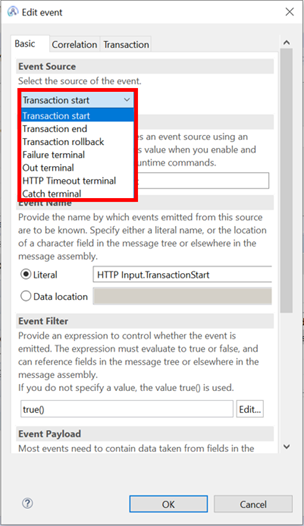
When creating an event, the event source tab determines what type of event you are defining.
To set up BTM, you will need at least a Transaction start event and a Transaction end event, so add these to the first and last nodes in your flow.
2. Creating the Integration Node and Servers
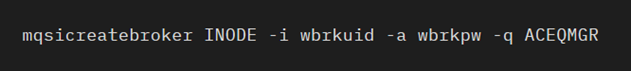
In the ACE command prompt, use the mqsicreatebroker command to create the integration node.
For example, for your integration node to be called INODE with the username wbrkuid and password wbrkpw, you would run the following command:
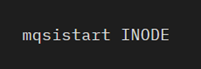
You can then use the mqsistart command to start the integration node.
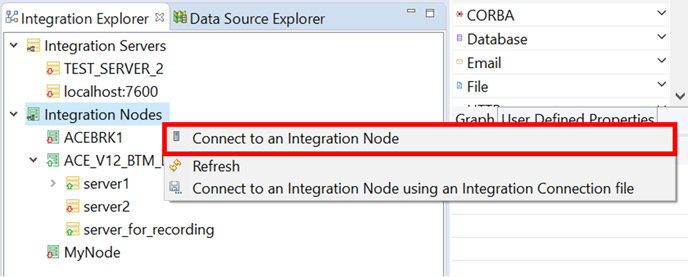
To connect to this Integration Node in ACE, right-click the Integration Nodes in the Integration explorer and click Connect to an Integration Node.
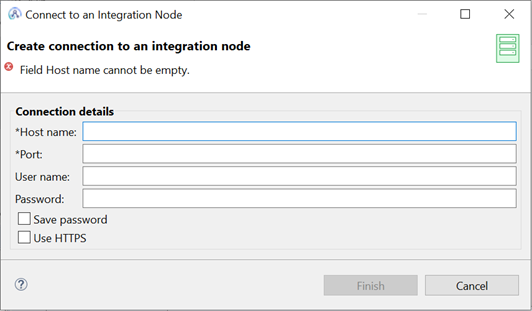
A window will open where you can fill the Connection Details with the information of the Integration Node to add the connection to ACE.
The mandatory values are:
- The Hostname/IP address of the machine the INODE is running on
- The Port used by the administration REST API; this property must be a valid positive number
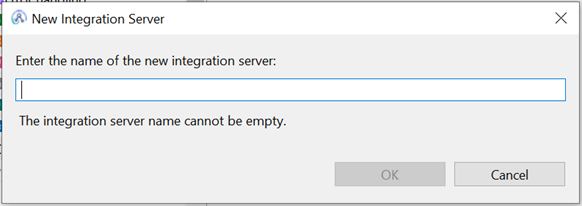
To create the integration servers required, right-click the integration node and click New Integration Server.
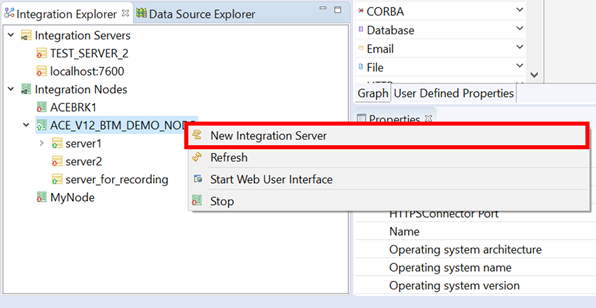
You need to give a unique name for the servers created.
To begin Business Transaction Monitoring, you will need at least one server to run the flow and one server to record the data. Therefore you could name the server for recording ‘server_for_recording’ to make them easier to differentiate.
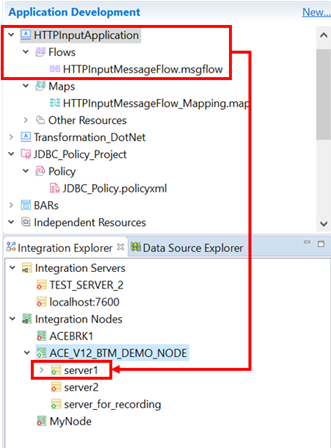
Drag the application containing the flow onto the server created to run the flow. In this case it’s "server1."
This will deploy the application onto the server.
3. Editing the server.conf.yaml Files
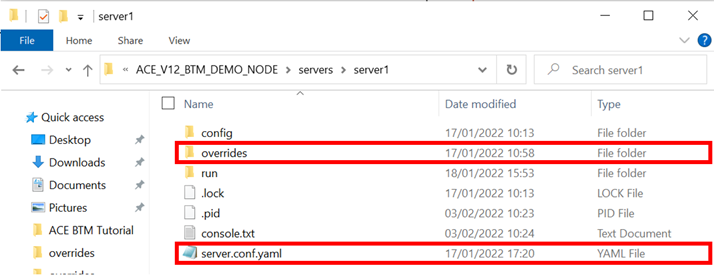
The folders for the servers created are in this directory: C:\ProgramData\IBM\MQSI\components\ACE_V12_BTM_DEMO_NODE\servers
In each server folder, there is a server.conf.yaml file and an overrides file.
The server.conf.yaml file contains the configuration of the server and can be altered with a text editor to change the server’s configuration.
Settings can also be altered by editing the server.conf.yaml file in the overrides file, with the server specifications in that folder overriding the primary server.conf.yaml file.
To enable Business Transaction Monitoring, the server.conf.yaml files of the servers need to be altered.
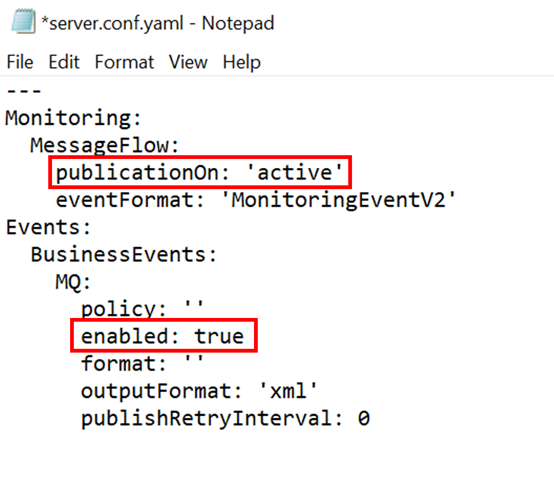
For servers that are running the flow, the options that must be changed are:
publicationOnbeing set to‘active’inMonitoring > MessageFlowenabledbeing set to‘true’inEvents > BusinessEvents > MQ
Below shows my override server.conf.yaml file for "server1":
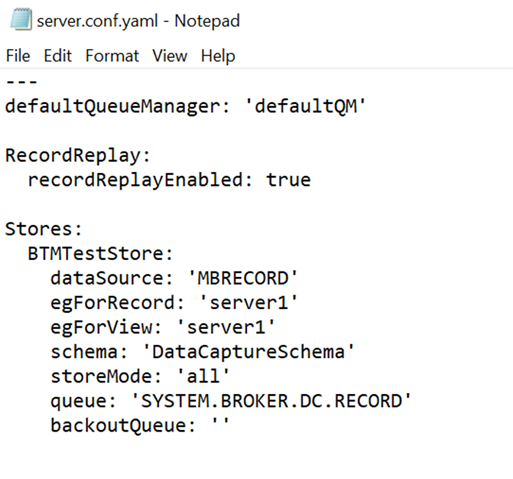
When altering the server.conf.yaml of the server created for recording the data, the changes that need to be made are:
- Adding a
defaultQueueManagervalue such asdefaultQM - Changing
recordReplayEnabledtotrue - Adding a store under the Stores section
Below shows my override server.conf.yaml file for "server_for_recording":
4. Creating and Connecting a Database
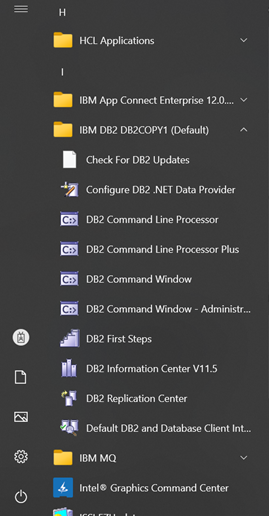
Open the db2 command window from the start menu.
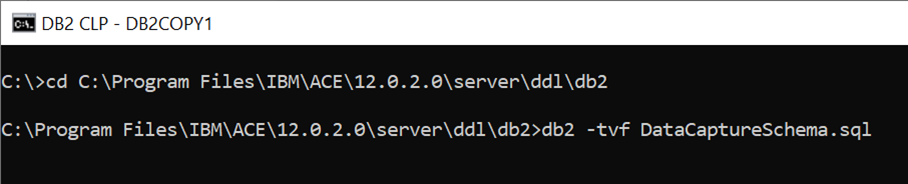
As shown, navigate to the file location where the default database schemas are stored in using the cd command. Then run the db2 –tvf DataCaptureSchema.sql command to create a database using the data capture schema.
Next, we will need to establish an ODBC connection to the database. On Windows, we will need to go to Start > Control Panel > Administrative Tools.
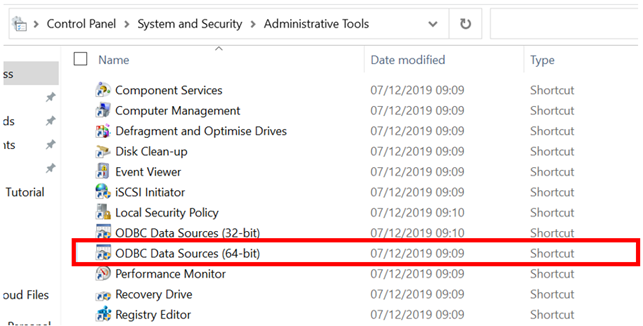
Then open the ODBC Data Sources (64-bit) window.
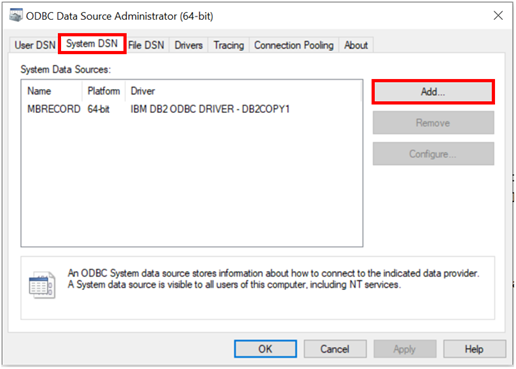
- Click the System DSN section and click "Add…"
- Select the driver IBM DB2 ODBC DRIVER.
- Enter the data source name (DSN): I chose ‘MBRECORD.’
- Select the database alias (DBALIAS) from the list.
- Click Finish to save your definition.
- Click OK to close the window.
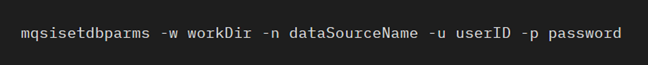
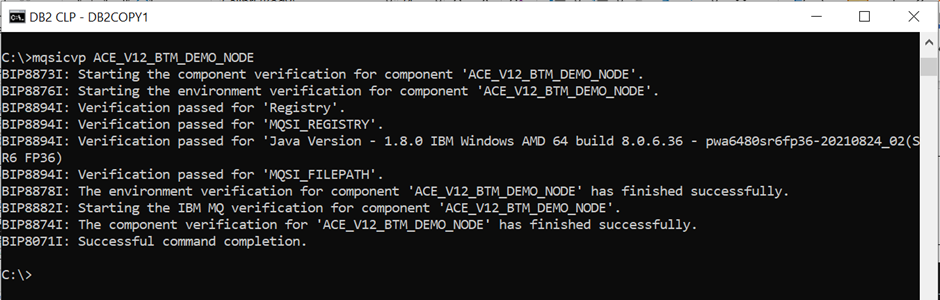
Finally, a userID and password can be established to use to access the database using the mqsisetdbparms command.
The workDir value should be the work directory of the integration server, e.g: C:\ProgramData\IBM\MQSI\components\ACE_V12_BTM_DEMO_NODE
You can then use the mqsicvp command to test your connection to the database, as so:
5. Creating the Default System Queues
Use the cd command to change the directory of the cmd prompt to the wmq folder: cd install_dir\server\sample\wmq.
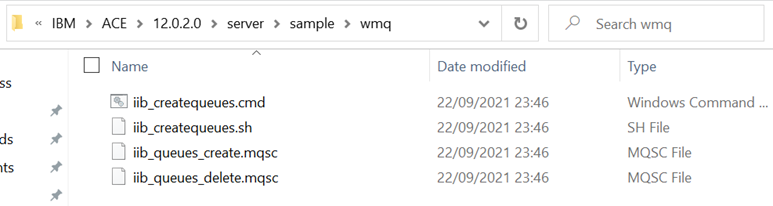
Then you can run iib_createqueues.cmd followed by the Queue Manager’s name to install the default queues to the specified queue manager.
iib_createqueues.cmd qmgr_name
6. Open the Web UI and Create the BTM Definition
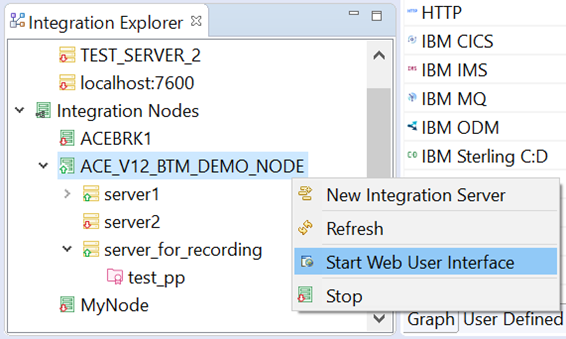
Within ACE Toolkit, right-click the node that the servers are running on and select Start Web User Interface.
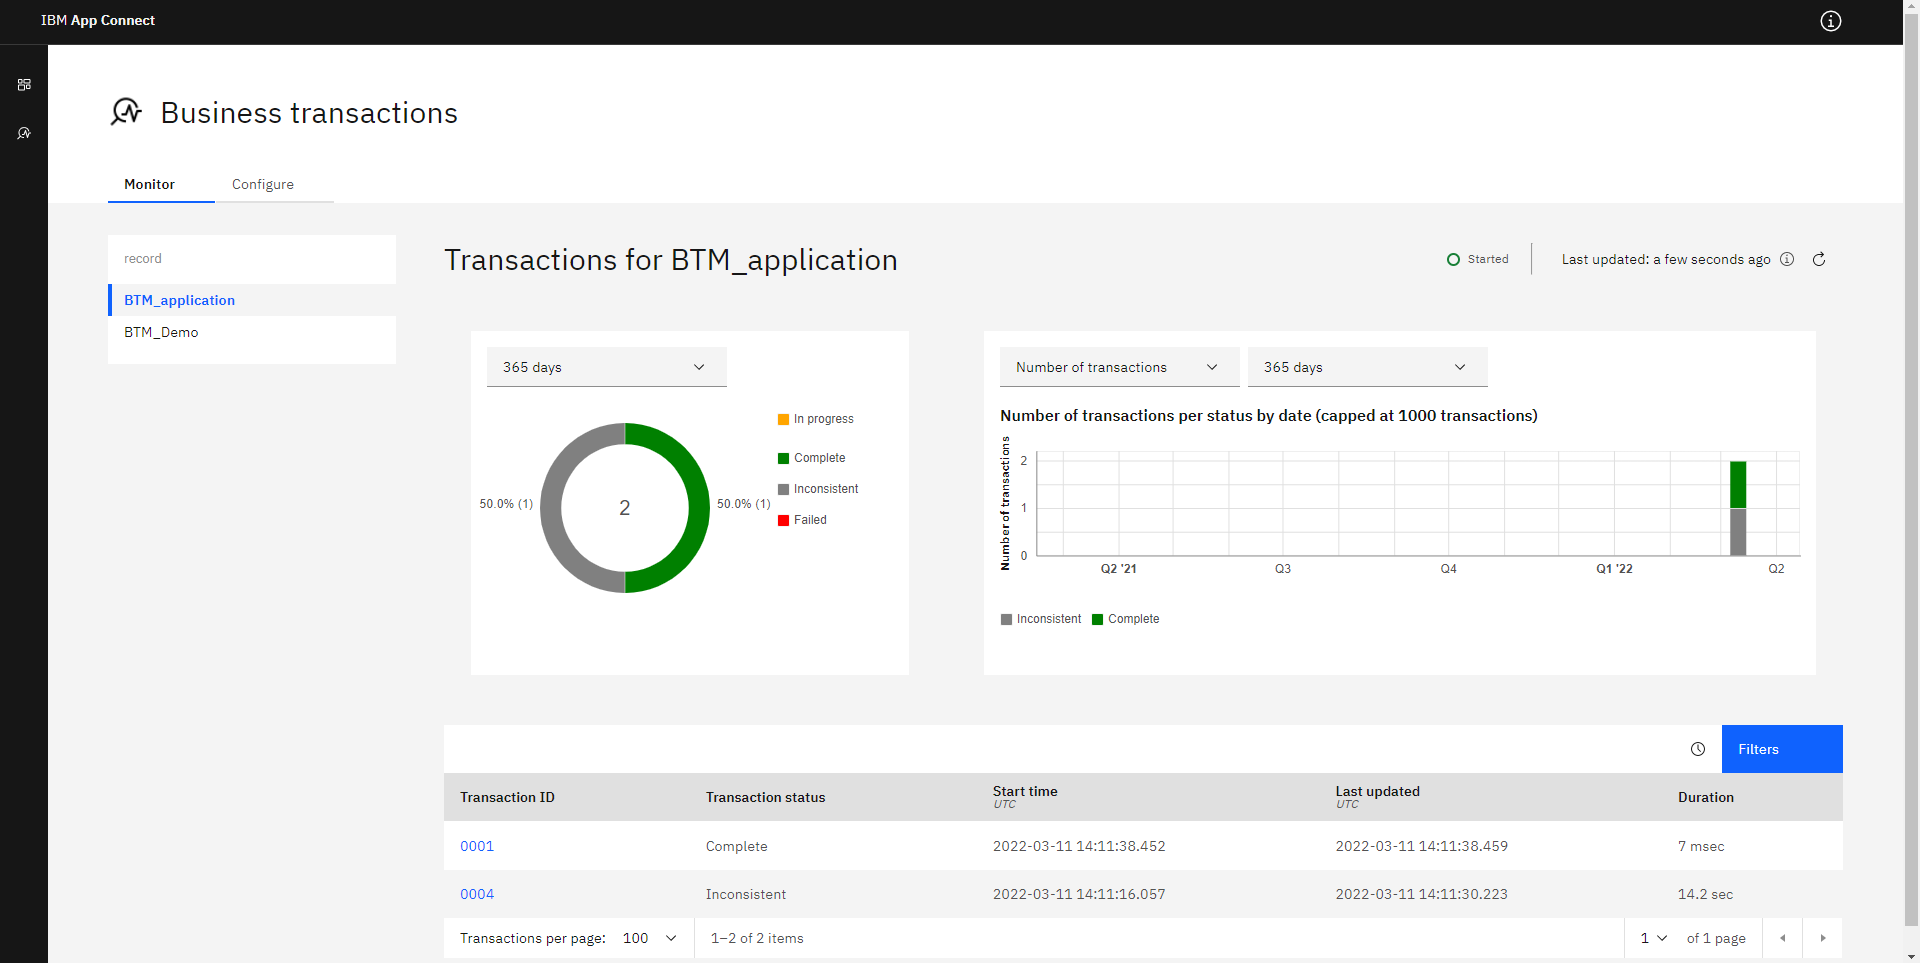
This will open a browser tab where you can access the Business Transactions information.
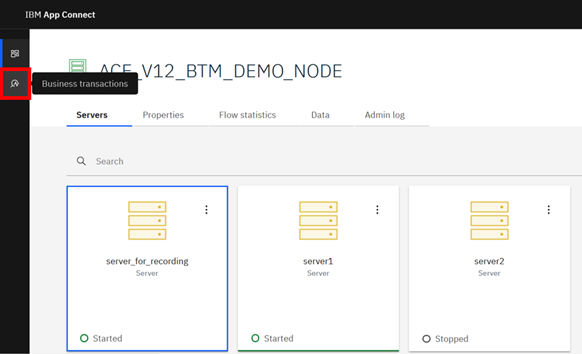
Click the Business Transactions tab on the right.
If this icon is not present, then Business Transactions has not been set up correctly.
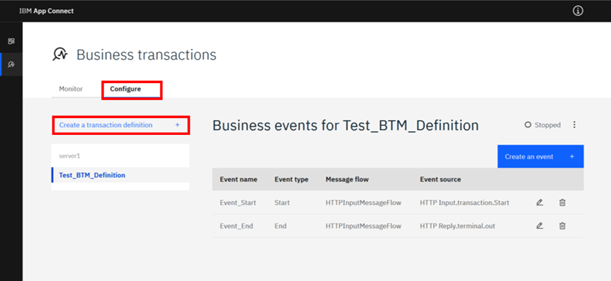
On the Business Transactions section, click the Configure tab and click Create a transaction definition.
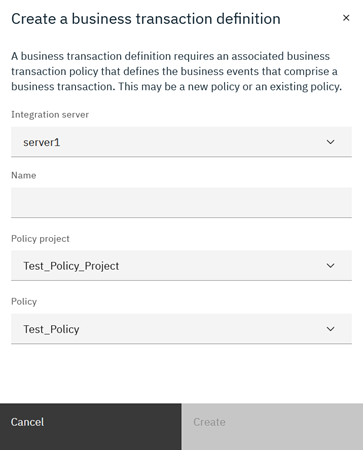
To create a Business Transaction Definition, you must:
- Choose the Integration Server that the flow is deployed on.
- Give the definition a unique Name.
- Create or choose a Policy Project for the definition.
- Create or choose a Policy for the definition.
- Click Create.
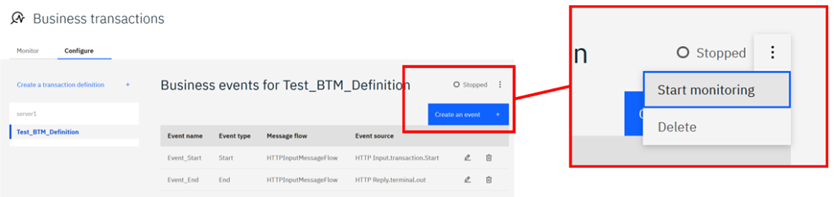
Finally, populate the definition by selecting the Create an event button and adding the events that were specified within the flow. Once an event has been added to the Start type and one of the End type, you can begin monitoring the events.
Conclusion
When you are creating a new business transaction, continuously monitoring flows to ensure they're running smoothly is just as crucial as initially testing them. IBM App Connect provides the ideal method for creating and monitoring transactions to ensure you can quickly identify issues that appear at any stage of a message's lifecycle.
Opinions expressed by DZone contributors are their own.
Comments