Toward Explainable AI (Part 7): Bridging Theory and Practice—SHAP: Bringing Clarity to Financial Decision-Making
Explainable AI bridges the gap between complex models and real-world accountability, helping teams build trust, ensure compliance, and make smarter decisions.
Join the DZone community and get the full member experience.
Join For FreeSeries reminder: This series explores how explainability in AI helps build trust, ensure accountability, and align with real-world needs, from foundational principles to practical use cases.
Previously, in Part VI: What LIME Shows, and What It Leaves Out, Strengths and limits of local explanations.
In this Part: We move to the finance sector with a new use case: using SHAP values to interpret credit approval decisions made by a gradient boosting model.
Applying SHAP to Financial Modeling: Assessing Credit Risk
Understanding SHAP
SHAP (SHapley Additive exPlanations) is an explainability method based on game theory. Its core idea is to evaluate the impact of each variable on a model’s prediction by computing the average contribution that the variable makes across different combinations of input features. In practice, SHAP considers all possible configurations of presence or absence for the variables, and measures the specific contribution each feature makes to the final prediction. The result is a kind of weighted average of each variable’s effects, enabling a fair attribution of their respective importance.
SHAP is especially useful for tree-based models such as Random Forest, XGBoost, or CatBoost, but it can also be applied to linear models or even neural networks. Among its main advantages, SHAP provides both local explanations (at the level of an individual prediction) and global ones (at the model level), while being grounded in solid theoretical foundations that ensure the consistency and fidelity of the explanations. However, this precision comes at a cost: the computations can become intensive, especially for complex models or those with a large number of features.
Explainability in Credit Scoring: Applying SHAP
To illustrate the practical value of SHAP, we selected a use case in the financial domain. We trained a machine learning model on the German Credit dataset to predict the likelihood that an individual is creditworthy or non-creditworthy. Although the model achieves good classification performance, it remains difficult for a business analyst to interpret, particularly regarding the role each variable plays in the final decision.
This is precisely where SHAP becomes relevant. The method quantifies the contribution of each variable to a specific prediction, offering a twofold perspective: a global view of the model by identifying the most influential variables across all predictions, and a local explanation at the individual level, detailing the factors that led to a given decision. This approach not only improves understanding of how the model works but also helps reduce its opacity and builds greater trust in the analysis among business stakeholders.
Data Loading and Preprocessing
We are working here with the German Credit Data dataset from the UCI Machine Learning Repository. This dataset contains information on 1,000 individuals who applied for a loan, along with a label indicating whether the credit was granted (Good Credit) or denied (Bad Credit). Each individual is described by 20 variables, including both numerical data (loan duration, credit amount, age, etc.) and categorical features (checking account status, credit history, employment status, among others).
The target variable indicates the creditworthiness of the applicant in the following format:
- 1: Good Credit (Loan Approved)
- 2: Bad Credit (Loan Denied)
To simplify the analysis, we convert the value 2 to 0, which allows us to reframe the problem as a standard binary classification task:
- 1: Good Credit
- 0: Bad Credit
This dataset provides a realistic and relevant basis for exploring the interpretability of predictive models in the context of financial risk assessment.

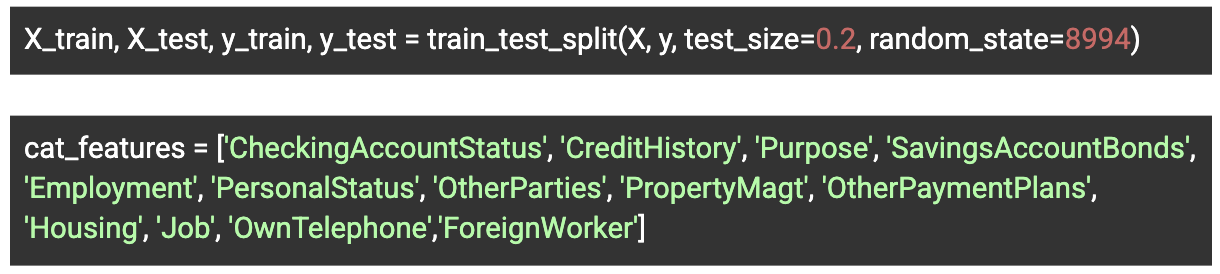
After verifying the data quality, specifically ensuring that there are no missing values and that all variables have appropriate data types, we prepare the dataset for training the CatBoost model.
One of the advantages of CatBoost is its native ability to handle categorical variables through built-in encoding, which eliminates the need for often complex manual transformations. We then split the dataset into two parts: a training set, used to fit the model, and a test set, used for a fair and rigorous evaluation of the model’s generalization performance.
Model Training and Evaluation
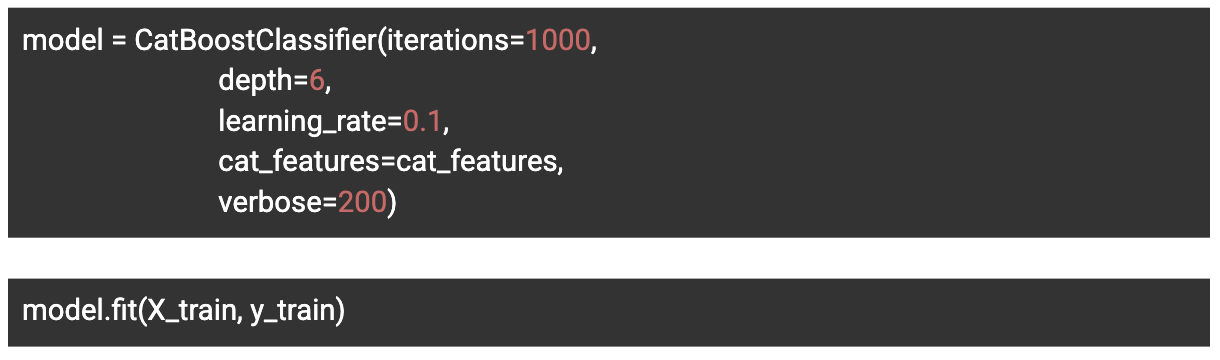
We use the CatBoost Classifier, a gradient boosting model known for its ability to efficiently handle categorical variables without requiring complex preprocessing.
During training, we define the following key hyperparameters:
- Number of iterations: 1000
- Tree depth: 6
- Learning rate: 0,1
The model is then trained on our training set.
0: learn: 0.6665587 total: 149ms remaining: 2m 28s
200: learn: 0.1500647 total: 6.49s remaining: 25.8s
400: learn: 0.0684348 total: 11.9s remaining: 17.7s
600: learn: 0.0390880 total: 17.6s remaining: 11.7s
800: learn: 0.0268218 total: 22.9s remaining: 5.69s
999: learn: 0.0202847 total: 28.2s remaining: 0us
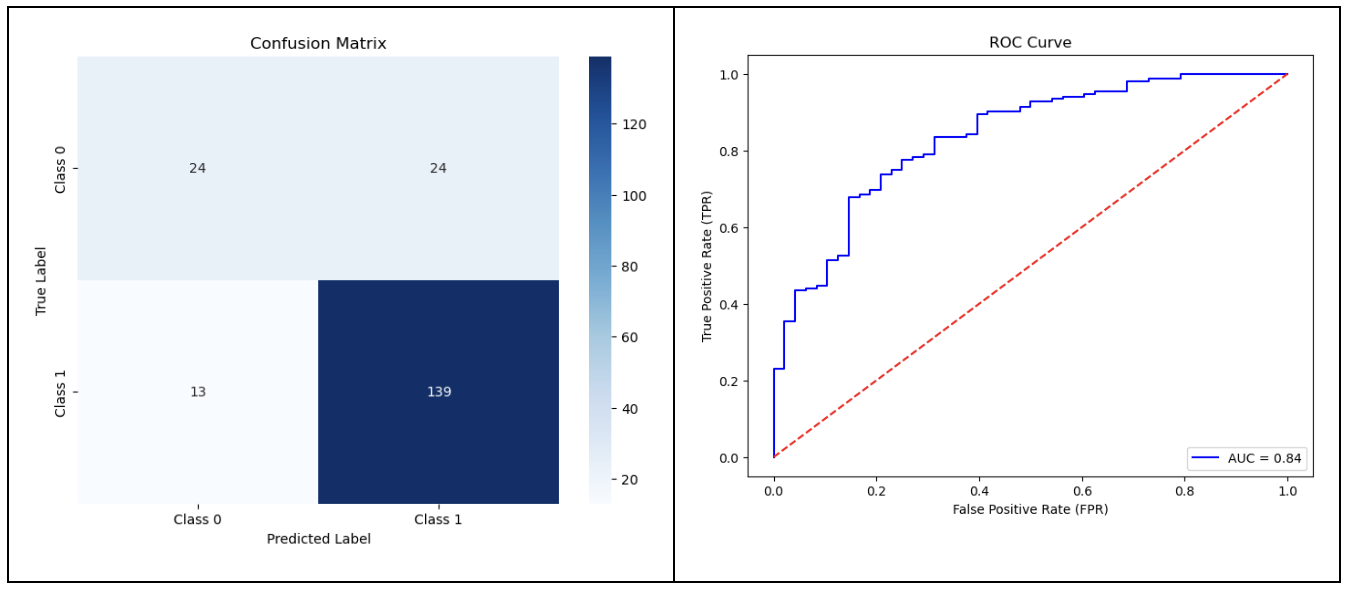
<catboost.core.CatBoostClassifier at 0x1eccdbbe730>To evaluate our model’s performance in greater detail, we rely on several standard visualizations commonly used in binary classification. We start by computing the accuracy on the test set, which reaches 81.5%, indicating solid overall performance.
Accuracy: 0.815
We then generate the confusion matrix, a valuable tool for analyzing the model’s errors in more detail. It highlights the proportion of false positives and false negatives, which are particularly important indicators in the context of credit approval.
Finally, we plot the ROC curve and compute the area under the curve (AUC) to evaluate the model’s ability to effectively distinguish between the two classes, regardless of the chosen classification threshold. A ROC curve that lies well above the diagonal and a high AUC are indicators of strong discriminative performance.
Wrap-up and what’s next: SHAP helps surface both local and global model insights, especially in risk-sensitive domains. But how stable and reliable are its results?
Next, in part VIII, we’ll critically examine the method’s limitations and potential pitfalls.
Links to the previous articles published in this series:
- Toward Explainable AI (Part I): Bridging Theory and Practice—Why AI Needs to Be Explainable
- Toward Explainable AI (Part 2): Bridging Theory and Practice—The Two Major Categories of Explainable AI Techniques
- Toward Explainable AI (Part 3): Bridging Theory and Practice—When Explaining AI Is No Longer a Choice
- Toward Explainable AI (Part 4): Bridging Theory and Practice—Beyond Explainability, What Else Is Needed
- Toward Explainable AI (Part 5): Bridging Theory and Practice—A Hands-On Introduction to LIME
- Toward Explainable AI (Part 6): Bridging Theory and Practice—What LIME Shows – and What It Leaves Out
Glossary
Algorithmic Bias: Systematic and unfair discrimination in AI outcomes caused by prejudices embedded in training data, model design, or deployment processes, which can lead to disparate impacts on certain population groups. Detecting and mitigating algorithmic bias is a key objective of explainable AI.
Bias Detection (via XAI): Use of explainability methods to identify biases or disproportionate effects in algorithmic decisions.
Contrastive and Counterfactual Explanations: Explanations that compare the decision made to what could have happened by changing certain variables (e.g., “Why this outcome instead of another?”).
Decision Plot: A graphical representation tracing the successive impact of variables on an individual prediction.
Evaluation Metrics for Explainability: Criteria used to assess the quality of an explanation (fidelity, robustness, consistency, etc.).
Feature Importance (Variable Contribution): Measurement or attribution of the relative impact of each variable on the model’s final decision.
Force Chart (Force Plot): An interactive visualization illustrating positive or negative forces exerted by each variable on a prediction.
Fidelity: A measure of how faithfully the explanation reflects the true logic of the model.
Global Explanation: An overview of the model’s behavior across the entire dataset.
Human Interpretability: The quality of an explanation to be understood and useful to a human, non-expert user.
Intrinsically Interpretable Models: Models whose very structure allows direct understanding (e.g., decision trees, linear regressions).
LIME (Local Interpretable Model-agnostic Explanations): A local explanation method that generates simple approximations around a given prediction to reveal the influential factors.
Local Explanation: A detailed explanation regarding a single prediction or individual case.
Model Transparency: The quality of a model in making its decision-making processes accessible and understandable.
Post-hoc Explainability: Explainability techniques applied after model training, without altering its internal functioning.
Robustness (Stability): The ability of an explainability method to provide consistent explanations despite small variations in input data.
SHAP (SHapley Additive exPlanations): An approach based on game theory that assigns each variable a quantitative contribution to the prediction, providing both global and local explanations.
Summary Chart (Summary Plot): A visualization ranking variables according to their average influence on predictions.
Waterfall Chart: A static visualization showing step by step how each variable contributes to the final prediction.
Links
1. LIME: [link]
2. Chest X-Ray Images (Pneumonia): [link]
3. German Credit Dataset: [link]
4. Complete notebook for the LIME case study: [link]
5. Complete notebook for the SHAP case study: [link]
6. Leslie, D., Rincón, C., Briggs, M., Perini, A., Jayadeva, S., Borda, A., et al. (2024). AI Explainability in Practice, The Alan Turing Institute, AI Ethics and Governance in Practice Programme. Participant & Facilitator Workbook: [link]
7. What is AI (Artificial Intelligence)? McKinsey & Company, avril 2024: [link]
8. Jennifer Kite-Powell. Explainable AI Is Trending And Here’s Why. Forbes, 2022. Disponible sur: [link]
9. European Commission. Excellence and Trust in AI, European Commission, 2020: [link]
10. Melissa Heikkilä (2024). Nobody really knows how AI works — and that’s a problem. MIT Technology Review: [link]
11. Heaven, W. D. (2023) - Large language models can do jaw-dropping things. But nobody knows exactly why. MIT Technology Review: [link]
12. Forbes - Jameel Francis, “Why 85% of Your AI Models May Fail”, Forbes, 15 Nov. 2024: [link]
13. A. Bao & Y. Zeng, “Understanding the dilemma of explainable artificial intelligence”, Nature - Humanities and Social Sciences Communication (2024): [link]
14. C. Gallese, The AI Act proposal: a new right to technical interpretability?, arXiv preprint, arXiv:2303.17558 [cs.CY], 2023: [link]
15. European Data Protection Board. (2024). Checklist for AI Auditing Scores – EDPB Support Pool of Experts Programme. June 2024: [link]
16. White, B., & Guha, K. (2025). Component-Based Quantum Machine Learning Explainability. arXiv preprint arXiv:2506.12378: [link]
Opinions expressed by DZone contributors are their own.
Comments