

Toward Explainable AI (Part 6): Bridging Theory and Practice—What LIME Shows – and What It Leaves Out
Explainable AI bridges the gap between complex models and real-world accountability, helping teams build trust, ensure compliance, and make smarter decisions.
 CORE
·
CORE
·
Join the DZone community and get the full member experience.
Join For FreeSeries reminder: This series explores how explainability in AI helps build trust, ensure accountability, and align with real-world needs, from foundational principles to practical use cases.
Previously, in Part V: A Hands-On Introduction to LIME: Explaining pneumonia detection step by step.
In this Part: We examine the insights LIME provides, including true/false positives and negatives, and reflect on its limits, such as stability and relevance across domains.
Understanding Model Decisions With LIME
To better understand how our model behaves, we use LIME, a method that helps identify which regions of an image most influenced the model’s prediction. In a domain as sensitive as medical diagnosis, this level of transparency is essential for detecting potential biases or failure modes in the model.
We start by extracting 200 images from the test set, along with their true labels. For each image, the model predicts the probability of pneumonia, and the predictions are then binarized using a threshold set at 0.5. This allows us to categorize the results into four groups:
- True positive (TP): A correctly detected case of pneumonia
- False positive (FP): A normal chest X-ray incorrectly classified as pneumonia
- True negative (TN): A normal chest X-ray correctly identified as such
- False negative (FN): A case of pneumonia not detected by the model
We then select a representative example from each of these categories to illustrate the quality of the explanations generated by LIME.
LIME also requires a custom prediction function capable of taking a batch of images as input and returning the associated class probabilities (pneumonia or not). The images are first resized to match the model’s expected input format, then converted into tensors to obtain the raw predictions, which are subsequently transformed into a two-column array representing the negative and positive classes, respectively.
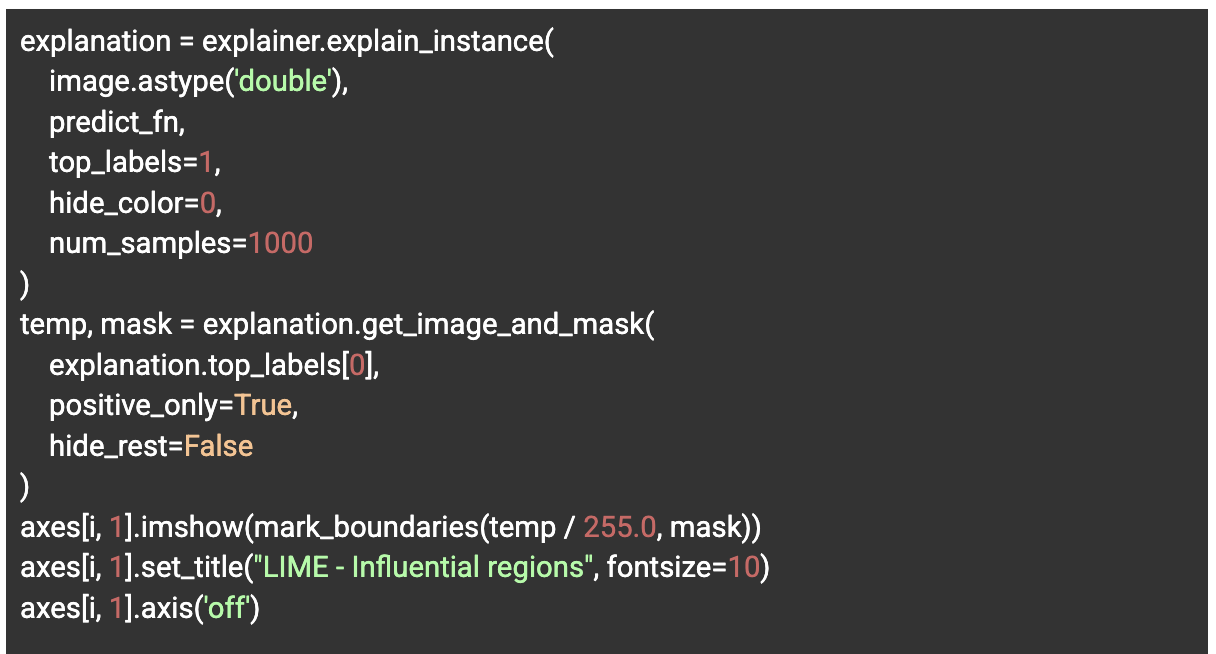
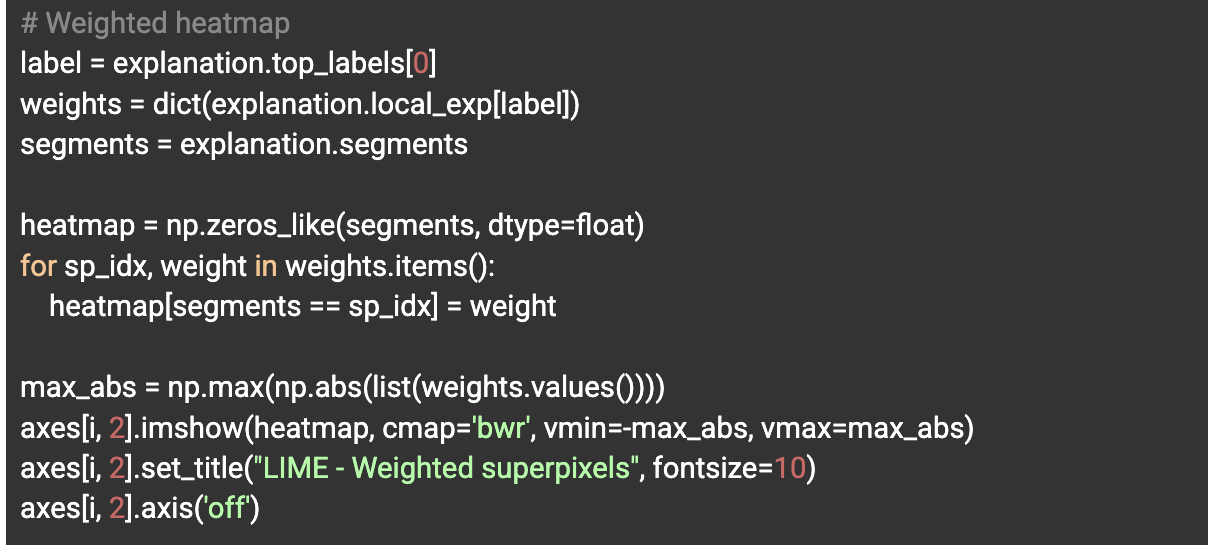
For each selected example, we then generate three complementary types of visualizations to explore the explanations produced by LIME.
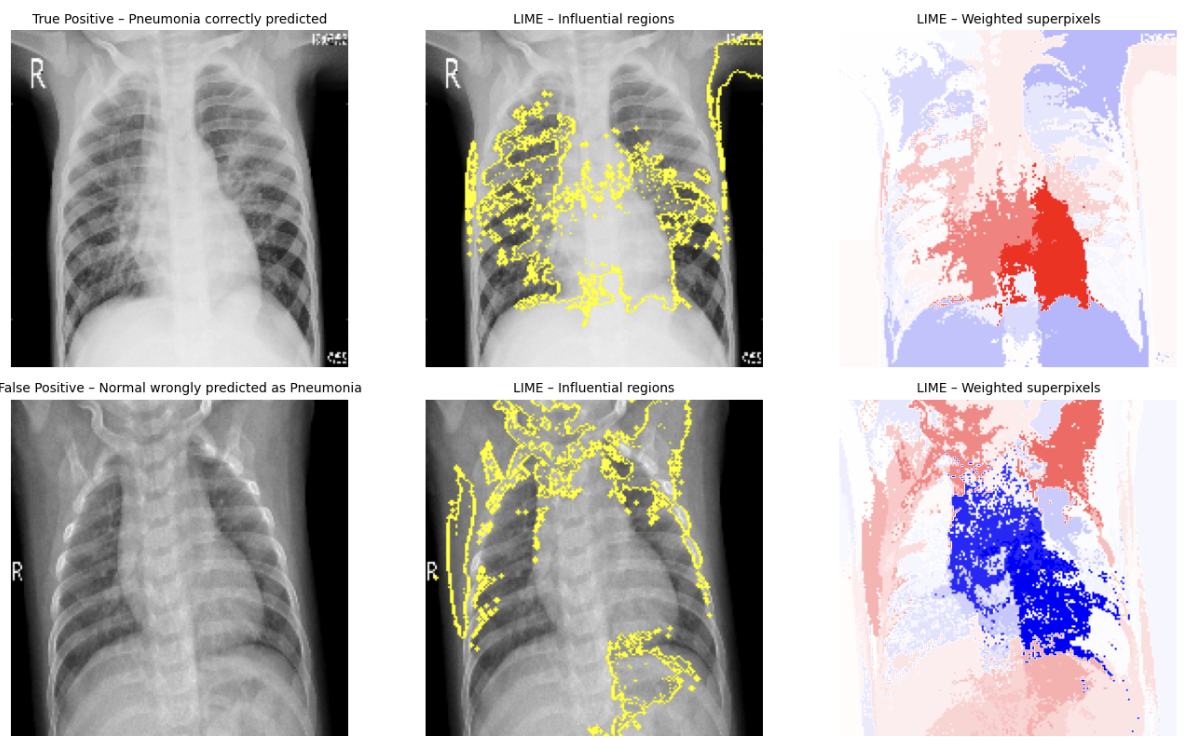
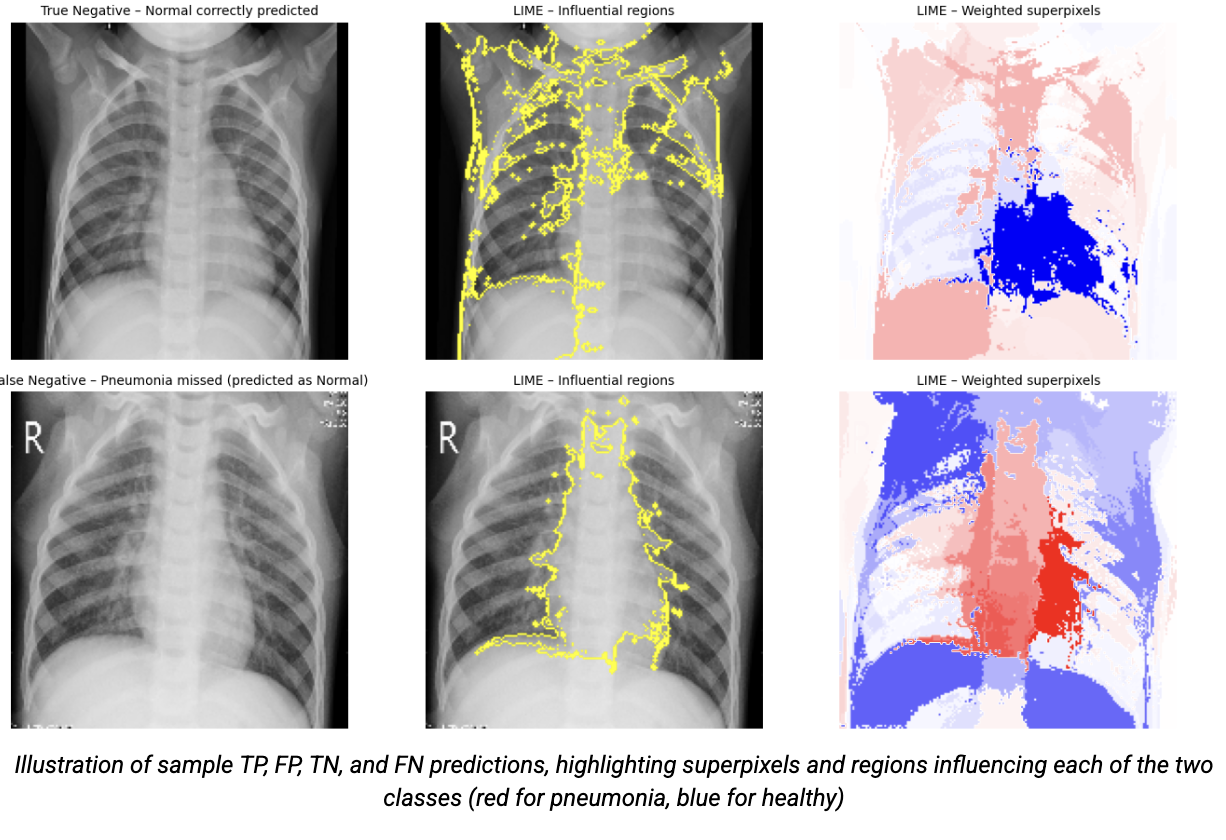
We start by displaying the original image, specifically the chest X-ray, as it is presented to the model. We then visualize the influential superpixels, meaning the regions of the image that contributed the most to the prediction. LIME segments the image into superpixels and identifies those that had a significant impact on the decision. We highlight them using segmentation contours. Finally, we generate a heatmap of the weights, where each superpixel is colored according to its influence: red indicates a positive contribution that reinforces the pneumonia prediction, while blue reflects a negative contribution. This more detailed representation helps clarify the model’s local decision-making mechanisms.
We apply this process to all four types of predictions (TP, FP, TN, FN), allowing us to compare the model’s behavior both on correct predictions and on its errors.
Key Findings and Limitations
The local explainability provided by LIME helps transform an initially opaque deep learning model into a series of more interpretable decisions, at least at the local level. This brings several concrete benefits. It facilitates bias detection by highlighting mistakenly activated regions (for example, areas outside the lungs), thereby revealing potential training biases or artifacts in the data. It also helps in understanding errors by enabling the analysis of false negatives and false positives to identify possible causes, such as blurry images, low contrast, or misinterpreted regions. Finally, it contributes to building trust, as a correct prediction supported by medically relevant areas, such as pulmonary infiltrates or opacities, can reassure clinicians about the model’s reliability.
However, evaluating the quality of the explanations generated by LIME remains a challenge. Several criteria can be considered to assess the relevance and usefulness of these explanations:
- Fidelity: This involves verifying whether the regions highlighted by LIME are indeed the ones that influence the model’s decision. To do so, one can perform deletion or insertion tests, which consist of progressively removing or adding the superpixels identified as important, to observe whether the model’s confidence decreases or increases accordingly. In addition, slight modifications to the input image should not lead to drastic changes in the explanations, which serves as a sensitivity test.
- Robustness: Similar images should produce consistent explanations. A stability test consists of checking whether visually similar X-rays highlight similar regions. In addition, a randomization test, where the trained model is replaced by a random one, should lead LIME to produce explanations that do not reflect the model’s reasoning. Otherwise, this would suggest that the method is merely reflecting characteristics of the dataset rather than the model’s actual logic.
- Human interpretability: Beyond the technical aspects, explanations must be understandable and genuinely useful to human users. A key criterion is whether a radiologist can reproduce the model’s decision based solely on the explanations provided by LIME. Finally, user studies can be conducted to assess whether the explanations improve practitioners’ trust or support their decision-making in real-world practice.
Thus, while LIME is a powerful tool for revealing the internal mechanisms of complex models, it must be accompanied by a rigorous evaluation of the quality and relevance of the explanations it generates. This requirement is fully aligned with a responsible approach to artificial intelligence in healthcare, where raw performance alone is not enough. It is essential to understand and justify every decision.
Wrap-up and what’s next: LIME is a powerful lens, but not a full picture.
Next, in part VII, we’ll explore SHAP, another popular method, and how it applies to financial risk analysis.
Links to the previous articles published in this series:
- Toward Explainable AI (Part I): Bridging Theory and Practice—Why AI Needs to Be Explainable
- Toward Explainable AI (Part 2): Bridging Theory and Practice—The Two Major Categories of Explainable AI Techniques
- Toward Explainable AI (Part 3): Bridging Theory and Practice—When Explaining AI Is No Longer a Choice
- Toward Explainable AI (Part 4): Bridging Theory and Practice—Beyond Explainability, What Else Is Needed
- Toward Explainable AI (Part 5): Bridging Theory and Practice—A Hands-On Introduction to LIME
Glossary
Algorithmic Bias: Systematic and unfair discrimination in AI outcomes caused by prejudices embedded in training data, model design, or deployment processes, which can lead to disparate impacts on certain population groups. Detecting and mitigating algorithmic bias is a key objective of explainable AI.
Bias Detection (via XAI): Use of explainability methods to identify biases or disproportionate effects in algorithmic decisions.
Contrastive and Counterfactual Explanations: Explanations that compare the decision made to what could have happened by changing certain variables (e.g., “Why this outcome instead of another?”).
Decision Plot: A graphical representation tracing the successive impact of variables on an individual prediction.
Evaluation Metrics for Explainability: Criteria used to assess the quality of an explanation (fidelity, robustness, consistency, etc.).
Feature Importance (Variable Contribution): Measurement or attribution of the relative impact of each variable on the model’s final decision.
Force Chart (Force Plot): An interactive visualization illustrating positive or negative forces exerted by each variable on a prediction.
Fidelity: A measure of how faithfully the explanation reflects the true logic of the model.
Global Explanation: An overview of the model’s behavior across the entire dataset.
Human Interpretability: The quality of an explanation to be understood and useful to a human, non-expert user.
Intrinsically Interpretable Models: Models whose very structure allows direct understanding (e.g., decision trees, linear regressions).
LIME (Local Interpretable Model-agnostic Explanations): A local explanation method that generates simple approximations around a given prediction to reveal the influential factors.
Local Explanation: A detailed explanation regarding a single prediction or individual case.
Model Transparency: The quality of a model in making its decision-making processes accessible and understandable.
Post-hoc Explainability: Explainability techniques applied after model training, without altering its internal functioning.
Robustness (Stability): The ability of an explainability method to provide consistent explanations despite small variations in input data.
SHAP (SHapley Additive exPlanations): An approach based on game theory that assigns each variable a quantitative contribution to the prediction, providing both global and local explanations.
Summary Chart (Summary Plot): A visualization ranking variables according to their average influence on predictions.
Waterfall Chart: A static visualization showing step by step how each variable contributes to the final prediction.
Links
1. LIME: [link]
2. Chest X-Ray Images (Pneumonia): [link]
3. German Credit Dataset: [link]
4. Complete notebook for the LIME case study: [link]
5. Complete notebook for the SHAP case study: [link]
6. Leslie, D., Rincón, C., Briggs, M., Perini, A., Jayadeva, S., Borda, A., et al. (2024). AI Explainability in Practice, The Alan Turing Institute, AI Ethics and Governance in Practice Programme. Participant & Facilitator Workbook: [link]
7. What is AI (Artificial Intelligence)? McKinsey & Company, April 2024: [link]
8. Jennifer Kite-Powell. Explainable AI Is Trending And Here’s Why. Forbes, 2022. Disponible sur: [link]
9. European Commission. Excellence and Trust in AI, European Commission, 2020: [link]
10. Melissa Heikkilä (2024). Nobody really knows how AI works — and that’s a problem. MIT Technology Review: [link]
11. Heaven, W. D. (2023): Large language models can do jaw-dropping things. But nobody knows exactly why. MIT Technology Review: [link]
12. Forbes - Jameel Francis, “Why 85% of Your AI Models May Fail”, Forbes, 15 Nov. 2024: [link]
13. A. Bao & Y. Zeng, “Understanding the dilemma of explainable artificial intelligence”, Nature - Humanities and Social Sciences Communication (2024): [link]
14. C. Gallese, The AI Act proposal: a new right to technical interpretability?, arXiv preprint, arXiv:2303.17558 [cs.CY], 2023: [link]
15. European Data Protection Board. (2024). Checklist for AI Auditing Scores – EDPB Support Pool of Experts Programme. June 2024: [link]
16. White, B., & Guha, K. (2025). Component-Based Quantum Machine Learning Explainability. arXiv preprint arXiv:2506.12378: [link]
Opinions expressed by DZone contributors are their own.
Comments