Front-End Debugging, Part 1: Not Just Console Log
Learn advanced techniques for debugging across the full stack, from frontend tools to system-level troubleshooting, and streamline your development.
Join the DZone community and get the full member experience.
Join For FreeAs a Java developer, most of my focus is on the back-end side of debugging. Front-end debugging poses different challenges and has sophisticated tools of its own. Unfortunately, print-based debugging has become the norm in the front end. To be fair, it makes more sense there as the cycles are different and the problem is always a single-user problem. But even if you choose to use Console.log, there’s a lot of nuance to pick up there.
Instant Debugging With the debugger Keyword
A cool, yet powerful tool in JavaScript is the debugger keyword. Instead of simply printing a stack trace, we can use this keyword to launch the debugger directly at the line of interest. That is a fantastic tool that instantly brings your attention to a bug. I often use it in my debug builds of the front end instead of just printing an error log.
How to Use It
Place the debugger keyword within your code, particularly within error-handling methods. When the code execution hits this line, it automatically pauses, allowing you to inspect the current state, step through the code, and understand what's going wrong.
Notice that while this is incredibly useful during development, we must remember to remove or conditionally exclude debugger statements in production environments. A release build should not include these calls in a production site live environment.
Triggering Debugging From the Console
Modern browsers allow you to invoke debugging directly from the console, adding an additional layer of flexibility to your debugging process.
Example
By using the debug(functionName) command in the console, you can set a breakpoint at the start of the specified function. When this function is subsequently invoked, the execution halts, sending you directly into the debugger.
function hello(name) {
    Console.log("Hello " + name)
}
debug(hello)
hello("Shai")
This is particularly useful when you want to start debugging without modifying the source code, or when you need to inspect a function that’s only defined in the global scope.
DOM Breakpoints: Monitoring DOM Changes
DOM breakpoints are an advanced feature in Chrome and Firebug (Firefox plugin) that allow you to pause execution when a specific part of the DOM is altered.
To use it, we can right-click on the desired DOM element, select “Break On,” and choose the specific mutation type you are interested in (e.g., subtree modifications, attribute changes, etc.).
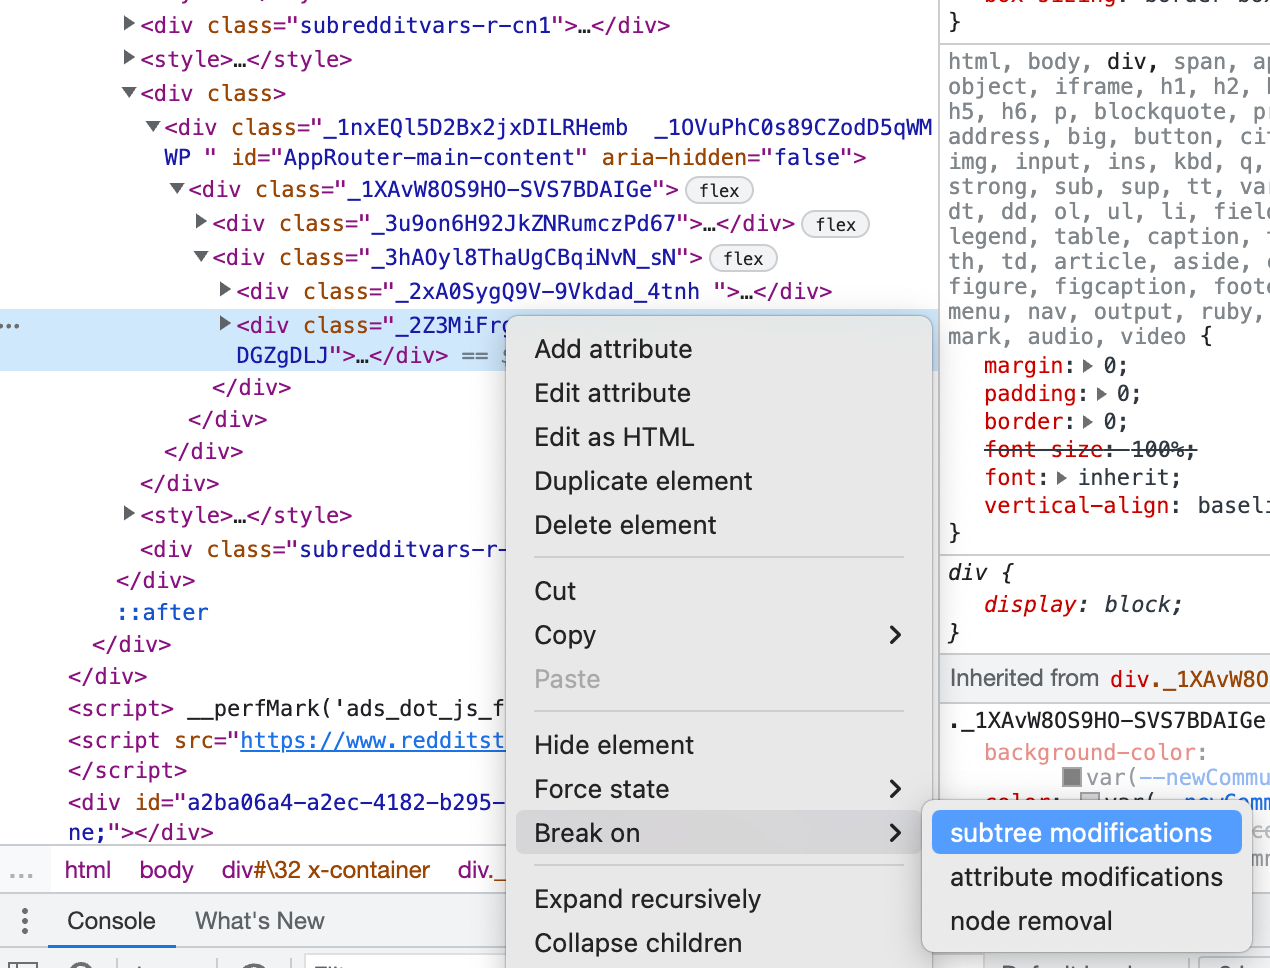
DOM breakpoints are extremely powerful for tracking down issues where DOM manipulation causes unexpected results, such as dynamic content loading or changes in the user interface that disrupt the intended layout or functionality. Think of them like the field breakpoints we discussed in the past.
These breakpoints complement traditional line and conditional breakpoints, providing a more granular approach to debugging complex front-end issues. This is a great tool to use when the DOM is manipulated by an external dependency.
XHR Breakpoints: Uncovering Hidden Network Calls
Understanding who initiates specific network requests can be challenging, especially in large applications with multiple sources contributing to a request. XHR (XMLHttpRequest) breakpoints provide a solution to this problem.
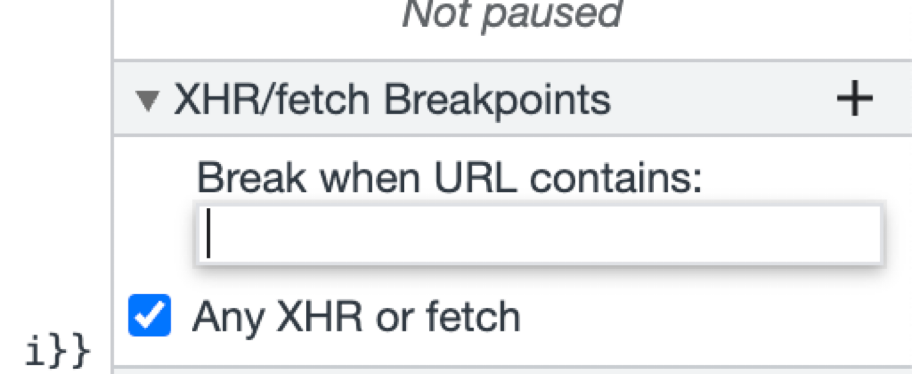
In Chrome or Firebug, set an XHR breakpoint by specifying a substring of the URI you wish to monitor. When a request matching this pattern is made, the execution stops, allowing you to investigate the source of the request.
This tool is invaluable when dealing with dynamically generated URIs or complex flows where tracking the origin of a request is not straightforward.
Notice that you should be selective with the filters you set: leaving the filter blank will cause the breakpoint to trigger on all XHR requests, which can become overwhelming.
Simulating Environments for Debugging
Sometimes, the issues you need to debug are specific to certain environments, such as mobile devices or different geographical locations. Chrome and Firefox offer several simulation tools to help you replicate these conditions on your desktop.
- Simulating user agents: Change the browser’s user agent to mimic different devices or operating systems. This can help you identify platform-specific issues or debug server-side content delivery that varies by user agent.
- Geolocation spoofing: Modify the browser’s reported location to test locale-specific features or issues. This is particularly useful for applications that deliver region-specific content or services.
- Touch and device orientation emulation: Simulate touch events or change the device orientation to see how your application responds to mobile-specific interactions. This is crucial for ensuring a seamless user experience across all devices.
These are things that are normally very difficult to reproduce; e.g., touch-related issues are often challenging to debug on the device. By simulating them on the desktop browser we can shorten the debug cycle and use the tooling available on the desktop.
Debugging Layout and Style Issues
CSS and HTML bugs can be particularly tricky, often requiring a detailed examination of how elements are rendered and styled.
Inspect Element
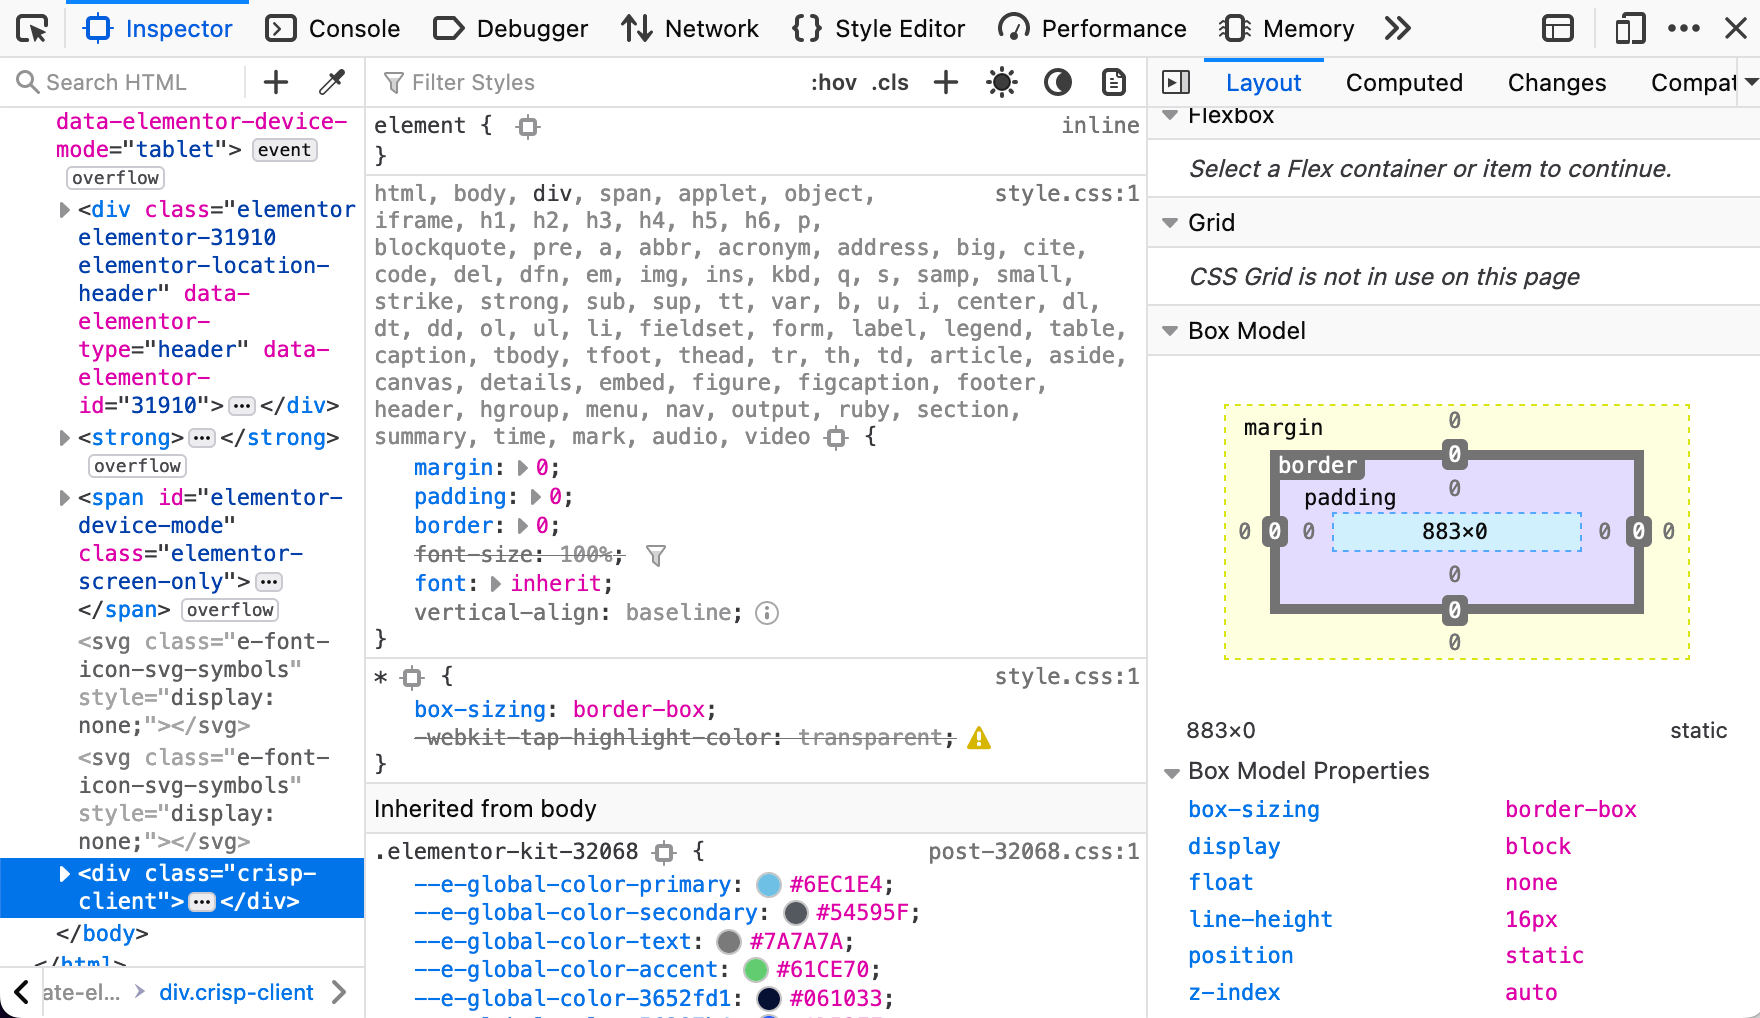
The "inspect element" tool is the cornerstone of front-end debugging, allowing you to view and manipulate the DOM and CSS in real time. As you make changes, the page updates instantly, providing immediate feedback on your tweaks.
Addressing Specificity Issues
One common problem is CSS specificity, where a more specific selector overrides the styles you intend to apply. The inspect element view highlights overridden styles, helping you identify and resolve conflicts.
Firefox vs. Chrome
While both browsers offer robust tools, they have different approaches to organizing these features. Firefox’s interface may seem more straightforward, with fewer tabs, while Chrome organizes similar tools under various tabs, which can either streamline your workflow or add complexity, depending on your preference.
Final Word
There are many front-end tools that I want to discuss in the coming posts. I hope you picked up a couple of new debugging tricks in this first part.
Front-end debugging requires a deep understanding of browser tools and JavaScript capabilities. By mastering the techniques outlined in this post — instant debugging with the debugger keyword, DOM and XHR breakpoints, environment simulation, and layout inspection — you can significantly enhance your debugging efficiency and deliver more robust, error-free web applications.
Video
Published at DZone with permission of Shai Almog. See the original article here.
Opinions expressed by DZone contributors are their own.
Comments