When Throughput Matters - Parallel GC
This post will help you understand the uses of Parallel Collector/Throughput Collector in minor and major garbage collection (GC).
Join the DZone community and get the full member experience.
Join For FreeAs I mentioned in one of the previous posts, Parallel Collector is also called Throughput Collector, because its main goal is to maximize overall throughput of the application. The two basic operations that Parallel Collector performs are Minor GC and Full GC. These are pretty straightforward.
Minor GC

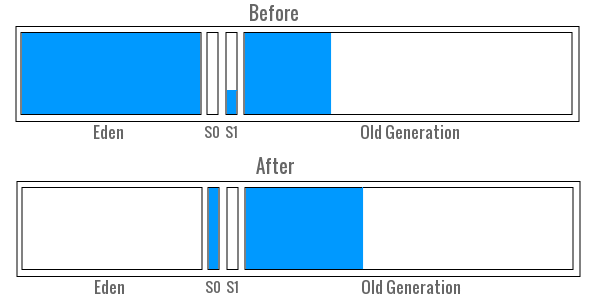
When Eden fills up, the young collection occurs. All live objects from Eden are moved to either one of the Survivor spaces (S0 here) or directly to the Tenured space of the Old Generation (only objects which cannot fit into the Survivor space). So basically, a classical mark-copy algorithm is used. Thanks to that, Eden is always compacted. As always, Minor GC causes stop-the-world (STW) pauses.
90.788: [GC (Allocation Failure)
   [PSYoungGen: 250697K->39386K(279552K)]
   831398K->623008K(978944K),
   0.0510951 secs]
   [Times: user=0.18 sys=0.01, real=0.05 secs]
In a GC log, Minor GC appears as in the output above. This particular Minor GC occurred 90.788 seconds after the application started. The size of the objects in the Young Generation has been reduced from 250697 KB to 39386 KB, which means that Eden is completely free and that 39386 KB are entirely in the Survivor space. 279552K in parentheses indicates how big Young Generation is at this point (including free space).
The third line describes how the occupancy of the entire heap has changed. Before the Minor GC, we had 831398 KB of objects, and this number has been reduced to 623008 KB whereas the entire heap is as big as 978944 KB. The last two lines describe how much time the whole operation took.
Full GC

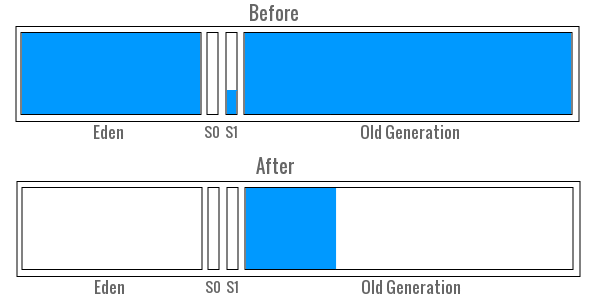
Finally, when the Old Generation fills up, a Full GC is performed. That consists of Minor and Major GC – so both the Young and Old Generations are cleaned up. As you can see on the image, not only Eden is freed up, but also both Survivor spaces. After Full GC, only live objects in Tenured space exist and the space itself is compacted. Unfortunately, Full GC causes STW pauses as well.
179.939: [Full GC (Ergonomics)
   [PSYoungGen: 116736K->115533K(232960K)]
   [ParOldGen: 699378K->699378K(699392K)]
   816114K->814912K(932352K),
   [Metaspace: 113900K->113900K(1153024K)],
   0.7331764 secs]
   [Times: user=4.23 sys=0.02, real=0.74 secs]
Full GC entry in a GC log consists of the following information:
- How the Young Generation has changed (PSYoungGen)
- How the Old Generation has changed (ParOldGen)
- How the entire heap has changed (line 4)
- How Metaspace has changed
- How much the whole operation took
Tuning
GC tuning in case of Parallel Collector is about finding a balance between the size of the entire heap and the sizes of the Young to the Old Generation.
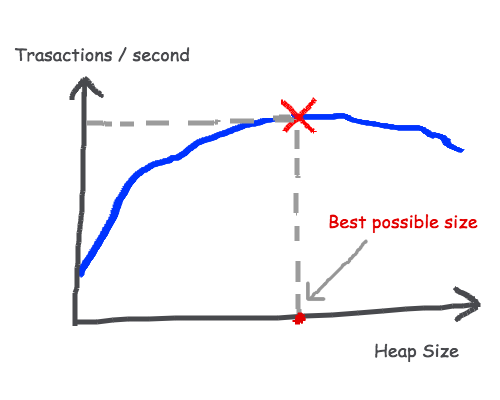
Usually bigger heap means higher throughput. When we use bigger heap, the number of GC pauses are decreased, but at the same time, bigger heap means longer pauses when the GC finally occurs. So as you can imagine, increasing the heap to the ridiculous size is not a solution. Instead, we should find the best size for the heap and for the generations. In other words, we need to find point X from this very sophisticated figure below.

We can do it on our own, or we can delegate this task to the JVM. This is where adaptive sizing comes into play. Adaptive sizing is a JVM feature which resizes the heap together with generations in order to meet some goals. These goals can be expressed with the following flags:
-XX:MaxGCPauseMillis=NN-XX:GCTimePercentage=NN
The first flag is pretty straightforward – describes the maximum STW pause caused by GC which is acceptable for us. If it’s that simple, then why don’t we set it to let’s say 1 and watch our application to be extremely responsive – even during Full GC? How does -XX:MaxGCPauseMillis=1 would affect heap size? Well, by setting it like that, we basically say that we want to have extremely tiny heap which can be entirely cleaned up (Full GC) in 1 ms. Possible? Let’s just assume that it’s theoretically possible. How small would the heap be? Of course, it depends. But even in this unrealistic example, it’s easy to imagine very frequent STW pauses caused by GC when MaxGCPauseMillis is set to something ridiculous – you’ve got tiny heap and you produce lots of garbage which needs to be cleaned up every time your heap gets full.
The GCTimePercentage flag is about is how much time you would like your application to spend in GC. Setting it to let’s say 5% means you would like your application to spend 95% of time executing application logic, and up to 5% in GC. There is also GCTimeRatio flag which is the alternative way of setting the same goal, but less intuitive in my opinion.
Published at DZone with permission of Grzegorz Mirek, DZone MVB. See the original article here.
Opinions expressed by DZone contributors are their own.

Comments