Grafana Alerting and Email Notifications
In this article, we are going to learn how to create alerts in Grafana and send these alerts over email notifications. Let's get to it!
Join the DZone community and get the full member experience.
Join For FreeUse Case: We shall be monitoring active connections on a MySQL database server and when the number of active connections crosses the threshold value then an alert shall be displayed on the dashboard and an email will be triggered on the configured email id with the snapshot of our graph indicating breach value and other information.
Environment:
- Grafana: grafana-5.1.0
- fakeSMTP-2.0: SMTP server (works with any SMTP server)
- Operating System: Windows (for others steps may vary)
Assumptions:
I assume that you already have setup and integrated Prometheus with Grafana. If not, then you can follow this article. I also assume that you have set up the monitoring for the MySQL server database. If not, then you can follow this article.
For demonstration purposes, I am using a Fake SMTP server. It can work with any valid SMTP server. If you have your dashboard ready, then let us get started by configuring our SMTP server.
So let us get started.
Setup SMTP in Grafana
- Go to "conf" directory of your Grafana distribution
- Open your configuration file (as we did the setup using defaults so I am using "defaults.ini"). Navigate to SMTP/Emailing settings and update your SMTP details. As we have our fake-SMTP server running on localhost and on port 25. My "defaults.ini" has below configurations.
#################################### SMTP / Emailing #####################
[smtp]
enabled = true
host = localhost:25
user =
# If the password contains # or ; you have to wrap it with triple quotes. Ex """#password;"""
password =
cert_file =
key_file =
skip_verify = false
from_address = [email protected]
from_name = Grafana
ehlo_identity =
Setup New Notification Channel
- Login to Grafana with username and password.
- Click on the "Bell" icon on the left sidebar.
- Select "Notification channels."
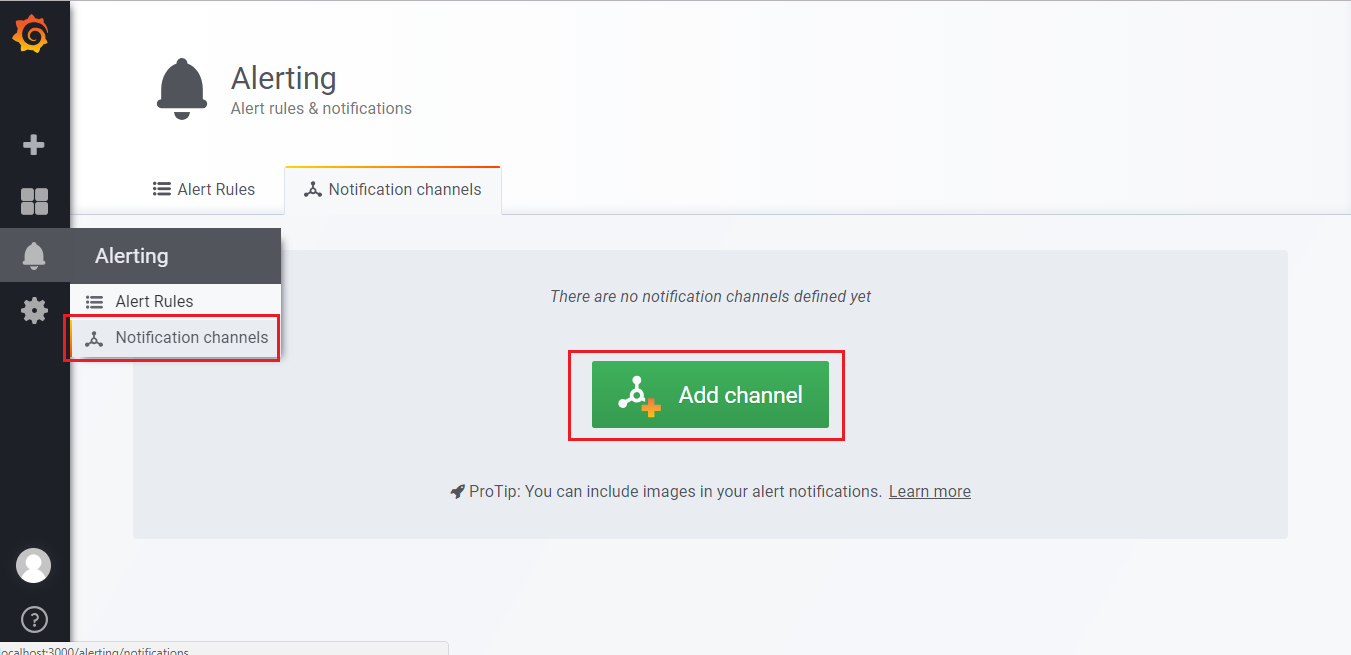
- Click on "Add Channel." This will open a form for adding new notification channel.
- Give a name to this channel. I am using "MySQL email channel."
- Select Email from "Type" as we want to send notifications over email.
- Check the "Send on all alerts" in case you want email on all alerts.
- Select the checkbox of "Include image" in case you want to include the image of the panel as the body in the notification email.
- Add the target email in "Email addresses" text area. You can use multiple email address separated by ";".
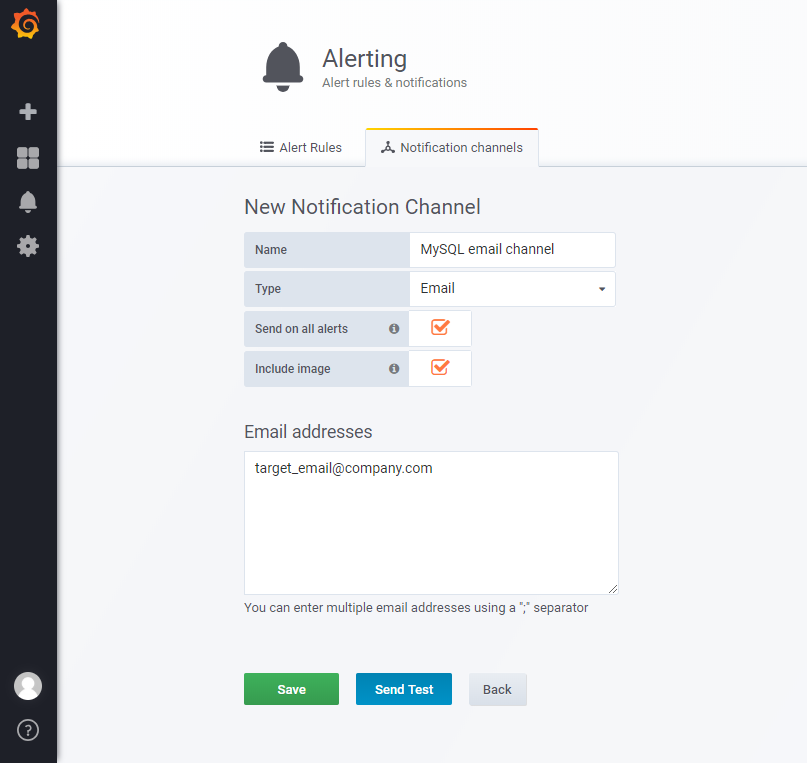
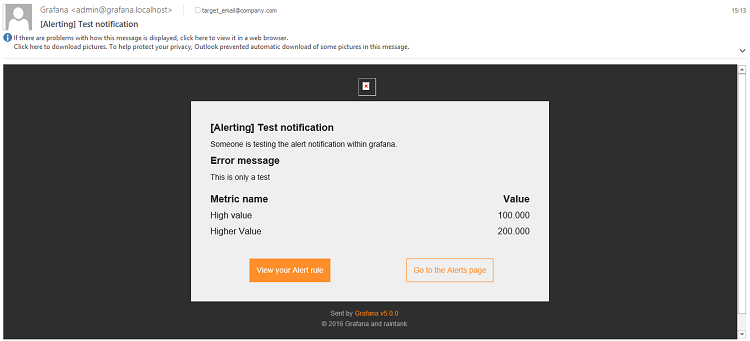
- Click on "Send Test" if you want to verify your settings. This will send a sample email using the SMTP details we configured earlier. Click on "Save" to add this channel. Below is the screenshot of the test email sent by Grafana.
 Create Alert
- Select the panel where you want to create an alert. And click on "Edit." I am using the "connections" panel we added in our dashboard to monitor active connections.
- Click on the "Alert" tab and click on "Create Alert." This will open the form for configuring alert.
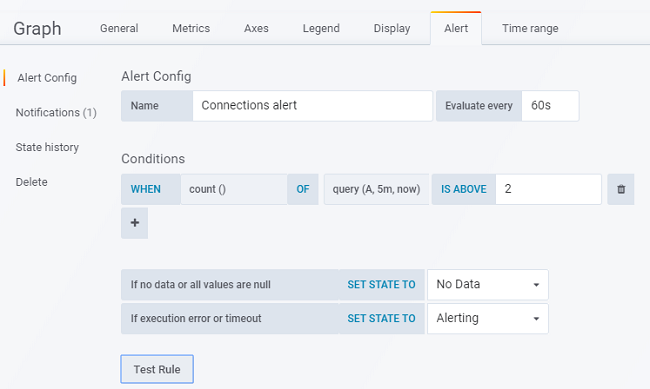
- Select the Alert Config which is selected by default.
Name: Give a suitable name to this alert.
Evaluate Every: The time interval on which you want this rule to be evaluated, where "h" means hours, "m" means minutes, and "s" means seconds.
I am using 5s (5 seconds). In production, you might want to set this to higher values.
- Click on the function name in the "Conditions" section and change it to the desired function. I am using "Count()" as we want to validate our rule against the count of active connections.
In function "query (A, 5m, now)".- The first argument (A) is the query id to be used form all the queries which we have configured in "Metrics" tab. As we have the connection count query in section "A".
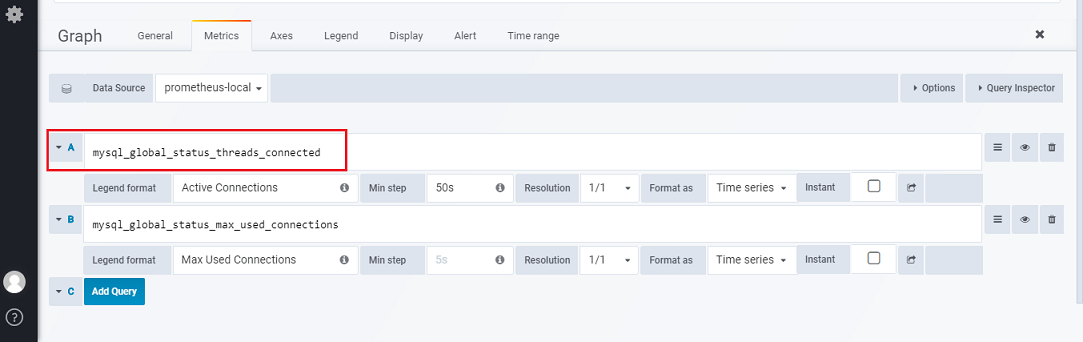
- The second and third argument is used to form the time range. Our query means 5 minutes back from now.
- The first argument (A) is the query id to be used form all the queries which we have configured in "Metrics" tab. As we have the connection count query in section "A".
- You can validate your rule by clicking on 'Test Rule.' If the rule has any errors, then it will display the error. My final setup is as follows.
- Select the "Notifications" section. This will have our earlier configured notification channel in "Send to."
- You can use multiple channels by clicking on the "+" icon and choose from the list displayed. Add the message you want to be included in email in "Message" section.
Save your configuration by pressing "CTRL+S" provide the comments if asked for. My final configurations are as below.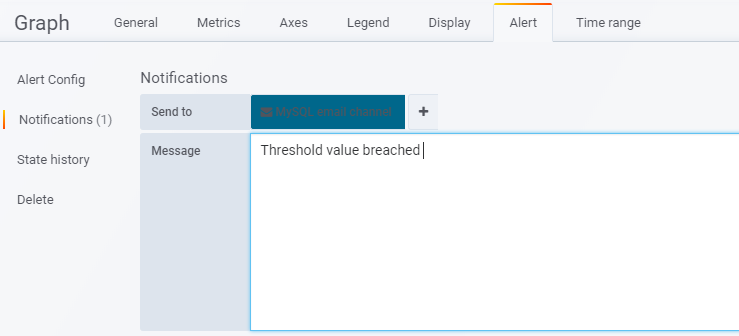
Add Alert List (Optional)
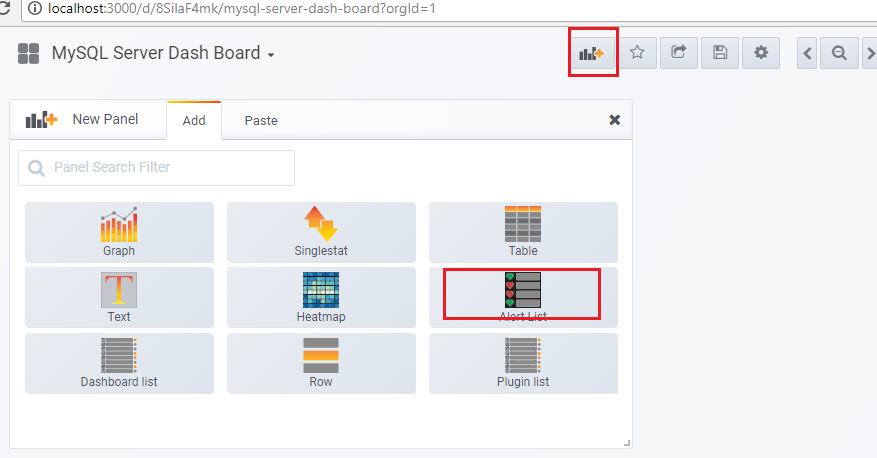
- Navigate to your MySQL dashboard we created.
- Click on the graph icon on the top bar and select "Alert List."
- This will add a panel displaying list and status of all the configured alerts.
This is all the settings/steps we need to create the alert and email notification in Grafana. You shall be able to see a dotted line on the graph whenever the rule is fired also you will receive an email on the SMTP settings you configured. You can see the spike in the graph where the threshold value is breached and the Alert was fired.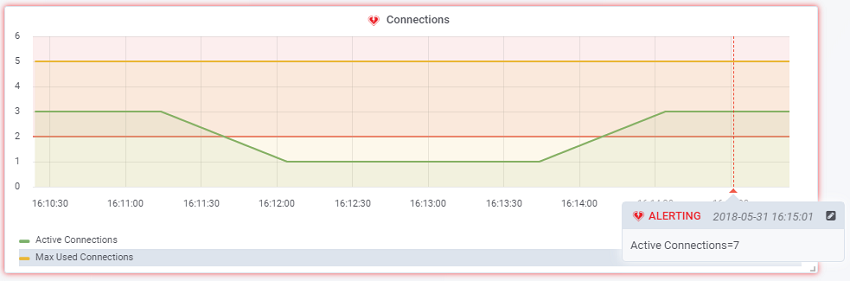
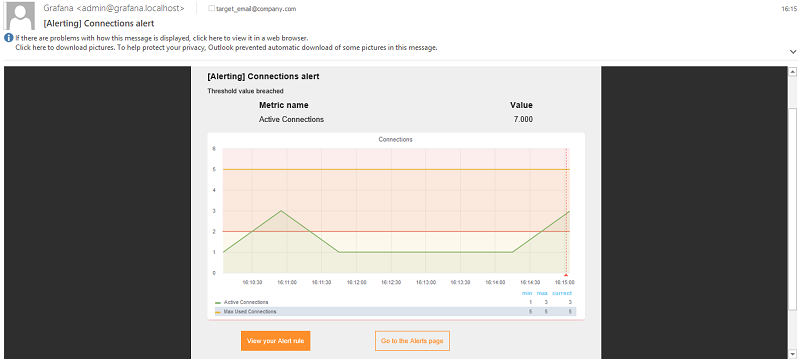
And here is the email I received on the fakeSMTP-2 server with the snapshot of the graph and breaching values.
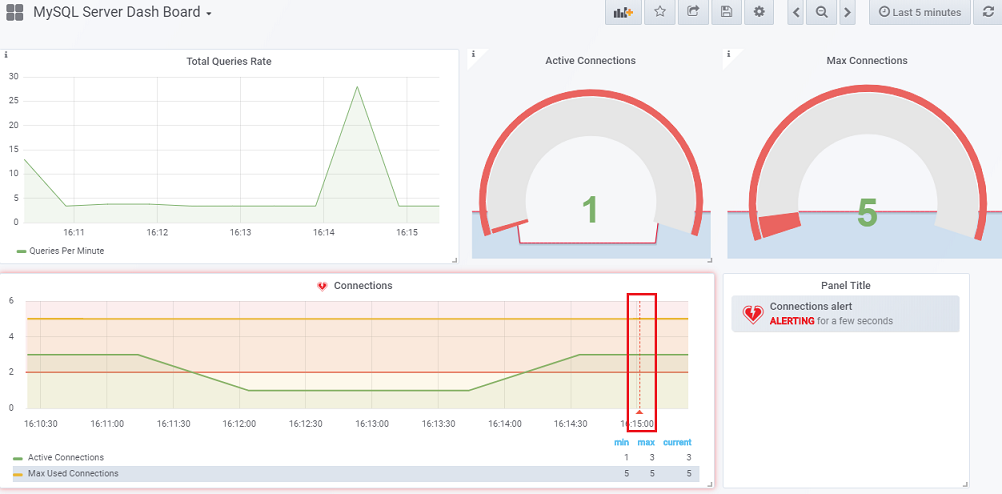
Below is the screenshot of my final dashboard with all alerts and notifications configured. You can get the JSON for this dashboard from this GitHub repository and can directly import this dashboard for your Grafana + Prometheus + mysqld_exporter setup.
Opinions expressed by DZone contributors are their own.
Comments