How To Collaborate On Troubleshooting Using VSCode Live Share and Lightrun
Microsoft's VSCode Native IDE Live Share feature equipped with Dynamic Observability from the Lightrun platform expedites developers debugging processes.
Join the DZone community and get the full member experience.
Join For FreeModern application development environments are complicated, with many layers of abstraction.
Amongst all this complexity, a major challenge for developers is pinpointing the root cause of an issue and adding the right telemetry in the right place to assess the situation and get the issues resolved quickly.
Developer time is precious, yet they spend a huge amount of it sifting through code, trying to identify vulnerabilities and determine what needs to be done to remediate them.
Yet, no developer is an island!
The ability to bounce ideas off a colleague in real time or just get a second opinion can often provide that extra inspiration needed to crack a particularly difficult problem more quickly or reveal a better approach. In particular, those colleagues who are much more familiar with a given application or have a lot of experience can massively expedite a troubleshooting session by lending their expertise.
That’s why collaboration with peers and colleagues on tricky issues can help teams to resolve issues much more quickly, meet SLAs, reduce MTTR, and increase developer productivity.
But devs working remotely can’t see each others’ IDEs or the telemetry that is informing their troubleshooting. That’s why we’re seeing a new generation of developer collaboration tooling emerge to help bridge the gap between them.
Developer Collaboration Tools: Using Lightrun and VSCode Live Share To Expedite Troubleshooting
A powerful combination of developers' tools is using VSCode Live Share alongside Lightrun to collaborate with peers on troubleshooting and debugging.
Lightrun is our developer observability platform. It enables developers to add logs, metrics, and snapshots to live applications in real time — without having to release a new version or even stop the running process. In addition and in parallel to using Lightrun with VSCode Live Share, users can utilize the sharing snapshot hit feature within the Lightrun IDE plugin. With that feature, once a virtual breakpoint (snapshot) is captured, developers can share it in various ways: via Jira, Slack, or direct read-only link.
Live Share is an extension for Visual Studio Code that enables real-time collaboration between developers. It enables you to collaborate with a peer on the same code without the need to sync code, clone a repo, or to configure the same development tools, settings, or environment. It’s like Google Docs but for code!
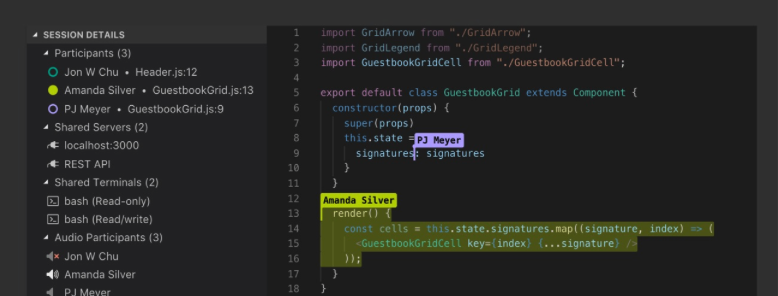
Using these tools in combination enables a powerful new practice to accelerate troubleshooting: you can collaborate as a team to add real-time telemetry to your live application, observe the outputs and collectively decide the next best action.
How To Collaboratively Troubleshoot
Here’s how you might use Lightrun and VSCode Live Share together to troubleshoot:
- Open a read-only session from their VS Code IDE and share it with colleagues
- Use Lightrun to add dynamic logs and snapshots (virtual breakpoints) to the live application in real time
- Allow your peers to monitor the stack traces and other outputs from the Lightrun consoles directly using the VSCode IDE
- Get immediate peer feedback as to whether more telemetry is needed (which can be added straight away) or collaborate to determine how to resolve the issue
- Work together to add more telemetry using Lightrun or start resolving the issue
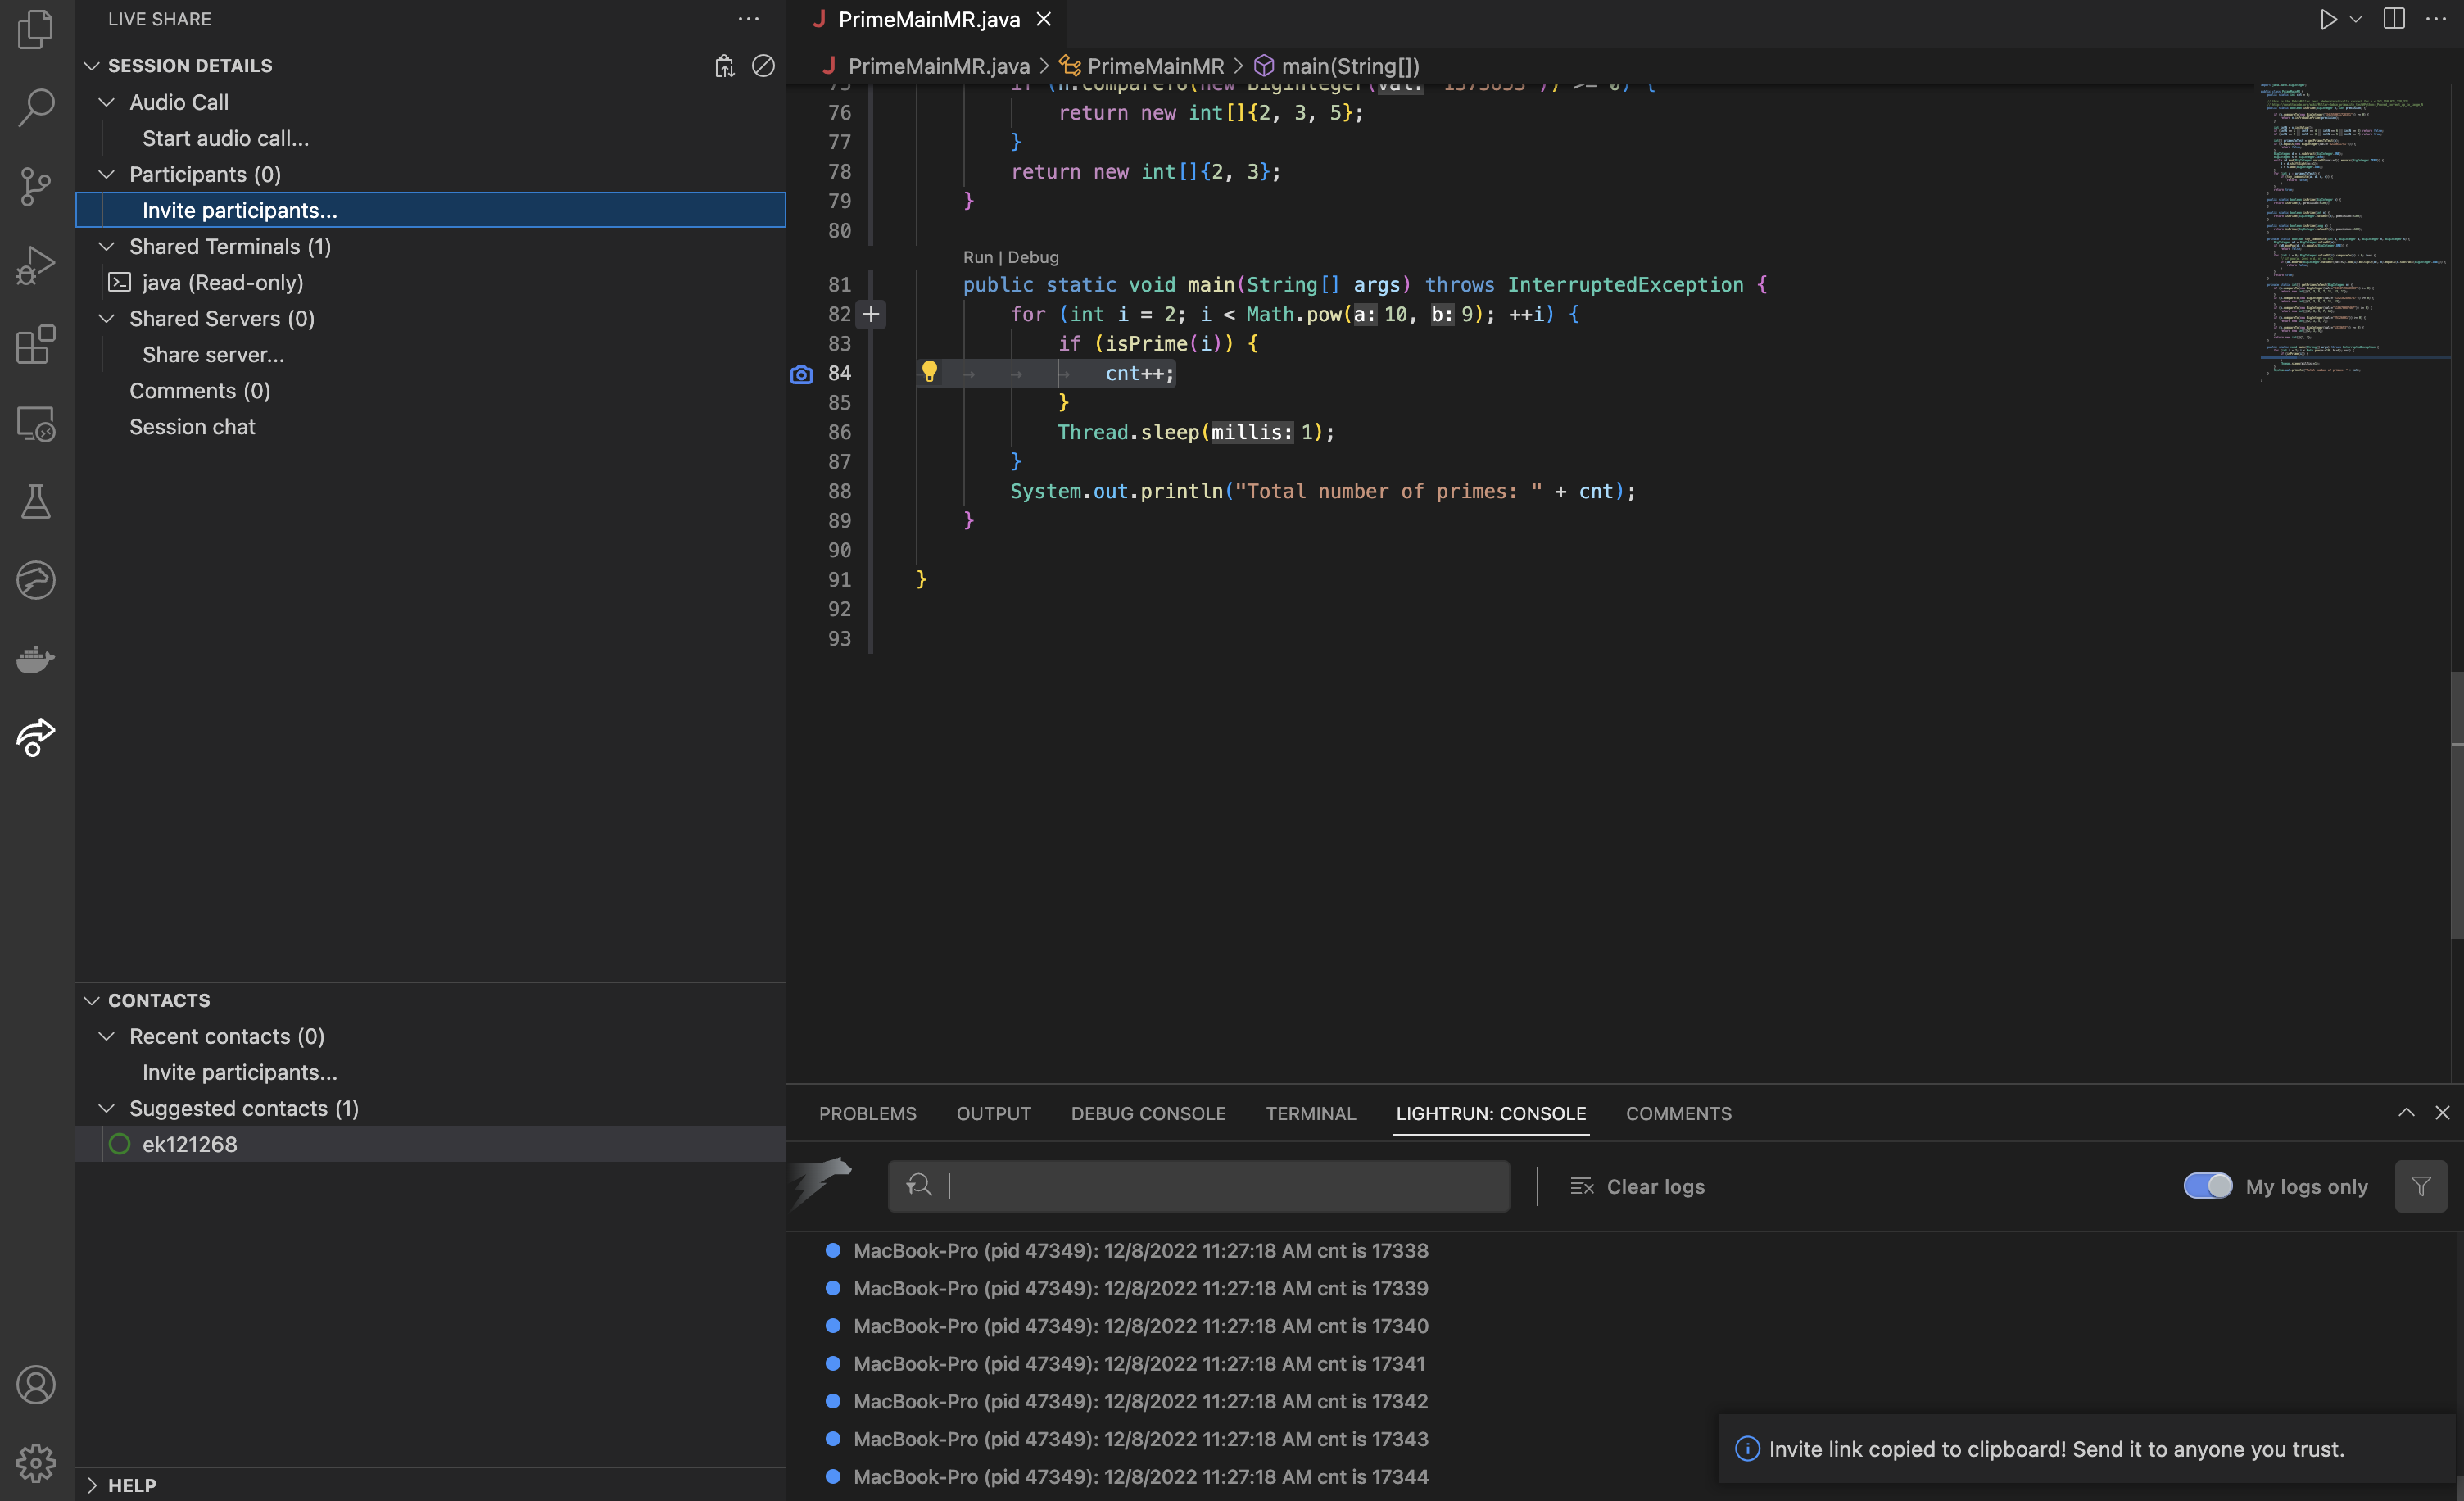
As noted in the caption, the above is a screenshot taken from the VSCode IDE where a snapshot (virtual breakpoint during app runtime) from Lightrun was taken and a Live Share link is ready to be shared with other developers for feedback and observability throughout the process.
Benefits of Collaborative Troubleshooting
- No more context switching
Share your troubleshooting session and collaborate with colleagues straight from your IDE, without having to use other tools or switch context.
Draw on peer expertise
Your colleagues already have the answers to many of the questions you might want to ask about a certain application. Rather than figuring everything out yourself, you can use their expertise and experience to save time.
Real-time feedback
As you are adding new logs and snapshots, your peers can give you real-time feedback on the state of the application and stack traces, helping to guide your troubleshooting efforts.
Ultimately, the combination of real-time, on-demand telemetry and real-time feedback from colleagues is a fantastically time-saving practice that can help to lower debugging cycle times and massively boost developer productivity.
Opinions expressed by DZone contributors are their own.
Comments