How to Create a Simple Gantt Chart Using CSS Grid
In this article, we discuss how to create a simple Gantt chart using CSS Grid to better manage your project workloads.
Join the DZone community and get the full member experience.
Join For FreeA Gantt chart is a handy type of bar chart that is used in project management for showcasing a schedule of tasks. This chart visualizes project activities as cascading horizontal bars, with width depicting the project’s duration.
As a front-end web designer or developer, you can make use of Gantt charts to manage projects and enhance the productivity within your team.
In this article, I’m going to show you how to create a simple Gantt chart using the CSS Grid Layout system—no external libraries or other fluff, just pure CSS.
You may also like: Redesigning a Website Using CSS Grid and Flexbox.
You can reference this tutorial to understand how to use the layout system for applying CSS rules.
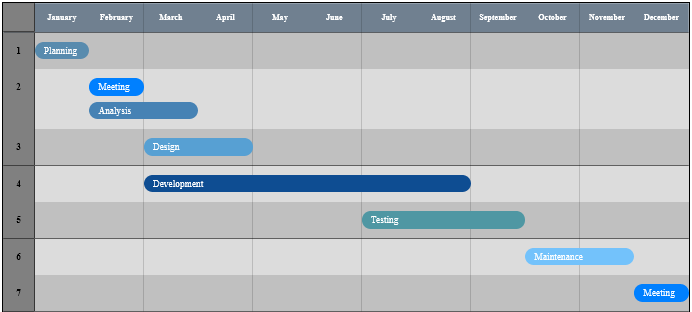
The chart will show a typical software development life cycle process, from January to December.
Here is a screenshot of how the Gantt chart will look at the end of this tutorial:
Step 1: Create a Container div
Let’s start by creating a container div element for the Gantt Chart:
xxxxxxxxxx
<div class="container">
</div>
Let’s add some CSS styling to it:
xxxxxxxxxx
.container {
max-width: 1200px;
min-width: 650px;
margin: 0 auto;
padding: 50px;
}
Step 2: Create a Chart div
Let’s create a div inside the overarching container and name it chart. This is where all the remaining actions are going to take place.
xxxxxxxxxx
<div class="chart">
</div>
Let’s add some CSS styling to it:
xxxxxxxxxx
.chart {
display: grid;
border: 2px solid #000;
position: relative;
overflow: hidden;
}
Notice that I’ve set the display property of the class to grid. Consequently, all its direct children will automatically become grid items.
Step 3: Create the Chart’s Rows
Let’s start by creating the first row, which will be the heading of the Gantt chart.
x
<div class="chart-row chart-period">
<div class="chart-row-item">
</div><span>January</span><span>February</span>span>March</span>
<span>April</span><span>May</span><span>June</span><span>July</span>
<span>August</span><span>September</span><span>October</span>
<span>November</span><span>December</span>
</div>
Notice that I’ve provided 12 span elements that will transverse the entire row, showing the months of the project’s duration — from January to December.
Here is its CSS:
xxxxxxxxxx
.chart-row {
display: grid;
grid-template-columns: 50px 1fr;
background-color: #DCDCDC;
}
xxxxxxxxxx
.chart-period {
color: #fff;
background-color: #708090 !important;
border-bottom: 2px solid #000;
grid-template-columns: 50px repeat(12, 1fr);
}
.chart-period > span {
text-align: center;
font-size: 13px;
align-self: center;
font-weight: bold;
padding: 15px 0;
}
Notice that I used the grid-template-columns property to specify the width and the number of columns in the grid layout.
Let’s see how it looks in a browser, so far:

Next, let’s add lines that will run throughout the chart in a box-like style, which helps showcase the duration of each project.
I also used 12 span elements for creating the lines.
xxxxxxxxxx
<div class="chart-row chart-lines">
<span></span><span></span><span></span>
<span></span><span></span><span></span>
<span></span><span></span><span></span>
<span></span><span></span> <span></span>
</div>
Here is its CSS:
xxxxxxxxxx
.chart-lines {
position: absolute;
height: 100%;
width: 100%;
background-color: transparent;
grid-template-columns: 50px repeat(12, 1fr);}
.chart-lines > span {
display: block; border-right: 1px solid rgba(0, 0, 0, 0.3);
}
Let’s see the output in a browser:

Step 4: Add Entry Items
Finally, let’s add the items that illustrate a year-long process of creating some software.
For example, here is how I added the first entry item:
xxxxxxxxxx
<div class="chart-row">
<div class="chart-row-item">1</div>
<ul class="chart-row-bars">
<li class="chart-li-one">Planning</li>
</ul>
</div>
Let me describe what is happening in the code above:
- First, the encompassing div element has a class of chart-row, which I illustrated earlier.
- The div with a class of chart-row-item is used for numbering the entry items on the Gantt chart. Here is its CSS:
- To show tasks on the Gantt chart, I created an unordered list and styled it to display a horizontal bar, with its length showing the duration of the task.
Here is the CSS styling for the chart-row-bars class:
xxxxxxxxxx
.chart-row-bars {
list-style: none;
display: grid; padding: 15px 0;
margin: 0;
grid-template-columns: repeat(12, 1fr);
grid-gap: 10px 0;
border-bottom: 1px solid #000;
}
- The entry item is defined in the li tag. Here is its CSS styling:
xxxxxxxxxx
li {
font-weight: 450;
text-align: left;
font-size: 15px; min-height: 15px;
background-color: #708090;
padding: 5px 15px; color: #fff;
overflow: hidden;
position: relative;
cursor: pointer;
border-radius: 15px;
}
ul .chart-li-one {
grid-column: 1/2;
background-color: #588BAE;
}
Notice that I’ve used the grid-column property to specify the duration of the project.
For example, a property of grid-column: 3/9; like the “Development” entry, spans a task across the grid from March to August.
Here is how the first entry item looks in a browser:

I added the other entries on the chart following the same process as the first entry.
Ultimately, it resulted in a nice-looking Gantt chart, just like the image I showed earlier.
Wrapping Up
That’s it! You can view the entire code for this tutorial on CodePen:
As you’ve seen, creating a Gantt chart using CSS Grid is not complicated. With this type of chart, you can manage your web development projects effectively and ensure that everyone is on track toward accomplishing the stipulated objectives.
Furthermore, Gantt charts can also be used in other industries to manage projects. For example, if you are selling composting toilets, you can use Gantt charts to showcase the number of sales made over a period of time.
Of course, I’ve just scratched the surface about the things you can achieve with Gantt charts.
There are several other tweaks you can make to Gantt charts to suit your specific requirements and project goals.
For example, you can use them to show the relationship between various tasks and how the completion of one relies on another, show how resources can be allocated for the success of projects, and show clear project requirements that ensure everyone is on the same page.
Do you have any questions or comments?
Please get in touch and I’ll do my best to respond.
This article first appeared on freeCodeCamp.
Further Reading
Published at DZone with permission of Alfrick Opidi. See the original article here.
Opinions expressed by DZone contributors are their own.
Comments